Canada Power Grid Climate Resilience integrates extreme weather planning, microgrids, battery storage, renewable energy, vegetation management, and undergrounding to reduce outages, harden infrastructure, modernize utilities, and safeguard reliability during storms, ice events, and wildfires.
Key Points
Canada's grid resilience hardens utilities against extreme weather using microgrids, storage, renewables, and upgrades.
✅ Grid hardening: microgrids, storage, renewable integration
✅ Vegetation management reduces storm-related line contact
✅ Selective undergrounding where risk and cost justify
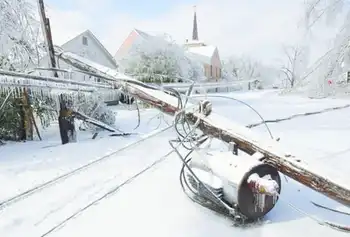
The increasing intensity of storms that lead to massive power outages highlights the need for Canada’s electrical utilities to be more robust and innovative, climate change scientists say.
“We need to plan to be more resilient in the face of the increasing chances of these events occurring,” University of New Brunswick climate change scientist Louise Comeau said in a recent interview.
The East Coast was walloped this week by the third storm in as many days, with high winds toppling trees and even part of a Halifax church steeple, underscoring the value of storm-season electrical safety tips for residents.
Significant weather events have consistently increased over the last five years, according to the Canadian Electricity Association (CEA), which has tracked such events since 2003.
#google#
Nearly a quarter of total outage hours nationally in 2016 – 22 per cent – were caused by two ice storms, a lightning storm, and the Fort McMurray fires, which the CEA said may or may not be classified as a climate event.
“It (climate change) is putting quite a lot of pressure on electricity companies coast to coast to coast to improve their processes and look for ways to strengthen their systems in the face of this evolving threat,” said Devin McCarthy, vice president of public affairs and U.S. policy for the CEA, which represents 40 utilities serving 14 million customers.
The 2016 figures – the most recent available – indicate the average Canadian customer experienced 3.1 outages and 5.66 hours of outage time.
McCarthy said electricity companies can’t just build their systems to withstand the worst storm they’d dealt with over the previous 30 years. They must prepare for worse, and address risks highlighted by Site C dam stability concerns as part of long-term planning.
“There needs to be a more forward looking approach, climate science led, that looks at what do we expect our system to be up against in the next 20, 30 or 50 years,” he said.
Toronto Hydro is either looking at or installing equipment with extreme weather in mind, Elias Lyberogiannis, the utility’s general manager of engineering, said in an email.
That includes stainless steel transformers that are more resistant to corrosion, and breakaway links for overhead service connections, which allow service wires to safely disconnect from poles and prevents damage to service masts.
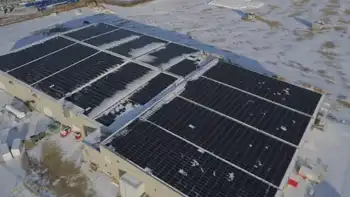
Comeau said smaller grids, tied to electrical systems operated by larger utilities, often utilize renewable energy sources such as solar and wind as well as battery storage technology to power collections of buildings, homes, schools and hospitals.
“Capacity to do that means we are less vulnerable when the central systems break down,” Comeau said.
Nova Scotia Power recently announced an “intelligent feeder” pilot project, which involves the installation of Tesla Powerwall storage batteries in 10 homes in Elmsdale, N.S., and a large grid-sized battery at the local substation. The batteries are connected to an electrical line powered in part by nearby wind turbines.
The idea is to test the capability of providing customers with back-up power, while collecting data that will be useful for planning future energy needs.
Tony O’Hara, NB Power’s vice-president of engineering, said the utility, which recently sounded an alarm on copper theft, was in the late planning stages of a micro-grid for the western part of the province, and is also studying the use of large battery storage banks.
“Those things are coming, that will be an evolution over time for sure,” said O’Hara.
Some solutions may be simpler. Smaller utilities, like Nova Scotia Power, are focusing on strengthening overhead systems, mainly through vegetation management, while in Ontario, Hydro One and Alectra are making major investments to strengthen infrastructure in the Hamilton area.
“The number one cause of outages during storms, particularly those with high winds and heavy snow, is trees making contact with power lines,” said N.S. Power’s Tiffany Chase.
The company has an annual budget of $20 million for tree trimming and removal.
“But the reality is with overhead infrastructure, trees are going to cause damage no matter how robust the infrastructure is,” said Matt Drover, the utility’s director for regional operations.
“We are looking at things like battery storage and a variety of other reliability programs to help with that.”
NB Power also has an increased emphasis on tree trimming and removal, and now spends $14 million a year on it, up from $6 million prior to 2014.
O’Hara said the vegetation program has helped drive the average duration of power outages down since 2014 from about three hours to two hours and 45 minutes.
Some power cables are buried in both Nova Scotia and New Brunswick, mostly in urban areas. But both utilities maintain it’s too expensive to bury entire systems – estimated at $1 million per kilometre by Nova Scotia Power.
The issue of burying more lines was top of mind in Toronto following a 2013 ice storm, but that’s city’s utility also rejected the idea of a large-scale underground system as too expensive – estimating the cost at around $15 billion, while Ontario customers have seen Hydro One delivery rates rise in recent adjustments.
“Having said that, it is prudent to do so for some installations depending on site specific conditions and the risks that exist,” Lyberogiannis said.
Comeau said lowering risks will both save money and disruption to people’s lives.
“We can’t just do what we used to do,” said Xuebin Zhang, a senior climate change scientist at Environment and Climate Change Canada.
“We have to build in management risk … this has to be a new norm.”
Related News