Narragansett residents surveyed about wind power

By Associated Press


High Voltage Maintenance Training Online

Our customized live online or in‑person group training can be delivered to your staff at your location.

  • Live Online
  • 12 hours Instructor-led
  • Group Training Available
Regular Price:
$599
Coupon Price:
$499
Reserve Your Seat Today
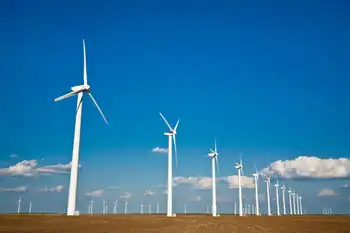
Surveys being sent to Narragansett residents could offer a glimpse into how coastal residents feel about wind turbines in the Ocean State before it attempts to build a larger, first-in-the-nation wind farm miles off Block Island.

Questionnaires have been sent to about 800 randomly selected residents, state officials said. The 34-question survey asks readers about their feelings on the state's renewable energy goals, whether they consider wind turbines attractive and whether seeing a wind turbine would affect their visits to the beach.

The responses should be returned to state authorities next month.

"In order for something to be successful, you really need to know what people are thinking," said Thomas Getz, an assistant to the director of the Department of Environmental Management, who is overseeing the surveys.

Public reaction remains a major wild card in developing wind power projects. Local opposition over aesthetics and other concerns have caused years-long delays for a developer seeking to build a wind farm in Nantucket Sound off Cape Cod, Mass., which is still awaiting final federal approval.

Opposition to wind turbines remains largely untested in Rhode Island, which has only a handful of operating ones.

Gov. Don Carcieri's administration recently selected Hoboken, N.J.-based Deepwater Wind LLC to build a large wind farm capable of generating about 15 percent of the state's electricity needs miles off Rhode Island's coast. The company still needs to secure financing and must seek permits before construction could begin.

In the near term, Narragansett and the state DEM are interested in building onshore wind turbines at five sites in Narragansett, a blustery coastal town on Narragansett Bay, including locations near the Port of Galilee and a wastewater treatment facility near Scarborough State Beach.

The goal is to construct wind turbines that could power specific buildings or facilities and sell surplus energy generated by the wind turbines back into the power grid for others to use. Authorities want the project built by the end of next year.

Four companies — Ameresco Inc., Chevron Energy Solutions, Solaya Energy LLC and Verterra Renewable Energy — have submitted bids to build up to five wind turbines on some or all of those sites. No selections have been made, and DEM officials declined Tuesday to release the proposals.

Related News

Buyer's Remorse: Questions about grid modernization affordability

Grid Modernization drives utilities to integrate DER, AMI, and battery storage while balancing reliability, safety, and affordability; regulators pursue cost-benefit analyses, new rate design, and policy actions to guide investment and protect customer-owned resources.


Key Points

Upgrading the grid to manage DER with digital tools, while maintaining reliability, safety, and customer affordability.

✅ Cost-benefit analyses guide prudent grid investments

✅ AMI and storage deployments enable DER visibility and control

✅ Rate design reforms support customer-owned resources


Utilities’ pursuit of a modern grid, including the digital grid concept, to maintain the reliability and safety pillars of electricity delivery has raised a lot of questions about the third pillar — affordability.

Utilities are seeing rising penetrations of emerging technologies, highlighted in recent grid edge trends reports, like distributed solar, behind-the-meter battery storage, and electric vehicles. These new distributed energy resources (DER) do not eliminate utilities' need to keep distribution systems safe and reliable.

But the need for modern tools to manage DER imposes costs on utilities, prompting calls to invest in smarter infrastructure even as some regulators, lawmakers and policymakers are concerned those costs could drive up electricity rates.

The result is an increasing number of legislative and regulatory grid modernization actions aimed at identifying what is necessary to serve the coming power sector transformation and address climate change risks across the grid.


The rise of grid modernization

Grid modernization, which is supported by both conservatives and distributed energy resources advocates, got a lot of attention last year. According to the 2017 review of grid modernization policy by the North Carolina Clean Energy Technology Center (NCCETC), 288 grid modernization policy actions were proposed, pending or enacted in 39 states.

These numbers from NCCETC's first annual review of policy activity set a benchmark against which future years' activity can be measured.

The most common type of state actions, by far, were those that focused on the deployment of advanced metering infrastructure (AMI) and battery energy storage. Those are two of the 2017 trends identified in NCCETC’s 50 States of Grid Modernization report. But deployment of those technologies, while foundational to an updated grid, only begins to prepare distribution systems for the coming power sector transformation.

Bigger advances, including the newest energy system management tools, are being held back by 2017’s other policy actions requiring more deliberation and fact-finding, even as grid vulnerability report cards underscore the risks that modernization seeks to mitigate.

Utilities’ proposals to more fully prepare their grids to deliver 21st century technologies are being met with questions about completeness and cost.

Utilities are being asked to address these questions in comprehensive, public utility commission-led cost-benefit analyses and studies. This is also one of NCCETC’s top 2017 policy action trends for grid modernization. The outcome to date appears to be an increased, but still incomplete, understanding of what is needed to build a 21st century grid.

Among the top objectives of those driving the policy actions are resolving questions about private sector participation in grid modernizaton buildouts and developing new rate designs to protect and support customer-owned distributed energy resources. Actions on those topics are also on NCCETC’s list of 2017 policy trends.

Altogether, the trend list is dominated by actions that do not lead to completion of grid modernization but to more work on it.


Related News

View more

U.S. residential electricity bills increased 5% in 2022, after adjusting for inflation

U.S. Residential Electricity Bills rose on stronger demand, inflation, and fuel costs, with higher retail prices, kWh consumption, and extreme weather driving 2022 spikes; forecasts point to stable summer usage and slight price increases.


Key Points

They are average household power costs shaped by prices, kWh use, weather, and upstream fuel costs.

✅ 2022 bills up 13% nominal, 5% real vs. 2021

✅ Retail price rose 11%; consumption up 2% to 907 kWh

✅ Fuel costs to plants up 34%, pressuring rates


In nominal terms, the average monthly electricity bill for residential customers in the United States increased 13% from 2021 to 2022, rising from $121 a month to $137 a month. After adjusting for inflation—which reached 8% in 2022, a 40-year high—electricity bills increased 5%. Last year had the largest annual increase in average residential electricity spending since we began calculating it in 1984. The increase was driven by a combination of more extreme temperatures, which increased U.S. consumption of electricity for both heating and cooling, and higher fuel costs for power plants, which drove up retail electricity prices nationwide.

Residential electricity customers’ monthly electricity bills are based on the amount of electricity consumed and the retail electricity price. Average U.S. monthly electricity consumption per residential customer increased from 886 kilowatthours (kWh) in 2021 to 907 kWh in 2022, even as U.S. electricity sales have declined over the past seven years. Both a colder winter and a hotter summer contributed to the 2% increase in average monthly electricity consumption per residential customer in 2022 because customers used more space heating during the winter and more air conditioning during the summer, with some states, such as Pennsylvania, facing sharp winter rate increases.

Although we don’t directly collect retail electricity prices, we do collect revenues from electricity providers that allow us to determine prices by dividing by consumption, and industry reports show major utilities spending more on electricity delivery than on power production. In 2022, the average U.S. residential retail electricity price was 15.12 cents/kWh, an 11% increase from 13.66 cents/kWh in 2021. After adjusting for inflation, U.S. residential electricity prices went up by 2.5%.

Higher fuel costs for power plants drove the increase in residential retail electricity prices. The cost of fossil fuels—including natural gas prices, coal, and petroleum—delivered to U.S. power plants increased 34%, from $3.82 per million British thermal units (MMBtu) in 2021 to $5.13/MMBtu in 2022. The higher fuel costs were passed along to residential customers and contributed to higher retail electricity prices, and Germany power prices nearly doubled over a year in a related trend.

In the first three months of 2023, the average U.S. residential monthly electricity bill was $133, or 5% higher than for the same time last year, according to data from our Electric Power Monthly. The increase was driven by a 13% increase in the average U.S. residential retail electricity price, which was partly offset by a 7% decrease in average monthly electricity consumption per residential customer, and industry outlooks also see U.S. power demand sliding 1% on milder weather. This summer, we expect that typical household electricity bills will be similar to last year’s, with customers paying about 2% more on average. The slight increase in electricity costs forecast for this summer stems from higher retail electricity prices but similar consumption levels as last summer.


Related News

View more

Renewable power surpasses fossil fuels for first time in Europe

EU Renewable Power Overtakes Fossil Fuels, reflecting a greener energy mix as wind, solar, and hydro expand, cutting CO2 emissions and curbing coal while negative prices rise amid pandemic-driven demand drops.


Key Points

A milestone as renewables surpass fossil power in the EU, driven by wind, solar, hydro growth and pandemic demand.

✅ 40% renewables vs 34% fossil in H1 across 27 EU states

✅ Wind, solar, hydro rose; coal generation fell 32% year-on-year

✅ Lower demand, carbon prices, grid priority boosted clean output


Renewable power for the first time contributed a bigger share in the European generation mix than fossil fuels, as described in Europe's green surge as the fallout from the pandemic cut energy demand.

About 40 percent of the electricity in the first half in the 27 EU countries came from renewable sources, exceeding the global renewables share reported elsewhere, compared with 34 percent from plants burning fossil fuels, according to environmental group Ember in London. As a result, carbon dioxide emissions from the power sector fell 23 percent.

The rise is significant and encouraging for law makers as Europe prepares to spend billions of euros to recover from the virus, with wind power investments underscoring the momentum, and set the bloc on track to neutralize its carbon footprint by the middle of the century.

“This marks a symbolic moment ​in the transition of Europe’s electricity sector,” said Dave Jones, an electricity analyst at Ember. “For countries like Poland and Czech Republic grappling with how to get off coal, there is now a clear way out.”

While power demand slumped, output from wind and solar farms increased, reflecting global wind and solar gains, because more plants came online in breezy and sunny weather. At the same time, wet conditions boosted hydro power in Iberia and the Nordic markets.

Those conditions helped renewables become a rare bright spot throughout the economic tumult this year. In many areas, renewable sources of electricity have priority to the grid, meaning they could keep growing even as demand shrank and other power plants were turned off.

Electricity demand in the EU fell 7 percent overall. Fossil-fuel power generation plunged 18 percent in the first half compared with a year earlier. Renewable generation grew by 11 percent, according to Ember.

Coal was by far the biggest loser in 2020. It’s one of the most-polluting sources of power and its share is slumping in Europe as the price of carbon increases, with renewables surpassing coal in the US illustrating the broader shift, and governments move to cut emissions. Power from coal fell 32 percent across the EU.

Despite the economics, the decision to shut off coal for good will come down to political agreements between producers and governments, while reducing reliance on Russian energy reshapes policy debates.

One consequence of the jump in renewables is that negative prices have increased, as solar is reshaping prices in Northern Europe in similar ways. On particularly windy or sunny days when there isn’t much demand, the grid can be flooded with power. That’s leading wind farms to be shut off and customers to be paid to consume electricity.


Related News

View more

Summerland solar power project will provide electricity

Summerland Solar+Storage Project brings renewable energy to a municipal utility with photovoltaic panels and battery storage, generating 1,200 megawatts from 3,200 panels on Cartwright Mountain to boost grid resilience and local clean power.


Key Points

A municipal solar PV and battery system enabling Summerland Power to self-generate electricity on Cartwright Mountain.

✅ 3,200 panels, 20-year batteries, 35-year panel lifespan

✅ Estimated $7M cost, $6M in grants, utility reserve funding

✅ Site near grid lines; 2-year timeline with 18-month lead


A proposed solar energy project, to be constructed on municipally-owned property on Cartwright Mountain, will allow Summerland Power to produce some of its own electricity, similar to how Summerside's wind power supplies a large share locally.

On Monday evening, municipal staff described the Solar+Storage project, aligning with insights from renewable power developers that combining resources yields better projects.

The project will include around 3,200 solar panels and storage batteries, giving Summerland Power the ability to generate 1,200 megawatts of electrical power.

This is the amount of energy used by 100 homes over the course of a year.

The solar panels have an estimated life expectancy of 35 years, while the batteries have a life expectancy of 20 years.

“It’s a really big step for a small utility like ours,” said Tami Rothery, sustainability/alternative energy coordinator for Summerland. “We’re looking forward to moving towards a bright, sunny energy future.”

She said the price of solar panels has been dropping, with lower-cost solar contracts reported in Alberta, and the quality and efficiency of the panels has increased in recent years.

The total cost of the project is around $7 million, with $6 million to come from grant funding and the remainder to come from the municipality’s electrical utility reserve fund, while policy changes such as Nova Scotia's solar charge delay illustrate evolving market conditions.

The site, a former public works yard and storage area, was selected from 108 parcels of land considered by the municipality.

She said the site, vacant since the 1970s, is close to main electrical lines and will not be highly visible once the panels are in place, much like unobtrusive rooftop solar arrays in urban settings.

Access to the site is restricted, resulting in natural security to the solar installation.

Jeremy Storvold, general manager of Summerland’s electrical utility, said the site is 2.5 kilometres from the Prairie Valley electrical substation and close to the existing public works yard.

However, some in the audience on Monday questioned the location of the proposed solar installation, suggesting the site would be better suited for affordable housing in the community.

The timeline for the project calls for roughly two years before the work will be completed, since there is an 18-month lead time in order to receive good quality solar panels, reflecting the surge in Alberta's solar growth that is straining supply chains.


Related News

View more

US NRC streamlines licensing for advanced reactors

NRC Advanced Reactor Licensing streamlines a risk-informed, performance-based, technology-inclusive pathway for advanced non-light water reactors, aligning with NEIMA to enable predictable regulatory reviews, inherent safety, clean energy deployment, and industrial heat, hydrogen, and desalination applications.


Key Points

A risk-informed, performance-based NRC pathway streamlining licensing for advanced non-light water reactors.

✅ Aligned with NEIMA: risk-informed, performance-based, tech-inclusive

✅ Predictable licensing for advanced non-light water reactor designs

✅ Enables clean heat, hydrogen, desalination beyond electricity


The US Nuclear Regulatory Commission (NRC) voted 4-0 to approve the implementation of a more streamlined and predictable licensing pathway for advanced non-light water reactors, aligning with nuclear innovation priorities identified by industry advocates, the Nuclear Energy Institute (NEI) announced, and amid regional reliability measures such as New England emergency fuel stock plans that have drawn cost scrutiny.

This approach is consistent with the Nuclear Energy Innovation and Modernisation Act (NEIMA), a nuclear innovation act passed in 2019 by the US Congress calling for the development of a risk-informed, performance-based and technology inclusive licensing process for advanced reactor developers.

NEI Chief Nuclear Officer Doug True said: “A modernised regulatory framework is a key enabler of next-generation nuclear technologies that, amid ACORE’s challenge to DOE subsidy proposals in energy market proceedings, can help us meet our energy needs while protecting the climate. The Commission’s unanimous approval of a risk-informed and performance-based licensing framework paves the way for regulatory reviews to be aligned with the inherent safety characteristics, smaller reactor cores and simplified designs of advanced reactors.”

Over the last several years the industry’s Licensing Modernisation Project, sponsored by US Department of Energy, led by Southern Nuclear, and supported by NEI’s Advanced Reactor Regulatory Task Force, and influenced by a presidential order to bolster uranium and nuclear energy, developed the guidance for this new framework. Amid shifts in the fuel supply chain, including the U.S. ban on Russian uranium, this approach will inform the development of a new rule for licensing advanced reactors, which NEIMA requires.

“A well-defined licensing path will benefit the next generation of nuclear plants, especially as regions consider New England market overhaul efforts, which could meet a wide range of applications beyond generating electricity such as producing heat for industry, desalinating water, and making hydrogen – all without carbon emissions,” True noted.


Related News

View more

Solar PV and wind power in the US continue to grow amid favourable government plans

US Renewable Power Outlook 2030 projects surging capacity, solar PV and wind growth, grid modernization, and favorable tax credits, detailing market trends, CAGR, transmission expansion, and policy drivers shaping clean energy generation and consumption.


Key Points

A forecast of US power capacity, generation, and consumption, highlighting solar, wind, tax credits, and grid modernization.

✅ Targets 48.4% renewable capacity share by 2030

✅ Strong growth in solar PV and onshore wind installations

✅ Investment and tax credits drive grid and transmission upgrades


GlobalData’s latest report, ‘United States Power Market Outlook to 2030, Update 2021 – Market Trends, Regulations, and Competitive Landscape’ discusses the power market structure of the United States and provides historical and forecast numbers for capacity, generation and consumption up to 2030. Detailed analysis of the country’s power market regulatory structure, competitive landscape and a list of major power plants are provided. The report also gives a snapshot of the power sector in the country on broad parameters of macroeconomics, supply security, generation infrastructure, transmission and distribution infrastructure, about a quarter of U.S. electricity from renewables in recent years, electricity import and export scenario, degree of competition, regulatory scenario, and future potential. An analysis of the deals in the country’s power sector is also included in the report.

Renewable power held a 19% share of the US’s total power capacity in 2020, and in that year renewables became the second-most prevalent source in the U.S. electricity mix by generation; this share is expected to increase significantly to 48.4% by 2030. Favourable policies introduced by the US Government will continue to drive the country’s renewable sector, particularly solar photovoltaics (PV) and wind power, with wind now the most-used renewable source in the U.S. generation mix. Installed renewable capacity* increased from 16.5GW in 2000 to 239.2GW in 2020, growing at a compound annual growth rate (CAGR) of 14.3%. By 2030, the cumulative renewable capacity is expected to rise to 884.6GW, growing at a CAGR of 14% from 2020 to 2030. Despite increase in prices of renewable equipment, such as solar modules, in 2021, the US renewable sector will show strong growth during the 2021 to 2030 period as this increase in equipment prices are short term due to supply chain disruptions caused by the Covid-19 pandemic.

The expansion of renewable power capacity during the 2000 to 2020 period has been possible due to the introduction of federal schemes, such as Production Tax Credits, Investment Tax Credits and Manufacturing Tax Credits. These have massively aided renewable installations by bringing down the cost of renewable power generation and making it at par with power generated from conventional sources. Over the last few years, the cost of solar PV and wind power installations has declined sharply, and by 2023 wind, solar, and batteries made up most of the utility-scale pipeline across the US, highlighting investor confidence. Since 2010, the cost of utility-scale solar PV projects decreased by around 82% while onshore wind installations decreased by around 39%. This has supported the rapid expansion of the renewable market. However, the price of solar equipment has risen due to an increase in raw material prices and supply shortages. This may slightly delay the financing of some solar projects that are already in the pipeline.

The US will continue to add significant renewable capacity additions during the forecast period as industry outlooks point to record solar and storage installations over the coming years, to meet its target of reaching 80% clean energy by 2030. In November 2021, President Biden signed a $1tr Infrastructure Bill, within which $73bn is designated to renewables. This includes not just renewable capacity building, but also strengthening the country’s power grid and laying new high voltage transmission lines, both of which will be key to driving solar and wind power capacity additions as wind power surges in the U.S. electricity mix nationwide.

The US was one of the worst hit countries in the world due to the Covid-19 pandemic in 2020. With respect to the power sector, the electricity consumption in the country declined by 2.5% in 2020 as compared to 2019, even as renewable electricity surpassed coal in 2022 in the generation mix, highlighting continued structural change. Power plants that were under construction faced delays due to unavailability of components due to supply chain disruptions and unavailability of labour due to travel restrictions.

According to the US Energy Information Administration, 61 power projects, having a total capacity of 2.4GWm which were under construction during March and April 2020 were delayed because of the Covid-19 pandemic. Among renewable power technologies, solar PV and wind power projects were the most badly affected due to the pandemic.

In March and April 2020, 53 solar PV projects, having a total capacity of 1.3GW, and wind power projects, having a total capacity of 1.2GW, were delayed due to the Covid-19 pandemic. Moreover, several states suspended renewable energy auctions due to the pandemic.

For instance, New York State Energy Research and Development Authority (NYSERDA) had issued a new offshore wind solicitation for 1GW and up to 2.5GW in April 2020, but this was suspended due to the Covid-19 pandemic. In July 2020, the authority relaunched the tender for 2.5GW of offshore wind capacity, with a submission deadline in October 2020.

To ease the financial burden on consumers during the pandemic, more than 1,000 utilities in the country announced disconnection moratoria and implemented flexible payment plans. Duke Energy, American Electric Power, Dominion Power and Southern California Edison were among the major utilities that voluntarily suspended disconnections.


Related News

View more

Sign Up for Electricity Forum’s Newsletter

Stay informed with our FREE Newsletter — get the latest news, breakthrough technologies, and expert insights, delivered straight to your inbox.

Electricity Today T&D Magazine Subscribe for FREE

Stay informed with the latest T&D policies and technologies.
  • Timely insights from industry experts
  • Practical solutions T&D engineers
  • Free access to every issue

Live Online & In-person Group Training

Advantages To Instructor-Led Training – Instructor-Led Course, Customized Training, Multiple Locations, Economical, CEU Credits, Course Discounts.

Request For Quotation

Whether you would prefer Live Online or In-Person instruction, our electrical training courses can be tailored to meet your company's specific requirements and delivered to your employees in one location or at various locations.