Public Utilities Commission headquarters set to go off grid and minimize carbon footprint

By PR Newswire


Protective Relay Training - Basic

Our customized live online or in‑person group training can be delivered to your staff at your location.

  • Live Online
  • 12 hours Instructor-led
  • Group Training Available
Regular Price:
$699
Coupon Price:
$599
Reserve Your Seat Today
KMD Architects' design for a new 12-story headquarters for the San Francisco Public Utilities Commission is expected to be a leader in demonstrating energy efficiency, water recycling and reduced carbon footprint among major office buildings nationally, according to PUC officials.

"What better organization than a major municipal power and water agency to create one of the most advanced buildings in green design in the U.S.," said David Hobstetter, KMD principal.

"Our intent from the beginning was to create the most energy-efficient office building developed in an urban setting in the United States to date," said PUC deputy general manager Anthony Irons. The $178 million, 254,000-square foot headquarters will include features uncommon in buildings today, but "would be commonplace in years to come," he said.

Officials say construction will be paid by selling surplus real estate holdings and by issuing bonds against future rent savings, not by funds from rate-paying customers.

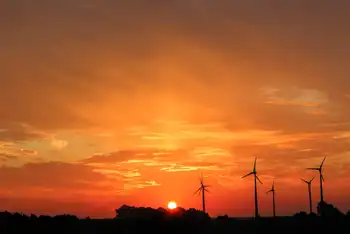
Dozens of wind turbines on the roof, solar panels embedded in outer walls, and a natural-cooling "thermal chimney" are among the features enabling the structure to supply 40 percent of its own energy needs, said Hobstetter. On windy, sunlit days, it will go off the power grid completely.

"The San Francisco PUC headquarters is the type of well-proportioned, elegant project that reveals the next wave of thinking by designers and planners in which the building is seen as a component of its natural setting. The possibilities for innovation are limitless; just think of a city that regenerates rather than depletes its natural resources," said Lisa Sullivan, Director of Publications, "Places: Forum of Design for the Public Realm", a journal sponsored by a consortium of design schools including U.C.-Berkeley, the Pratt Institute and M.I.T.

Planned to break ground at 525 Golden Gate Ave. near City Hall in 2008, the PUC headquarters also employs advanced water-saving and water-recycling. Faucet sensors, waterless urinals, and on-demand water heaters will cut use to 5 gallons per occupant per day, compared to average office-building use of 25 gallons a day. A grey-water wastewater recycling system enables reuse of water from faucets and sinks in the building's toilets and the cooling system.

While water and power efficiencies were the PUCÂ’s primary goals, the new headquarters will also employ leading-edge design concepts in enhancing human performance, said Hobstetter.

"Dozens of research studies have confirmed the benefits of natural daylight and views of greenspace in improving a person's productivity, reducing absenteeism and improving health and well-being," said Hobstetter.

"By utilizing sun-filtering shades, new window-glazing materials and other techniques, we were able to bring sunlight well inside the structure's interior work spaces."

"Energy efficiency is one thing, it can be accomplished with smart technology; it is easily measured," said Ryan Stevens Design Principal at KMD. "We want to go one step further and provide a work space that will contribute to preserving the environment, foster interaction, creativity and productivity and also inspire the community."

The building is designed to exceed LEEDs-Platinum, and will exceed California's recently instituted Title 24 requirements for energy efficiency in new office buildings by 60 percent, he concluded.

Related News

Yet another Irish electricity provider is increasing its prices

Electric Ireland Electricity Price Increase stems from rising wholesale costs as energy suppliers adjust tariffs. Customers face higher electricity bills, while gas remains unchanged; switching provider could deliver savings during winter.


Key Points

A 4% increase in Electric Ireland electricity prices from 1 Feb 2018, driven by wholesale costs; gas unchanged.

✅ 4% electricity rise effective 1 Feb 2018

✅ Increase attributed to rising wholesale energy costs

✅ Switching supplier may reduce bills and boost savings


ELECTRIC IRELAND has announced that it will increase its household electricity prices by 4% from 1 February 2018.

This comes just a week after both Bord Gáis Energy and SSE Airtricity announced increases in their gas and electricity prices, while national efforts to secure electricity supplies continue in parallel.

Electric Ireland has said that the electricity price increase is unavoidable due to the rising wholesale cost of electricity, with EU electricity prices trending higher as well.

The electricity provider said it has no plans to increase residential gas prices at the moment.

Commenting on the latest announcement, Eoin Clarke, managing director of Switcher.ie, said: “This is the third largest energy supplier to announce a price increase in the last week, so the other suppliers are probably not far behind.

“The fact that the rise is not coming into effect until 1 February will be welcomed by Electric Ireland customers who are worried about the rising cost of energy as winter sets in,” he said.

However, any increase is still bad news, especially as a quarter of consumers (27%) say their energy bill already puts them under financial pressure, and EU energy inflation has disproportionately affected lower-income households.

According to Electric Ireland, this will amount to a €2.91 per month increase for an average electricity customer, amounting to €35 per year.

Meanwhile, SSE Airtricity’s change amounts to an increase of 90 cent per week or €46.80 per year for someone with average consumption on their 24hr SmartSaver standard tariff, far below the dramatic Spain electricity price surge seen recently.

Bord Gáis Energy said its announcement will increase a typical gas bill by €2.12 a month and a typical electricity bill by €4.77 a month, reflecting wider trends such as the Germany power price spike reported recently.

In a statement, Bord Gáis Energy said: “The changes, which will take effect from 1st November 2017, are due to significant increases in the wholesale cost of energy as well as higher costs associated with distributing energy on the gas and electricity networks.

“In percentage terms, the increase represents 3.4% in a typical customer’s gas bill and an increase of 5.9% in a typical customer’s electricity bill.”

Clark said that if customers haven’t switched electricity provider in over a year that they should review the deals available at the moment.

“The market is highly competitive so there are huge savings to be made by switching,” he said.

“All suppliers use the same cables to supply electricity to your home, so you don’t need to worry about any loss in service, and you could save up to 324 by switching from typical standard tariffs to the cheapest deals on the market.”


Related News

View more

Here are 3 ways to find out where your electricity comes from

US energy mix shows how the electric grid blends renewables, fossil fuels, nuclear, and hydro, varying by ISO/RTO markets, utilities, and state policies, affecting carbon emissions, pricing, reliability, and access.


Key Points

The US energy mix is the grid's source breakdown by region: fossil fuels, renewables, nuclear, and hydro.

✅ Check ISO or RTO dashboards for real-time generation by fuel source.

✅ Utilities may offer green power plans or RECs at modest premiums.

✅ Energy mix shifts with policy, pricing, and grid reliability needs.


There are few resources more important than energy. Sure, you may die if you don't eat for days. But your phone will die if you go too long without charging it. Energy feeds tech, the internet, city infrastructure, refrigerators, lights, and has evolved throughout U.S. history in profound ways. You get the idea. Yet unlike our other common needs, such as food, energy sources aren't exactly front of mind for most people. 

"I think a lot of people don't put a lot of bandwidth into thinking about this part of their lives," said Richard McMahon, the SVP of energy supply and finance at Edison Electric Institute, a trade group that represents investor-owned electric companies in the US. 

It makes sense. For most Americans, electricity is always there, and in many locations, there's not much of a choice involved, even as electricity demand is flat across the U.S. today. You sign up with a utility when you move into a new residence and pay your bills when they're due. 

But there's an important reality that indifference eschews: In 2018, a third of the energy-related carbon-dioxide emissions in the US came from the electric power sector, according to the US Energy Information Administration (EIA). 

A good chunk of that is from the residential sector, which consistently uses more energy than commercial customers, per EIA data.

Just as many people exercise choice when they eat, you typically also have a choice when it comes to your energy supply. That's not to say your current offering isn't what you want, or that switching will be easy or affordable, but "if you're a customer and want power with a certain attribute," McMahon said, "you can pretty much get it wherever you are." 

But first, you need to know the energy mix you have right now. As it turns out, it's not so straightforward. At all.

This brief guide may help. 

For some utility providers, you can find out if it publishes the energy mix online. Dominion Energy, which serves Idaho, North Carolina, Ohio, South Carolina, Utah, Virginia, West Virginia, and Wyoming, provides this information in a colored graphic. 

"Once you figure out who your utility is you can figure out what mix of resources they use," said Heidi Ratz, an electricity markets researcher at the World Resources Institute.

But not all utilities publish this information.

It has to do with their role in the grid and reflects utility industry trends in structure and markets. Some utility companies are vertically integrated; they generate power through nuclear plants or wind farms and distribute those electrons directly to their customers. Other utilities just distribute the power that different companies produce. 

Consider Consolidated Edison, or Con Ed, which distributes energy to parts of New York City. While reporting this story, Business Insider could not find information about the utility's energy mix online. When reached for comment, a spokesperson said, "we're indifferent to where it comes from."

That's because, in New York, distribution utilities like Con Ed often buy energy through a wholesale marketplace.

Take a look at this map. If you live in one of the colored regions, your electricity is sold on a wholesale market regulated by an organization called a regional transmission organization (RTO) or independent system operator (ISO). Distribution utilities like Con Ed often buy their energy through these markets, based on availability and cost, while raising questions about future utility revenue models as prices shift. 

Still, it's pretty easy to figure out where your energy comes from. Just look up the ISO or RTO website (such as NYISO or CAISO). Usually, these organizations will provide energy supply information in near-real time. 

That's exactly what Con Edison (which buys energy on the NYISO marketplace) suggested. As of Friday morning, roughly 40% of the energy on the market place was natural gas or other fossil fuels, 34% was nuclear, and about 22% was hydro. 

If you live in another region governed by an ISO or RTO, such as in most of California, you can do the same thing. Like NYISO, CAISO has a dashboard that shows (again, as of Friday morning) about 36% of the energy on the market comes from natural gas and more than 20% comes from renewables. 

In the map linked above, you'll notice that some of the ISOs and RTOs like MISO encompass enormous regions. That means that even if you figure out where the energy in your market comes from, it's not going to be geographically specific. But there are a couple of ways to drill down even further. 

The Environmental Protection Agency has a straightforward tool called Power Profiler. You can enter your zip code to see the fuel mix in your area. But it's not perfect. The data are from 2016 and, in some regions of the country like the upper Midwest, they aren't much more localized, and some import dirty electricity due to regional trading. 

The World Resources Institute also has a tool that allows you to see the electricity mix by state, based on 2017 data from EIA. These numbers represent power generation, not the electricity actually flowing into your sockets, but they offer a rough idea of what energy resources are operating in your state. 

One option is to check with your utility to see if it has a "green power" offering. Over 600 utilities across the country have one, according to the Climate Reality Project, though they often come at a slightly higher cost. It's typically on the scale of just a few more cents per kilowatt-hour. 

There are also independent, consumer-facing companies like Arcadia and Green Mountain Energy that allow you to source renewable energy, by virtually connecting you to community solar projects or purchasing Renewable Energy Certificates, or RECs, on your behalf, as America goes electric and more options emerge. 

"RECs measure an investment in a clean energy resource," Ratz said, in an email. "The goal of putting that resource on the grid is to push out the need for dirtier resources."

The good news: Even if you do nothing, your energy mix will get cleaner. Coal production has fallen to lows not seen since the 1980s, amid disruptions in coal and nuclear sectors that affect reliability and costs, while renewable electricity generation has doubled since 2008. So whether you like it or not, you'll be roped into the clean energy boom one way or another. 


Related News

View more

US Dept. of Energy awards Washington state $23.4 million to strengthen infrastructure

Washington Grid Resilience Grant funds DOE-backed modernization to harden Washington's electric grid against extreme weather, advancing clean energy, affordable and reliable electricity, and community resilience under the Bipartisan Infrastructure Law via projects and utility partnerships.


Key Points

A $23.4M DOE grant to modernize Washington's grid, boost weather resilience, and deliver clean, reliable power.

✅ Targets outages, reliability, and community resilience statewide.

✅ Prioritizes disadvantaged areas and quality clean energy jobs.

✅ Backed by Bipartisan Infrastructure Law and DOE funding.


Washington state has received a $23.4 million Grid Resilience State and Tribal Formula Grant from the U.S. Department of Energy (DOE) to modernize the electric grid through smarter electricity infrastructure and reduce impacts due to extreme weather and natural disasters. Grid Resilience State and Tribal Formula Grants aim to ensure the reliability of power sector infrastructure so that communities have access to affordable, reliable, clean electricity.

“Electricity is an essential lifeline for communities. Improving our systems by reducing disruptive events is key as we cross the finish line of a 100% clean electricity grid and ensure equitable benefits from the clean energy economy reach every community,” said Gov. Jay Inslee.

The federal funding for energy resilience will enhance and expand ongoing current grid modernization and resilience efforts throughout the state. For example, working directly with rural and typical end-of-the-line customers to develop resilience plans and collaborating with communities and utilities, including smart city efforts in Spokane as examples, on building resilient and renewable infrastructure for essential services.

“This is a significant opportunity to supplement our state investments in building a robust, resilient electric grid that supports our long-term vision for clean, affordable and reliable electricity – the foundation for economic growth and job creation that strengthens our communities and keeps Washington globally competitive. It shows once again that we are maximizing the federal funding being made available by the Biden-Harris Administration to invest in the country’s infrastructure,” said Washington State Department of Commerce Director Mike Fong.

Across the border, British Columbia's clean energy shift adds regional momentum for resilient, low-carbon power.

Goals include:

Reducing the frequency, duration and impact of outages as climate change impacts on the grid intensify while enhancing resiliency in historically disadvantaged communities.
Strengthening prosperity by expanding well-paying, safe clean energy jobs accessible to all workers and ensuring investments have a positive effect on quality job creation and equitable economic development.

Building a community of practice and maximizing project scalability by identifying pathways for scaling innovations such as integrating solar into the grid across programs.

“The Grid Resilience Formula Grants will enable communities in Washington to protect households and businesses from blackouts or power shutdowns during extreme weather,” said Maria Robinson, Director, Grid Deployment Office, U.S. Department of Energy. “Projects selected through this program will benefit communities by creating good-paying jobs to deliver clean, affordable, and reliable energy across the country.”

DOE has also announced $34 million for grid improvements to bolster reliability nationwide.

“An innovative, reliable, and efficient power grid is vital to Washington’s continued economic growth and for community resilience especially in disadvantaged areas,” said U.S. Rep. Strickland, Co-Lead of the bipartisan Grid Innovation Caucus. “The funding announced today will invest in our energy grid, support good-paying jobs, and means a cleaner, more energy-efficient future.”

Funded through the Bipartisan Infrastructure Law and administered by DOE’s Grid Deployment Office, with related efforts such as California grid upgrades advancing nationwide, the Grid Resilience State and Tribal Formula Grants distribute funding to states, territories, and federally recognized Indian Tribes, over five years based on a formula that includes factors such as population size, land area, probability and severity of disruptive events, and a locality’s historical expenditures on mitigation efforts. Priority will be given to projects that generate the greatest community benefit providing clean, affordable, and reliable energy.


Related News

View more

More red ink at Manitoba Hydro as need for new power generation looms

Manitoba NDP Energy Financing Strategy outlines public ownership of renewables, halts private wind farms, stabilizes hydroelectric rates, and addresses Manitoba Hydro deficits amid drought, export revenue declines, and rising demand for grid reliability.


Key Points

A plan to fund public renewables, pause private wind, and stabilize Manitoba Hydro rates, improving utility finances.

✅ Public ownership favored over private wind contracts

✅ Focus on rate freeze and Manitoba Hydro debt management

✅ Addresses drought impacts, export revenue declines, rising demand


Manitoba's NDP administration has declared its intention to formulate a strategy for financing new energy ventures, following a decision to halt the development of additional private-sector wind farms and to extend a pause on new cryptocurrency connections amid grid pressures. This plan will accompany efforts to stabilize hydroelectric rates and manage the financial obligations of the province's state-operated energy company.

Finance Minister Adrien Sala, overseeing Manitoba Hydro, shared these insights during a legislative committee meeting on Thursday, emphasizing the government's desire for future energy expansions to remain under public ownership, even as Ontario moves to reintroduce renewable energy projects after prior cancellations, and expressing trust in Manitoba Hydro's governance to realize these goals.

This announcement was concurrent with Manitoba Hydro unveiling increased financial losses in its latest quarterly report. The utility anticipates a $190-million deficit for the fiscal year ending in March, marking a $29 million increase from its previous forecast and a significant deviation from an initial $450 million profit expectation announced last spring. Contributing factors to this financial downturn include reduced hydroelectric power generation due to drought conditions, diminished export revenues, and a mild fall season impacting heating demand.

The recent financial update aligns with a period of significant changes at Manitoba Hydro, initiated by the NDP government's board overhaul following its victory over the former Progressive Conservative administration in the October 3 election, and comes as wind projects are scrapped in Alberta across the broader Canadian energy landscape.

Subsequently, the NDP-aligned board discharged CEO Jay Grewal, who had advocated for integrating wind energy from third-party sources, citing competitive wind power trends, to promptly address the province's escalating energy requirements. Grewal's approach, though not unprecedented, sought to offer a quicker, more cost-efficient alternative to constructing new Manitoba Hydro dams, highlighting an imminent energy production shortfall projected for as early as 2029.

The opposition Progressive Conservatives have criticized the NDP for dismissing the wind power initiative without presenting an alternate solution, warning about costly cancellation fees seen in Ontario when projects are halted, and emphasizing the urgency of addressing the predicted energy gap.

In response, Sala reassured that the government is in the early stages of policy formulation, reflecting broader electricity policy debates in Ontario about how to fix the power system, and criticized the previous administration for its inaction on enhancing generation capacity during its tenure.

Manitoba Hydro has named Hal Turner as the acting CEO while it searches for Grewal's successor, following controversies such as Solar Energy Program mismanagement raised by a private developer. Turner informed the committee that the utility is still deliberating on its approach to new energy production and is exploring ways to curb rising demand.

Expressing optimism about collaborating with the new board, Turner is confident in finding a viable strategy to fulfill Manitoba's energy needs in a safe and affordable manner.

Additionally, the NDP's campaign pledge to freeze consumer rates for a year remains a priority, with Sala committing to implement this freeze before the next provincial election slated for 2027.


Related News

View more

UK low-carbon electricity generation stalls in 2019

UK low-carbon electricity 2019 saw stalled growth as renewables rose slightly, wind expanded, nuclear output fell, coal hit record lows, and net-zero targets demand faster deployment to cut CO2 intensity below 100gCO2/kWh.


Key Points

Low-carbon sources supplied 54% of UK power in 2019, up just 1TWh; wind grew, nuclear fell, and coal dropped to 2%.

✅ Wind up 8TWh; nuclear down 9TWh amid outages

✅ Fossil fuels 43% of generation; coal at 2%

✅ Net-zero needs 15TWh per year added to 2030


The amount of electricity generated by low-carbon sources in the UK stalled in 2019, Carbon Brief analysis shows.

Low-carbon electricity output from wind, solar, nuclear, hydro and biomass rose by just 1 terawatt hour (TWh, less than 1%) in 2019. It represents the smallest annual increase in a decade, where annual growth averaged 9TWh. This growth will need to double in the 2020s to meet UK climate targets while replacing old nuclear plants as they retire.

Some 54% of UK electricity generation in 2019 came from low-carbon sources, including 37% from renewables and 20% from wind alone, underscoring wind's leading role in the power mix during key periods. A record-low 43% was from fossil fuels, with 41% from gas and just 2% from coal, also a record low. In 2010, fossil fuels generated 75% of the total.

Carbon Brief’s analysis of UK electricity generation in 2019 is based on figures from BM Reports and the Department for Business, Energy and Industrial Strategy (BEIS). See the methodology at the end for more on how the analysis was conducted.

The numbers differ from those published earlier in January by National Grid, which were for electricity supplied in Great Britain only (England, Wales and Scotland, but excluding Northern Ireland), including via imports from other countries.

Low-carbon low
In 2019, the UK became the first major economy to target net-zero greenhouse gas emissions by 2050, increasing the ambition of its legally binding Climate Change Act.

To date, the country has cut its emissions by around two-fifths since 1990, with almost all of its recent progress coming from the electricity sector.

Emissions from electricity generation have fallen rapidly in the decade since 2010 as coal power has been almost phased out and even gas output has declined. Fossil fuels have been displaced by falling demand and by renewables, such as wind, solar and biomass.

But Carbon Brief’s annual analysis of UK electricity generation shows progress stalled in 2019, with the output from low-carbon sources barely increasing compared to a year earlier.

The chart below shows low-carbon generation in each year since 2010 (grey bars) and the estimated level in 2019 (red). The pale grey bars show the estimated future output of existing low-carbon sources after old nuclear plants retire and the pale red bars show the amount of new generation needed to keep electricity sector emissions to less than 100 grammes of CO2 per kilowatt hour (gCO2/kWh), the UK’s nominal target for the sector.

 Annual electricity generation in the UK by fuel, terawatt hours, 2010-2019. Top panel: fuel by fuel. Bottom panel: cumulative total generation from all sources. Source: BEIS energy trends, BM Reports and Carbon Brief analysis. Chart by Carbon Brief using Highcharts.
As the chart shows, the UK will require significantly more low-carbon electricity over the next decade as part of meeting its legally binding climate goals.

The nominal 100gCO2/kWh target for 2030 was set in the context of the UK’s less ambitious goal of cutting emissions to 80% below 1990 levels by 2050. Now that the country is aiming to cut emissions to net-zero by 2050, that 100gCO2/kWh indicator is likely to be the bare minimum.

Even so, it would require a rapid step up in the pace of low-carbon expansion, compared to the increases seen over the past decade. On average, low-carbon generation has risen by 9TWh each year in the decade since 2010 – including a rise of just 1TWh in 2019.

Given scheduled nuclear retirements and rising demand expected by the Committee on Climate Change (CCC) – with some electrification of transport and heating – low-carbon generation would need to increase by 15TWh each year until 2030, just to meet the benchmark of 100gCO2/kWh.

For context, the 3.2 gigawatt (GW) Hinkley C new nuclear plant being built in Somerset will generate around 25TWh once completed around 2026. The world’s largest offshore windfarm, the 1.2GW Hornsea One scheme off the Yorkshire coast, will generate around 5TWh each year.

The new Conservative government is targeting 40GW of offshore wind by 2030, up from today’s figure of around 8GW. If policies are put in place to meet this goal, then it could keep power sector emissions below 100gCO2/kWh, depending on the actual performance of the windfarms built.

However, new onshore wind and solar, further new nuclear or other low-carbon generation, such as gas with carbon capture and storage (CCS), is likely to be needed if demand is higher than expected, or if the 100gCO2/kWh benchmark is too weak in the context of net-zero by 2050.

The CCC says it is “likely” to “reflect the need for more rapid deployment” of low-carbon towards net-zero emissions in its advice on the sixth UK carbon budget for 2033-2037, due in September.

Trading places
Looking more closely at UK electricity generation in 2019, Carbon Brief’s analysis shows why there was so little growth for low-carbon sources compared to the previous year.

There was another increase for wind power in 2019 (up 8TWh, 14%), with record wind generation as several large new windfarms were completed including the 1.2GW Hornsea One project in October and the 0.6GW Beatrice offshore windfarm in Q2 of 2019. But this was offset by a decline for nuclear (down 9TWh, 14%), due to ongoing outages for reactors at Hunterston in Scotland and Dungeness in Kent.

(Analysis of data held by trade organisation RenewableUK suggests some 0.6GW of onshore wind capacity also started operating in 2019, including the 0.2GW Dorenell scheme in Moray, Scotland.)

As a result of these movements, the UK’s windfarms overtook nuclear for the first time ever in 2019, becoming the country’s second-largest source of electricity generation, and earlier, wind and solar together surpassed nuclear in the UK as momentum built. This is shown in the figure below, with wind (green line, top panel) trading places with nuclear (purple) and gas (dark blue) down around 25% since 2010 but remaining the single-largest source.

 Annual electricity generation in the UK by fuel, terawatt hours, 2010-2019. Top panel: fuel by fuel. Bottom panel: cumulative total generation from all sources. Source: BEIS energy trends, BM Reports and Carbon Brief analysis. Chart by Carbon Brief using Highcharts.
The UK’s currently suspended nuclear plants are due to return to service in January and March, according to operator EDF, the French state-backed utility firm. However, as noted above, most of the UK’s nuclear fleet is set to retire during the 2020s, with only Sizewell B in Suffolk due to still be operating by 2030. Hunterston is scheduled to retire by 2023 and Dungeness by 2028.

Set against these losses, the UK has a pipeline of offshore windfarms, secured via “contracts for difference” with the government, at a series of auctions. The most recent auction, in September 2019, saw prices below £40 per megawatt hour – similar to current wholesale electricity prices.

However, the capacity contracted so far is not sufficient to meet the government’s target of 40GW by 2030, meaning further auctions – or some other policy mechanism – will be required.

Coal zero
As well as the switch between wind and nuclear, 2019 also saw coal fall below solar for the first time across a full year, echoing the 2016 moment when wind outgenerated coal across the UK, after it suffered another 60% reduction in electricity output. Just six coal plants remain in the UK, with Aberthaw B in Wales and Fiddlers Ferry in Cheshire closing in March.

Coal accounted for just 2% of UK generation in 2019, a record-low coal share since centralised electricity supplies started to operate in 1882. The fuel met 40% of UK needs as recently as 2012, but has plummeted thanks to falling demand, rising renewables, cheaper gas and higher CO2 prices.

The reduction in average coal generation hides the fact that the fuel is now often not required at all to meet the UK’s electricity needs. The chart below shows the number of days each year when coal output was zero in 2019 (red line) and the two previous years (blue).

 Cumulative number of days when UK electricity generation from renewable sources has been higher than that from fossil fuels. Source: BEIS energy trends, BM Reports and Carbon Brief analysis. Chart by Carbon Brief using Highcharts.
The 83 days in 2019 with zero coal generation amount to nearly a quarter of the year and include the record-breaking 18-day stretch without the fuel.

Great Britain has been running for a record TWO WEEKS without using coal to generate electricity – the first time this has happened since 1882.

The country’s grid has been coal-free for 45% of hours in 2019 so far.https://www.carbonbrief.org/countdown-to-2025-tracking-the-uk-coal-phase-out …

Coal generation was set for significant reductions around the world in 2019 – including a 20% reduction for the EU as a whole – according to analysis published by Carbon Brief in November.

Notably, overall UK electricity generation fell by another 9TWh in 2019 (3%), bringing the total decline to 58TWh since 2010. This is equivalent to more than twice the output from the Hinkley C scheme being built in Somerset. As Carbon Brief explained last year, falling demand has had a similar impact on electricity-sector CO2 emissions as the increase in output from renewables.

This is illustrated by the fact that the 9TWh reduction in overall generation translated into a 9TWh (6%) cut in fossil-fuel generation during 2019, with coal falling by 10TWh and gas rising marginally.

Increasingly renewable
As fossil-fuel output and overall generation have declined, the UK’s renewable sources of electricity have continued to increase. Their output has risen nearly five-fold in the past decade and their share of the UK total has increased from 7% in 2010 to 37% in 2019.

As a result, the UK’s increasingly renewable grid is seeing more minutes, hours and days during which the likes of wind, solar and biomass collectively outpace all fossil fuels put together, and on some days wind is the main source as well.

The chart below shows the number of days during each year when renewables generated more electricity than fossil fuels in 2019 (red line) and each of the previous four years (blue lines). In total, nearly two-fifths of days in 2019 crossed this threshold.

 Cumulative number of days when the UK has not generated any electricity from coal. Source: BEIS energy trends, BM Reports and Carbon Brief analysis. Chart by Carbon Brief using Highcharts.
There were also four months in 2019 when renewables generated more of the UK’s electricity than fossil fuels: March, August, September and December. The first ever such month came in September 2018 and more are certain to follow.

National Grid, which manages Great Britain’s high-voltage electricity transmission network, is aiming to be able to run the system without fossil fuels by 2025, at least for short periods. At present, it sometimes has to ask windfarm operators to switch off and gas plants to start running in order to keep the electricity grid stable.

Note that biomass accounted for 11% of UK electricity generation in 2019, nearly a third of the total from all renewables. Some two-thirds of the biomass output is from “plant biomass”, primarily wood pellets burnt at Lynemouth in Northumberland and the Drax plant in Yorkshire. The remainder was from an array of smaller sites based on landfill gas, sewage gas or anaerobic digestion.

The CCC says the UK should “move away” from large-scale biomass power plants, once existing subsidy contracts for Drax and Lynemouth expire in 2027.

Using biomass to generate electricity is not zero-carbon and in some circumstances could lead to higher emissions than from fossil fuels. Moreover, there are more valuable uses for the world’s limited supply of biomass feedstock, the CCC says, including carbon sequestration and hard-to-abate sectors with few alternatives.

Methodology
The figures in the article are from Carbon Brief analysis of data from BEIS Energy Trends chapter 5 and chapter 6, as well as from BM Reports. The figures from BM Reports are for electricity supplied to the grid in Great Britain only and are adjusted to include Northern Ireland.

In Carbon Brief’s analysis, the BM Reports numbers are also adjusted to account for electricity used by power plants on site and for generation by plants not connected to the high-voltage national grid. This includes many onshore windfarms, as well as industrial gas combined heat and power plants and those burning landfill gas, waste or sewage gas.

By design, the Carbon Brief analysis is intended to align as closely as possible to the official government figures on electricity generated in the UK, reported in BEIS Energy Trends table 5.1.

Briefly, the raw data for each fuel is in most cases adjusted with a multiplier, derived from the ratio between the reported BEIS numbers and unadjusted figures for previous quarters.

Carbon Brief’s method of analysis has been verified against published BEIS figures using “hindcasting”. This shows the estimates for total electricity generation from fossil fuels or renewables to have been within ±3% of the BEIS number in each quarter since Q4 2017. (Data before then is not sufficient to carry out the Carbon Brief analysis.)

For example, in the second quarter of 2019, a Carbon Brief hindcast estimates gas generation at 33.1TWh, whereas the published BEIS figure was 34.0TWh. Similarly, it produces an estimate of 27.4TWh for renewables, against a BEIS figure of 27.1TWh.

National Grid recently shared its own analysis for electricity in Great Britain during 2019 via its energy dashboard, which differs from Carbon Brief’s figures.


Related News

View more

Alberta's Path to Clean Electricity

Alberta Clean Electricity Regulations face federal mandates and provincial autonomy, balancing greenhouse gas cuts, net-zero 2050 goals, and renewable energy adoption across wind, solar, and hydro, while protecting jobs and economic stability in energy communities.


Key Points

Rules to cut power emissions, boost renewables, and align Alberta with federal net-zero goals under federal mandates.

✅ Phases out coal and curbs greenhouse gas emissions

✅ Expands wind, solar, and hydro to diversify the grid

✅ Balances provincial autonomy with national climate targets


In a recent development, Alberta finds itself at a crossroads between provincial autonomy and federal mandates concerning federal clean electricity regulations that shape long-term planning. The province, known for its significant oil and gas industry, faces increasing pressure to align its energy policies with federal climate goals set by Ottawa.

The federal government, under the leadership of Environment Minister Steven Guilbeault, has proposed regulations aimed at reducing greenhouse gas emissions and transitioning towards a cleaner energy future that prioritizes clean grids and batteries across provinces. These regulations are part of Canada's broader commitment to combat climate change and achieve net-zero emissions by 2050.

The Federal Perspective

From Ottawa's standpoint, stringent regulations on Alberta's electricity sector are necessary to meet national climate targets. This includes measures to phase out coal-fired power plants and increase reliance on renewable energy sources such as wind, solar, and hydroelectric power. Minister Guilbeault emphasizes the importance of these regulations in mitigating Canada's carbon footprint and fostering sustainable development.

Alberta's Response

In contrast, Alberta has historically championed provincial autonomy in energy policy, leveraging its vast fossil fuel resources to drive economic growth. The province remains cautious about federal interventions that could potentially disrupt its energy sector, a cornerstone of its economy, especially amid changes to how electricity is produced and paid for now under discussion.

Premier Jason Kenney has expressed concerns over federal overreach, and his influence over electricity policy has shaped proposals in the legislature. He emphasizes the province's efforts in adopting cleaner technologies while balancing economic stability and environmental sustainability.

The Balancing Act

The challenge lies in finding a middle ground between federal imperatives and provincial priorities, as interprovincial disputes like B.C.'s export-restriction challenge complicate coordination. Alberta acknowledges the need to diversify its energy portfolio and reduce emissions but insists on preserving its jurisdiction over energy policy. The province has already made strides in renewable energy development, including investing in wind and solar projects alongside traditional energy sources.

Economic Implications

For Alberta, the transition to cleaner electricity carries significant economic implications as the electricity market heads for a reshuffle in the coming years. It entails navigating the complexities of energy transition, ensuring job retention, and fostering innovation in sustainable technologies. Critics argue that abrupt federal regulations could exacerbate economic hardships, particularly in communities reliant on the fossil fuel industry.

Moving Forward

As discussions continue between Alberta and Ottawa, finding common ground, including consideration of recent market change proposals from the province, remains essential. Collaborative efforts are necessary to develop tailored solutions that accommodate both environmental responsibilities and economic realities. This includes exploring incentives for renewable energy investment, supporting energy sector workers in transitioning to new industries, and leveraging Alberta's expertise in energy innovation.

Conclusion

Alberta's journey towards clean electricity regulation exemplifies the delicate balance between regional autonomy and federal oversight in Canada's complex federal system. While tensions persist between provincial and federal priorities, both levels of government share a common commitment to addressing climate change and advancing sustainable energy solutions.

The outcome of these negotiations will not only shape Alberta's energy landscape but also influence Canada's overall progress towards a greener future. Finding equitable solutions that respect provincial autonomy while achieving national environmental goals remains paramount in navigating this evolving policy landscape.


Related News

View more

Sign Up for Electricity Forum’s Newsletter

Stay informed with our FREE Newsletter — get the latest news, breakthrough technologies, and expert insights, delivered straight to your inbox.

Electricity Today T&D Magazine Subscribe for FREE

Stay informed with the latest T&D policies and technologies.
  • Timely insights from industry experts
  • Practical solutions T&D engineers
  • Free access to every issue

Download the 2025 Electrical Training Catalog

Explore 50+ live, expert-led electrical training courses –

  • Interactive
  • Flexible
  • CEU-cerified