Canada 100% Renewable Power by 2035 envisions a decentralized grid built on wind, solar, energy storage, and efficiency, delivering zero-emission, resilient, low-cost electricity while phasing out nuclear and gas to meet net-zero targets.
Key Points
Zero-emission, decentralized grid using wind, solar, and storage, plus efficiency, to retire fossil and nuclear by 2035.
✅ Scale wind and solar 18x with storage for reliability.
✅ Phase out nuclear and gas; no CCS or offsets needed.
✅ Modernize grids and codes; boost efficiency, jobs, and affordability.
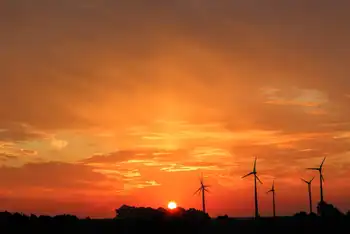
A powerful derecho that left nearly a million people without power in Ontario and Quebec on May 21 was a reminder of the critical importance of electricity in our daily lives.
Canada’s electrical infrastructure could be more resilient to such events, while being carbon-emission free and provide low-cost electricity with a decentralized grid powered by 100 per cent renewable energy, according to a new study from the David Suzuki Foundation (DSF), a vision of an electric, connected and clean future if the country chooses.
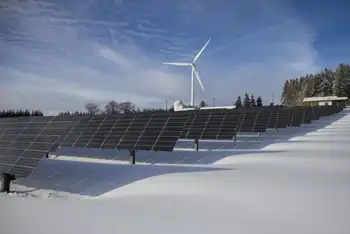
This could be accomplished by 2035 by building a lot more solar and wind, despite indications that demand for solar electricity has lagged in Canada, adding energy storage, while increasing the energy efficiency in buildings, and modernizing provincial energy grids. As this happens, nuclear energy and gas power would be phased out. There would also be no need for carbon capture and storage nor carbon offsets, the modeling study concluded.
“Solar and wind are the cheapest sources of electricity generation in history,” said study co-author Stephen Thomas, a mechanical engineer and climate solutions policy analyst at the DSF.
“There are no technical barriers to reaching 100 per cent zero-emission electricity by 2035 nationwide,” Thomas told The Weather Network (TWN). However, there are considerable institutional and political barriers to be overcome, he said.
Other countries face similar barriers and many have found ways to reduce their emissions; for example, the U.S. grid's slow path to 100% renewables illustrates these challenges. There are enormous benefits including improved air quality and health, up to 75,000 new jobs annually, and lower electricity costs. Carbon emissions would be reduced by 200 million tons a year by 2050, just over one quarter of the reductions needed for Canada to meet its overall net zero target, the study stated.
Building a net-zero carbon electricity system by 2035 is a key part of Canada’s 2030 Emissions Reduction Plan. Currently over 80 per cent of the nation’s electricity comes from non-carbon sources including a 15 per cent contribution from nuclear, with solar capacity nearing a 5 GW milestone nationally. How the final 20 per cent will be emission-free is currently under discussion.
The Shifting Power study envisions an 18-fold increase in wind and solar energy, with the Prairie provinces expected to lead growth, along with a big increase in Canada’s electrical generation capacity to bridge the 20 per cent gap as well as replacing existing nuclear power.
The report does not see a future role for nuclear power due to the high costs of refurbishing existing plants, including the challenges with disposal of radioactive wastes and decommissioning plants at their end of life. As for the oft-proposed small modular nuclear reactors, their costs will likely “be much more costly than renewables,” according to the report.
There are no technical barriers to building a bigger, cleaner, and smarter electricity system, agrees Caroline Lee, co-author of the Canadian Climate Institute’s study on net-zero electricity, “The Big Switch” released in May. However, as Lee previously told TWN, there are substantial institutional and political barriers.
In many respects, the Shifting Power study is similar to Lee’s study except it phases out nuclear power, forecasts a reduction in hydro power generation, and does not require any carbon capture and storage, she told TWN. Those are replaced with a lot more wind generation and more storage capacity.
“There are strengths and weaknesses to both approaches. We can do either but need a wide debate on what kind of electricity system we want,” Lee said.
That debate has to happen immediately because there is an enormous amount of work to do. When it comes to energy infrastructure, nearly everything “we put in the ground has to be wind, solar, or storage” to meet the 2035 deadline, she said.
There is no path to net zero by 2050 without a zero-emissions electricity system well before that date. Here are some of the necessary steps the report provided:
Create a range of skills training programs for renewable energy construction and installation as well as building retrofits.
Prioritize energy efficiency and conservation across all sectors through regulations such as building codes.
Ensure communities and individuals are fully informed and can decide if they wish to benefit from hosting energy generation infrastructure.
Create a national energy poverty strategy to ensure affordable access.
Strong and clear federal and provincial rules for utilities that mandate zero-emission electricity by 2035.
For Indigenous communities, make sure ownership opportunities are available along with decision-making power.
Canada should move as fast as possible to 100 per cent renewable energy to gain the benefits of lower energy costs, less pollution, and reduced carbon emissions, says Stanford University engineer and energy expert Mark Jacobson.
“Canada has so many clean, renewable energy resources that it is one of the easier countries [that can] transition away from fossil fuels,” Jacobson told TWN.
For the past decade, Jacobson has been producing studies and technical reports on 100 per cent renewable energy, including a new one for Canada, even as Canada is often seen as a solar power laggard today. The Stanford report, A Solution to Global Warming, Air Pollution, and Energy Insecurity for Canada, says a 100 per cent transition by 2035 timeline is ideal. Where it differs from DSF’s Shifting Power report is that it envisions offshore wind and rooftop solar panels which the latter did not.
“Our report is very conservative. Much more is possible,” agrees Thomas.
“We’re lagging behind. Canadians really want to get going on building solutions and getting the benefits of a zero emissions electricity system.”
Related News