Mayor seeks energy efficiency expert

By Associated Press


Protective Relay Training - Basic

Our customized live online or in‑person group training can be delivered to your staff at your location.

  • Live Online
  • 12 hours Instructor-led
  • Group Training Available
Regular Price:
$699
Coupon Price:
$599
Reserve Your Seat Today
Mayor Luke Ravenstahl has created a new trust fund he hopes will help make Pittsburgh more environmentally friendly and energy efficient.

The mayor gave the Green Initiative Trust Fund $100,000. That's about half of what the city has saved by combining its energy purchases with Allegheny County.

Ravenstahl says a coordinator will be hired for $45,000 annually to help implement the Green Government Task Force's plan to cut pollution in the city by 20 percent.

Environmental officials say they hope the trust fund will get matching state, federal and foundation grants.

They say making some of the city's old buildings energy efficient could cost millions of dollars.

Related News

A resilient Germany is weathering the energy crunch

German Energy Price Brakes harness price signals in a market-based policy, cutting gas consumption, preserving industrial output, and supporting CO2 reduction, showcasing Germany's resilience and adaptation while protecting households and businesses across Europe.


Key Points

Fixed-amount subsidies preserving price signals to curb gas use, shield consumers, and sustain industrial output.

✅ Maintains incentives via market-based price signals

✅ Cuts gas consumption without distorting EU markets

✅ Protects households and industry while curbing CO2


German industry and society are once again proving much more resilient and adaptable than certain people feared. Horror scenarios of a dangerous energy rationing or a massive slump in our economy have often been bandied about. But we are nowhere near that. With a challenging year just behind us, this is good news — not only for Germany, but also for Europe, where France-Germany energy cooperation has strengthened solidarity.

Companies and households reacted swiftly to the sharp increases in energy prices, in line with momentum in the global energy transition seen across markets. They installed more efficient heating or production facilities, switched to alternatives and imported intermediate products. The results are encouraging: German households and businesses have reduced gas consumption significantly, despite recent cold weather. From the start of the war in Ukraine to mid-December industrial gas consumption in Germany was (temperature-adjusted) around 20 per cent lower than the average level for the preceding three years. Even if some firms have cut back production, especially in energy-intensive sectors, industrial output as a whole has only fallen by about 1 per cent since the start of 2022. Added to this, in a survey released by the Ifo institute in November, over a third of German companies saw the potential to reduce gas consumption further without endangering output.

Instead of imposing excessive laws and regulations, we have relied on price signals and the prudence of market participants to create the right incentives and reduce gas consumption, as falling costs like record-low solar power prices continue to reinforce those signals across sectors.

We will follow this approach in coming months, when energy savings will remain important, even as the EU electricity outlook anticipates sharply higher demand by 2050. Our latest relief measures will not distort price signals. To this end, the Bundestag approved gas and electricity price brakes in its final session in 2022. They are designed to function without any intervention in markets or prices. This system will pay out a fixed amount relative to previous years’ consumption and the current difference to a reference price — regardless of current consumption.

Energy price brakes are the main component of Germany’s “protective shield”, which makes up to €200bn available for measures in 2022 to 2024. Seen in relation to the German economy’s size, its past heavy reliance on Russian energy imports and the fact that the measures will expire in 2024, these are balanced and expedient mechanisms. In contrast to instruments used in other countries, our new arrangements will not affect the price formation process driven by supply and demand, or on incentives to save gas. Companies and households will continue to save the full market price when they reduce consumption by a unit of gas or electricity. In this way, the price brakes also avoid the creation of additional demand for gas at the expense of consumers in other European countries, even as Europe’s Big Oil turning electric signals broader structural shifts in energy markets. No one need fear that competition will be distorted or that gas will be bought up. Indeed, a recent IMF working paper on cushioning the impact of high energy prices on households explicitly praises the German energy price brakes.

Current developments confirm the effectiveness of a market-based approach — and show that we should also rely on price signals when it comes to reducing CO₂ emissions, as suggested by IEA CO2 trends in recent years. Last year, households and companies had only a few weeks to adapt, yet we have already seen a strong response. The effect of CO₂ prices can be even stronger, as adaptation is possible over a much longer time and they additionally affect expectations and long-term decisions. Regulatory interventions and subsidy schemes, even if well targeted, cannot compete with market co-ordination and incentives that support individual decision-making and promote innovation.

Europe and Germany can weather this crisis without a collapse in industrial production. We also have an opportunity to deal efficiently with the move to climate neutrality, aligned with Germany’s hydrogen strategy for imported low-carbon fuels. In both cases, we should have confidence in price signals as well as in the power of people and business to innovate and adapt.


Related News

View more

BloombergNEF: World offshore wind costs 'drop 32% per cent'

Global Renewable LCOE Trends reveal offshore wind costs down 32%, with 10MW turbines, lower CAPEX and OPEX, and parity for solar PV and onshore wind in Europe, China, and California, per BloombergNEF analysis.


Key Points

Benchmarks showing falling LCOE for offshore wind, onshore wind, and solar PV, driven by larger turbines and lower CAPEX

✅ Offshore wind LCOE $78/MWh; $53-64/MWh in DK/NL excl. transmission

✅ Onshore wind $47/MWh; solar PV $51/MWh, best $26-36/MWh

✅ Cost drivers: 10MW turbines, lower CAPEX/OPEX, weak China demand


World offshore wind costs have fallen 32% from just a year ago and 12% compared with the first half of 2019, according to a BNEF long-term outlook from BloombergNEF.

In its latest Levelized Cost of Electricity (LCOE) Update, BloombergNEF said its current global benchmark LCOE estimate for offshore wind is $78 a megawatt-hour.

“New offshore wind projects throughout Europe, including the UK's build-out, now deploy turbines with power ratings up to 10MW, unlocking CAPEX and OPEX savings,” BloombergNEF said.

In Denmark and the Netherlands, it expects the most recent projects financed to achieve $53-64/MWh excluding transmission.

New solar and onshore wind projects have reached parity with average wholesale power prices in California and parts of Europe, while in China levelised costs are below the benchmark average regulated coal price, according to BloombergNEF.

The company's global benchmark levelized cost figures for onshore wind and PV projects financed in the last six months are at $47 and $51 a megawatt-hours, underscoring that renewables are now the cheapest new electricity option in many regions, down 6% and 11% respectively compared with the first half of 2019.

BloombergNEF said for wind this is mainly down to a fall in the price of turbines – 7% lower on average globally compared with the end of 2018.

In China, the world’s largest solar market, the CAPEX of utility-scale PV plants has dropped 11% in the last six months, reaching $0.57m per MW.

“Weak demand for new plants in China has left developers and engineering, procurement and construction firms eager for business, and this has put pressure on CAPEX,” BloombergNEF said.

It added that estimates of the cheapest PV projects financed recently – in India, Chile and Australia – will be able to achieve an LCOE of $27-36/MWh, assuming competitive returns for their equity investors.

Best-in-class onshore wind farms in Brazil, India, Mexico and Texas can reach levelized costs as low as $26-31/MWh already, the research said.

Programs such as the World Bank wind program are helping developing countries accelerate wind deployment as costs continue to drop.

BloombergNEF associate in the energy economics team Tifenn Brandily said: “This is a three- stage process. In phase one, new solar and wind get cheaper than new gas and coal plants on a cost-of- energy basis.

“In phase two, renewables reach parity with power prices. In phase three, they become even cheaper than running existing thermal plants.

“Our analysis shows that phase one has now been reached for two-thirds of the global population.

“Phase two started with California, China and parts of Europe. We expect phase three to be reached on a global scale by 2030.

“As this all plays out, thermal power plants will increasingly be relegated to a balancing role, looking for opportunities to generate when the sun doesn’t shine or the wind doesn’t blow.”


Related News

View more

Putting Africa on the path to universal electricity access

West and Central Africa Electricity Access hinges on utility reform, renewable energy, off-grid solar, mini-grids, battery storage, and regional grid integration, lowering costs, curbing energy poverty, and advancing SDG7 with sustainable, reliable power solutions.


Key Points

Expanding reliable power via renewables, grid trade, and off-grid systems to cut energy poverty and unlock inclusive growth.

✅ Utility reform lowers costs and improves service reliability

✅ Regional grid integration enables clean, least-cost power trade

✅ Off-grid solar and mini-grids electrify remote communities


As commodity prices soar and leaders around the world worry about energy shortages and prices of gasoline at the pump, millions of people in Africa still lack access to electricity.  One-half of the people on the continent cannot turn on a fan when temperatures go up, can’t keep food cool, or simply turn the lights on. This energy access crisis must be addressed urgently.

In West and Central Africa, only three countries are on track to give every one of their people access to electricity by 2030. At this slow pace, 263 million people in the region will be left without electricity in ten years.  West Africa has one of the lowest rates of electricity access in the world; only about 42% of the total population, and 8% of rural residents, have access to electricity.

These numbers, some far too big, others far too small, have grave consequences. Electricity is an important step toward enhancing people’s opportunities and choices. Access is key to boosting economic activity and contributes to improving human capital, which, in turn, is an investment in a country’s potential.  

Without electricity, children can’t do their schoolwork at night. Businesspeople can’t get information on markets or trade with each other. Worse, as the COVID-19 pandemic has shown so starkly, limited access to energy constrains hospital and emergency services, further endangering patients and spoiling precious medicine.  

What will it take to power West and Central Africa?  
As the African continent recovers from COVID-19 impacts, now is the critical time to accelerate progress towards universal energy access to drive the region’s economic transformation, promote socio-economic inclusion, and unlock human capital growth. Without reliable access to electricity, the holes in a country’s social fabric can grow bigger, those without access growing disenchanted with inequality.  

Tackling the Africa region’s energy access crisis requires four bold approaches. 

First, this involves making utilities financially viable. Many power providers in the region are cash-strapped, operate dilapidated and aging generation fleet and infrastructure. Therefore, they can’t deliver reliable and affordable electricity to their customers, let alone deliver electricity to those that currently must rely on inadequate alternatives to electricity. Overall, fewer than half of the utilities in Sub-Saharan Africa recover their operating costs, resulting in GDP losses as high as four percent in some countries.

Improving the performance of national utilities and greening their power generation mix is a prerequisite to lowering the costs of supply, thus expanding electricity access to those currently unelectrified, usually lower-income and often remote households. 

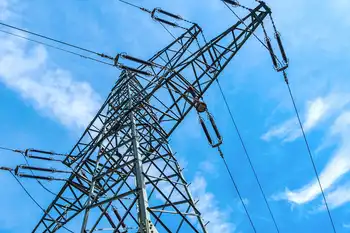
In that effort — and this a critical second point — West and Central African countries need to look beyond their borders and further integrate their national utilities and grids to other systems in the region. The region has an abundance of affordable clean energy sources — hydropower in Guinea, Mali, and Cote d’Ivoire; high solar irradiation in the Sahel — but the regional energy market is fragmented. 

Without efficient regional trade, many countries are highly dependent on one or two energy resources and heavily reliant on inefficient, polluting generation sources, requiring fuel imports linked to volatile international oil prices.

The vision of an integrated regional power market in countries of the Economic Community of West African States (ECOWAS) is coming a step closer to reality thanks to an ambitious program of cross-border interconnection projects. If countries take full advantage of this grid, the share of the region’s electricity consumption traded across borders would more than double from 8 percent today to about 17 percent by 2030. Overall, regional power trade could lower the lifecycle cost of West Africa’s power generation system by about 10 percent and provide greener energy by 2030. 

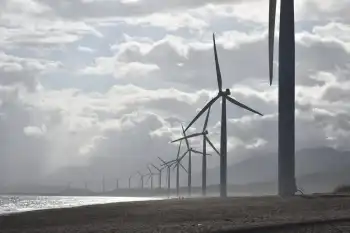
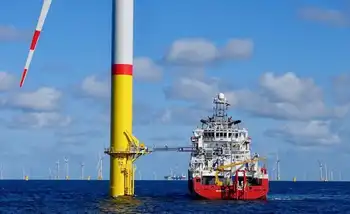
Third, electrification efforts need to be open to private sector investments and innovations, such as renewables like solar energy and battery storage, which have made a tremendous impact in enabling access for millions of poor and underserved households.  Specifically, off-grid solar systems and mini-grids have become a proven reliable way to provide affordable modern electricity services, powering homes in rural communities, healthcare facilities, and schools.

Burkina Faso, which enjoys one of the best solar radiation conditions in the region, is a successful example of leveraging the transformative impact of solar energy and battery storage. With support from the World Bank, the country is deploying solar energy to power its national grid, as well as mini-grids and individual household systems. Solar power with battery storage is competitive in Burkina Faso compared to other technologies and its government was successful in attracting private sector investments to support this technology.

Last, achieving universal electricity access will involve significant commitment from political leaders, especially developing policies and regulations that can attract high-quality investments.  

A significant step in that direction was achieved at the World Bank’s 2020 Annual Meetings with a commitment to set up the Powering Transformation Platform in each African country. Through the platform, each government will set their country-specific vision, goals and metrics, track progress, and explore and exchange innovative ideas and emerging best practices according to their own national energy needs and plans. 

This platform will bring together the elements needed to bring electricity to all in West and Central Africa and help attract new financing.

Over the last 3 years, the World Bank has doubled its investments to increase electricity access rates in Central and West Africa.  We have committed more than $7.8 billion to support 40 electricity access programs, of which more than half directly support new electricity connections. These operations are expected to provide access to 16 million people. The aim is to increase electricity access rates in West and Central Africa from 50 percent today to 64 percent by 2026.

However, World Bank’s financing alone is not enough. Our estimates show that nearly $20 billion are required for universal electrification across Sub-Saharan Africa, aligning with calls to quadruple power investment to meet demand, with about $10 billion annually needed for West and Central Africa. 

Closing the funding gap will require mobilizing traditional and new partners, especially the private sector, which is willing to invest if enabling conditions are in place, as well as philanthropic capital, that can fill in the space in areas not yet commercially attractive. The World Bank is ready to play a catalytical role in leveraging new investments. 

This is vital as less than a decade remains to reach the 2030 SDG7 goal of ensuring electricity for all through affordable, reliable, and modern energy services. As headlines worldwide focus on soaring energy prices in the developed world, we cannot lose sight of the vast populations in Africa that still cannot access basic energy services. This is the true global energy crisis.  


Related News

View more

U.S. power demand seen sliding 1% in 2023 on milder weather

EIA U.S. Power Outlook 2023-2024 forecasts lower electricity demand, softer wholesale prices, and faster renewable growth from solar and wind, with steady natural gas, reduced coal generation, slight nuclear gains, and ERCOT market moderation.


Key Points

An EIA forecast of a 2023 demand dip, 2024 rebound, lower prices, and a higher renewable share in the U.S. power mix.

✅ Demand dips to 4,000 billion kWh in 2023; rebounds in 2024.

✅ ERCOT on-peak prices average about $35/MWh versus $80/MWh in 2022.

✅ Renewables grow to 24% share; coal falls to 17%; nuclear edges up.


U.S. power consumption is expected to slip about 1% in 2023 from the previous year as milder weather slows usage from the record high hit in 2022, consistent with recent U.S. consumption trends observed over the past several years, the U.S. Energy Information Administration (EIA) said in its Short-Term Energy Outlook (STEO).

EIA projected that electricity demand is on track to slide to 4,000 billion kilowatt-hours (kWh) in 2023 from a historic high of 4,048 billion kilowatt-hours (kWh) in 2022, reflecting patterns seen during COVID-19 demand shifts in prior years, before rising to 4,062 billion kWh in 2024 as economic growth ramps up.

Less demand coupled with more electricity generation from cheap renewable power sources and lower natural gas prices is forecast to slash wholesale power prices this year, the EIA said.

The on-peak wholesale price at the North hub in Texas’ ERCOT power market is expected to average about $35 per megawatt-hour (MWh) in 2023 compared with an average of nearly $80/MWh in 2022 after the 2022 price surge in power markets.

As capacity for renewables like solar and wind ramp up and as natural gas prices ease amid the broader energy crisis pressures, the EIA said it expects coal-fired power generation to be 17% less in the spring of 2023 than in the spring of 2022.

Coal will provide an average of 17% of total U.S. generation this year, down from 20% last year, as utilities shift investments toward electricity delivery and away from new power production, the EIA said.

The share of total generation supplied by natural gas is seen remaining at about the same this year at 39%. The nuclear share of generation is seen rising slightly to 20% this year from 19% in 2022. Generation from renewable energy sources grows the most in the forecast, increasing to 24% this year from a share of 22% last year, even as residential electricity bills rose in 2022 across the U.S.


Related News

View more

What 2018 Grid Edge Trends Reveal About 2019

2019 Grid Edge Trends highlight evolving demand response, DER orchestration, real-time operations, AMI data, and EV charging, as wholesale markets seek flexibility and resiliency amid tighter reserve margins and fossil baseload retirements.


Key Points

Shifts toward DER-enabled demand response and real-time, behind-the-meter flexibility.

✅ Real-time DER dispatch enhances reliability during tight reserves

✅ AMI and ICT improve forecasting, monitoring, and control of resources

✅ Demand response shifts toward aggregated behind-the-meter orchestration


Which grid edge trends will continue into 2019 as the digital grid matures and what kind of disruption is on the horizon in the coming year?

From advanced metering infrastructure endpoints to electric-vehicle chargers, grid edge venture capital investments to demand response events, hundreds of data points go into tracking new trends at the edge of the grid amid ongoing grid modernization discussions across utilities.

Trends across these variables tell a story of transition, but perhaps not yet transformation. Customers hold more power than ever before in 2019, with utilities and vendors innovating to take advantage of new opportunities behind the meter. Meanwhile, external factors can always throw things off-course, including the data center boom that is posing new power challenges, and reliability is top of mind in light of last year's extreme weather events. What does the 2018 data say about 2019?

For one thing, demand response evolved, enabled by new information and communications technology. Last year, wholesale market operators increasingly sought to leverage the dispatch of distributed energy resource flexibility in close to real time. Three independent system operators and regional transmission organizations called on demand response five times in total for relief in the summer of 2018, including the NYISO.

The demand response events called in the last 18 months send a clear message: Grid operators will continue to call events year-round. This story unfolds as reserve margins continue to tighten, fossil baseload generation retirements continue, and system operators are increasingly faced with proving the resiliency and reliability of their systems while efforts to invest in a smarter electricity infrastructure gain momentum across the country.

In 2019, the total amount of flexible demand response capacity for wholesale market participation will remain about the same. However, the way operators and aggregators are using demand response is changing as information and communications technology systems improve and utilities are using AI to adapt to electricity demands, allowing the behavior of resources to be more accurately forecasted, monitored and controlled.

These improvements are allowing customer-sited resources to offer  flexibility services closer to real-time operations and become more reactive to system needs. At the same time, traditional demand response will continue to evolve toward the orchestration of DERs as an aggregate flexible resource to better enable growing levels of renewable energy on the grid.


Related News

View more

Annual U.S. coal-fired electricity generation will increase for the first time since 2014

U.S. coal-fired generation 2021 rose as higher natural gas prices, stable coal costs, and a recovering power sector shifted the generation mix; capacity factors rebounded despite low coal stocks and ongoing plant retirements.


Key Points

Coal output rose 22% on high gas prices and higher capacity factors; a 5% decline is expected in 2022.

✅ Natural gas delivered cost averaged $4.93/MMBtu, more than double 2020

✅ Coal capacity factor rose to ~51% from 40% in 2020

✅ 2022 coal generation forecast to fall about 5%


We expect 22% more U.S. coal-fired generation in 2021 than in 2020, according to our latest Short-Term Energy Outlook (STEO). The U.S. electric power sector has been generating more electricity from coal-fired power plants this year as a result of significantly higher natural gas prices and relatively stable coal prices, even as non-fossil sources reached 40% of total generation. This year, 2021, will yield the first year-over-year increase in coal generation in the United States since 2014, highlighted by a January power generation jump earlier in the year.

Coal and natural gas have been the two largest sources of electricity generation in the United States. In many areas of the country, these two fuels compete to supply electricity based on their relative costs and sensitivity to policies and gas prices as well. U.S. natural gas prices have been more volatile than coal prices, so the cost of natural gas often determines the relative share of generation provided by natural gas and coal.

Because natural gas-fired power plants convert fuel to electricity more efficiently than coal-fired plants, record natural gas generation has at times underscored that advantage, and natural gas-fired generation can have an economic advantage even if natural gas prices are slightly higher than coal prices. Between 2015 and 2020, the cost of natural gas delivered to electric generators remained relatively low and stable. This year, however, natural gas prices have been much higher than in recent years. The year-to-date delivered cost of natural gas to U.S. power plants has averaged $4.93 per million British thermal units (Btu), more than double last year’s price.

The overall decline in electricity demand in 2020 and record-low natural gas prices led coal plants to significantly reduce the percentage of time that they generated power. In 2020, the utilization rate (known as the capacity factor) of U.S. coal-fired generators averaged 40%. Before 2010, coal capacity factors routinely averaged 70% or more. This year’s higher natural gas prices have increased the average coal capacity factor to about 51%, which is almost the 2018 average, a year when wind and solar reached 10% nationally.

Although rising natural gas prices have resulted in more U.S. coal-fired generation than last year, this increase in coal generation will most likely not continue as solar and wind expand in the generation mix. The electric power sector has retired about 30% of its generating capacity at coal plants since 2010, and no new coal-fired capacity has come online in the United States since 2013. In addition, coal stocks at U.S. power plants are relatively low, and production at operating coal mines has not been increasing as rapidly as the recent increase in coal demand. For 2022, we forecast that U.S. coal-fired generation will decline about 5% in response to continuing retirements of generating capacity at coal power plants and slightly lower natural gas prices.


Related News

View more

Sign Up for Electricity Forum’s Newsletter

Stay informed with our FREE Newsletter — get the latest news, breakthrough technologies, and expert insights, delivered straight to your inbox.

Electricity Today T&D Magazine Subscribe for FREE

Stay informed with the latest T&D policies and technologies.
  • Timely insights from industry experts
  • Practical solutions T&D engineers
  • Free access to every issue

Download the 2025 Electrical Training Catalog

Explore 50+ live, expert-led electrical training courses –

  • Interactive
  • Flexible
  • CEU-cerified