BC Hydro Site C and Clean Energy Policy shapes B.C.'s power mix, affecting run-of-river hydro, net metering for rooftop solar, independent power producers, and surplus capacity forecasts tied to LNG Canada demand.
Key Points
BC Hydro's strategy centers on Site C, limiting new run-of-river projects and tightening net metering amid surplus power
✅ Site C adds long-term capacity with lower projected rates.
✅ Run-of-river IPP growth paused amid surplus forecasts.
✅ Net metering limits deter oversized rooftop solar.
Innergex Renewable Energy Inc. is celebrating the official commissioning today of what may be the last large run-of-river hydro project in B.C. for years to come.
The project – two new generating stations on the Upper Lillooet River and Boulder Creek in the Pemberton Valley – actually began producing power in 2017, but the official commissioning was delayed until Friday September 14.
Innergex, which earlier this year bought out Vancouver’s Alterra Power, invested $491 million in the two run-of-river hydro-electric projects, which have a generating capacity of 106 megawatts of power. The project has the generating capacity to power 39,000 homes.
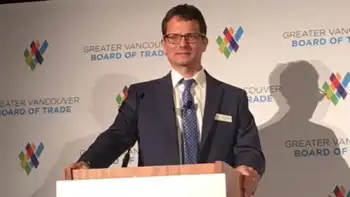
The commissioning happened to coincide with an address by BC Hydro CEO Chris O’Riley to the Greater Vancouver Board of Trade Friday, in which he provided an update on the progress of the $10.7-billion Site C dam project.
That project has put an end, for the foreseeable future, of any major new run-of-river projects like the Innergex project in Pemberton.
BC Hydro expects the new dam to produce a surplus of power when it is commissioned in November 2024, so no new clean energy power calls are expected for years to come.
Independent power producers aren’t the only ones who have seen a decline in opportunities to make money in B.C. providing renewable power, as the Siwash Creek project shows. So will homeowners who over-build their own solar power systems, in an attempt to make money from power sales.
There are about 1,300 homeowners in B.C. with rooftop solar systems, and when they produce surplus power, they can sell it to BC Hydro.
BC Hydro is amending the net metering program to discourage homeowners from over-building. In some cases, some howeowners have been generating 40% to 50% more power than they need.
“We were getting installations that were massively over-sized for their load, and selling this big quantity of power to us,” O’Riley said. “And that was never the idea of the program.”
Going forward, BC Hydro plans to place limits on how much power a homeowner can sell to BC Hydro.
BC Hydro has been criticized for building Site C when the demand for power has been generally flat, and reliance on out-of-province electricity has drawn scrutiny. But O’Riley said the dam isn’t being built for today’s generation, but the next.
“We’re not building Site C for today,” he said. “We have an energy surplus for the short term. We’re not even building it for 2024. We’re building it for the next 100 years.”
O’Riley acknowledged Site C dam has been a contentious and “extremely challenging” project. It has faced numerous court challenges, a late-stage review by the BC Utilities Commission, cost overruns, geotechnical problems and a dispute with the main contractors.
In a separate case, the province was ordered to pay $10 million over the denial of a Squamish power project, highlighting broader legal risk.
But those issues have been resolved, O’Riley said, and the project is back on track with a new construction schedule.
“As we move forward, we have a responsibility to deliver a project on time and against the new revised budget, and I’m confident the changes we’ve made are set up to do that,” O’Riley said.
Currently, there are about 3,300 workers employed on the dam project.
Despite criticisms that BC Hydro is investing in a legacy mega-project at a time when cost of wind and solar have been falling, O’Riley insisted that Site C was the best and lowest cost option.
“First, it’s the lowest cost option,” he said. “We expect over the first 20 years of Site C’s operating life, our customers will see rates 7% to 10% below what it would otherwise be using the alternatives.”
BC Hydro missed a critical window to divert the Peace River, something that can only be done in September, during lower river flows. That added a full year’s delay to the project.
O’Riley said BC Hydro had built in a one-year contingency into the project, so he expects the project can still be completed by 2024 – the original in-service target date. But the delay will add more than $2 billion to the last budget estimate, boosting the estimated capital cost from $8.3 billion to $10.7 billion.
Meeting the 2024 in-service target date could be important, if Royal Dutch Shell and its consortium partners make a final investment decision this year on the $40 billion LNG Canada project.
That project also has a completion target date of 2024, and would be a major new industrial customer with a substantial power draw for operations.
“If they make a decision to go forward, they will be a very big customer of BC Hydro,” O’Riley told Business in Vancouver. “They would be in our top three or four biggest customers.”
Related News