Iraq signs contract with GE

By Reuters


Substation Relay Protection Training

Our customized live online or in‑person group training can be delivered to your staff at your location.

  • Live Online
  • 12 hours Instructor-led
  • Group Training Available
Regular Price:
$699
Coupon Price:
$599
Reserve Your Seat Today
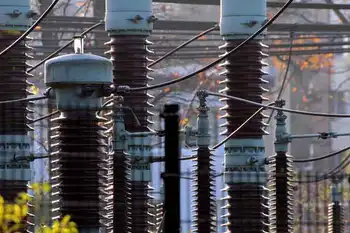
Iraq has signed a contract with General Electric Co. worth $480 million to build three power plants and is negotiating with Hyundai to buy diesel generators, the country's electricity minister said.

Iraq faces chronic electricity shortages, with its fragile grid, battered by years of war, sanctions and neglect, struggling to keep up with increasing demand. The capital Baghdad receives only a few hours of electricity every day.

Electricity Minister Karim Waheed told journalists in Baghdad that Iraq had signed a contract with General Electric to build three power stations in southern Baghdad the southern city of Kerbala, and Taji, north of Baghdad.

"According to the plan, the work will be completed between the end of 2009 and the start of 2010," Waheed said.

Iraq has also signed two other contracts, each worth $41 million, for GE to supply spare parts for the stations, he said.

Iraq said it had signed a 179 million euro contract with General Electric to buy eight natural gas-powered generators, most of which would be installed in Baghdad.

Five years after U.S. forces invaded to topple Saddam Hussein, and with violence at a four-year low, Iraqis are pressing the government to improve service delivery. Many areas lack access to electricity or drinking water.

With the onset of summer, when temperatures can reach 50 degrees Celsius (122 Fahrenheit), demand for power will increase as people turn on their air conditioners to keep cool.

Waheed said there was a wide gap between the consumption and supply of electricity in Iraq. Demand is around 10,500 MW, far above the 5,500 MW the grid is able to supply.

The minister said a contract would be signed with South Korean company Hyundai in Istanbul, Turkey, to supply Iraq with diesel generators. He did not give a value for the contract.

He said a contract would also be inked with German engineering group Siemens in Istanbul at the same time to supply Iraq with three "gas power units". He gave no further details.

Related News

Bomb Cyclone Leaves Half a Million Without Power in Western Washington

Western Washington Bomb Cyclone unleashed gale-force winds, torrential rain, and coastal flooding, causing massive power outages from Seattle to Tacoma; storm surge, downed trees, and blocked roads hindered emergency response and infrastructure repairs.


Key Points

A rapidly deepening storm with severe winds, rain, flooding, and major power outages across Western Washington.

✅ Rapid barometric pressure drop intensified the system

✅ Gale-force winds downed trees and power lines

✅ Coastal flooding and storm surge disrupted transport


A powerful "bomb cyclone" recently hit Western Washington, causing widespread destruction across the region. The intense storm left more than half a million residents without power, similar to B.C. bomb cyclone outages seen to the north, with outages affecting communities from Seattle to Olympia. This weather phenomenon, marked by a rapid drop in atmospheric pressure, unleashed severe wind gusts, heavy rain, and flooding, causing significant disruption to daily life.

The bomb cyclone, which is a rapidly intensifying storm, typically features a sharp drop in barometric pressure over a short period of time. This creates extreme weather conditions, including gale-force winds, torrential rain, and coastal flooding, as seen during California storm impacts earlier in the season. In Western Washington, the storm struck just as the region was beginning to prepare for the winter season, catching many off guard with its strength and unpredictability.

The storm's impact was immediately felt as high winds downed trees, power lines, and other infrastructure. By the time the worst of the storm had passed, utility companies had reported widespread power outages, with more than 500,000 customers losing electricity. The outages were particularly severe in areas like Seattle, Tacoma, and the surrounding communities. Crews worked tirelessly in difficult conditions to restore power, but many residents faced extended outages, underscoring US grid climate vulnerabilities that complicate recovery efforts, with some lasting for days due to the scope of the damage.

The power outages were accompanied by heavy rainfall, leading to localized flooding. Roads were inundated, making it difficult for first responders and repair crews to reach affected areas. Emergency services were stretched thin as they dealt with downed trees, blocked roads, and flooded neighborhoods. In some areas, floodwaters reached homes, forcing people to evacuate. In addition, several schools were closed, and public transportation services were temporarily halted, leaving commuters stranded and businesses unable to operate.

As the storm moved inland, its effects continued to be felt. Western Washington’s coastal regions were hammered by high waves and storm surges, further exacerbating the damage. The combination of wind and rain also led to hazardous driving conditions, prompting authorities to advise people to stay off the roads unless absolutely necessary.

While power companies worked around the clock to restore electricity, informed by grid resilience strategies that could help utilities prepare for future events, challenges persisted. Fallen trees and debris blocked access to repair sites, and the sheer number of outages made it difficult for crews to restore power quickly. Some customers were left in the dark for days, forced to rely on generators, candles, and other makeshift solutions. The storm's intensity left a trail of destruction, requiring significant resources to address the damages and rebuild critical infrastructure.

In addition to the immediate impacts on power and transportation, the bomb cyclone raised important concerns about climate change and the increasing frequency of extreme weather events. Experts note that storms like these are becoming more common, with rapid intensification leading to more severe consequences and compounding pressures such as extreme-heat electricity costs for households. As the planet warms, scientists predict that such weather systems will continue to grow in strength, posing greater challenges to cities and regions that are not always prepared for such extreme events.

In the aftermath of the storm, local governments and utility companies faced the daunting task of not only restoring services but also assessing the broader impact of the storm on communities. Many areas, especially those hit hardest by flooding and power outages, will require substantial recovery efforts. The devastation of the bomb cyclone highlighted the vulnerability of infrastructure in the face of rapidly changing weather patterns and water availability, as seen in BC Hydro drought adaptations nearby, and reinforced the need for greater resilience in the face of future storms.

The storm's impact on the Pacific Northwest is a reminder of the power of nature and the importance of preparedness. As Western Washington recovers, there is a renewed focus on strengthening infrastructure, including expanded renewable electricity to diversify supply, improving emergency response systems, and ensuring that communities are better equipped to handle the challenges posed by increasingly severe weather events. For now, residents remain hopeful that the worst is behind them and are working together to rebuild and prepare for whatever future storms may bring.

The bomb cyclone has left an indelible mark on Western Washington, but it also serves as a call to action for better preparedness, more robust infrastructure, and a greater focus on combating climate change to mitigate the impact of such extreme weather in the future.


Related News

View more

Clean B.C. is quietly using coal and gas power from out of province

BC Hydro Electricity Imports shape CleanBC claims as Powerex trades cross-border electricity, blending hydro with coal and gas supplies, affecting emissions, grid carbon intensity, and how electric vehicles and households assess "clean" power.


Key Points

Powerex buys power for BC Hydro, mixing hydro with coal and gas, shifting emissions and affecting CleanBC targets.

✅ Powerex trades optimize price, not carbon intensity

✅ Imports can include coal- and gas-fired generation

✅ Emissions affect EV and CleanBC decarbonization claims


British Columbians naturally assume they’re using clean power when they fire up holiday lights, juice up a cell phone or plug in a shiny new electric car. 

That’s the message conveyed in advertisements for the CleanBC initiative launched by the NDP government, amid indications that residents are split on going nuclear according to a survey, which has spent $3.17 million on a CleanBC “information campaign,” including almost $570,000 for focus group testing and telephone town halls, according to the B.C. finance ministry.

“We’ll reduce air pollution by shifting to clean B.C. energy,” say the CleanBC ads, which feature scenic photos of hydro reservoirs. “CleanBC: Our Nature. Our Power. Our Future.” 

Yet despite all the bumph, British Columbians have no way of knowing if the electricity they use comes from a coal-fired plant in Alberta or Wyoming, a nuclear plant in Washington, a gas-fired plant in California or a hydro dam in B.C. 

Here’s why. 

BC Hydro’s wholly-owned corporate subsidiary, Powerex Corp., exports B.C. power when prices are high and imports power from other jurisdictions when prices are low. 

In 2018, for instance, B.C. imported more electricity than it exported — not because B.C. has a power shortage (it has a growing surplus due to the recent spate of mill closures and the commissioning of two new generating stations in B.C.) but because Powerex reaps bigger profits when BC Hydro slows down generators to import cheaper power, especially at night.

“B.C. buys its power from outside B.C., which we would argue is not clean,” says Martin Mullany, interim executive director for Clean Energy BC. 

“A good chunk of the electricity we use is imported,” Mullany says. “In reality we are trading for brown power” — meaning power generated from conventional ‘dirty’ sources such as coal and gas. 

Wyoming, which generates almost 90 per cent of its power from coal, was among the 12 U.S. states that exported power to B.C. last year. (Notably, B.C. did not export any electricity to Wyoming in 2018.)

Utah, where coal-fired power plants produce 70 per cent of the state’s energy amid debate over the costs of scrapping coal-fired electricity, and Montana, which derives about 55 per cent of its power from coal, also exported power to B.C. last year. 

So did Nebraska, which gets 63 per cent of its power from coal, 15 per cent from nuclear plants, 14 per cent from wind and three per cent from natural gas.   

Coal is responsible for about 23 per cent of the power generated in Arizona, another exporter to B.C., while gas produces about 44 per cent of the electricity in that state.  

In 2017, the latest year for which statistics are available, electricity imports to B.C. totalled just over 1.2 million tonnes of carbon dioxide emissions, according to the B.C. environment ministry — roughly the equivalent of putting 255,000 new cars on the road, using the U.S. Environmental Protection Agency’s calculation of 4.71 tonnes of annual carbon emissions for a standard passenger vehicle. 

These figures far outstrip the estimated local and upstream emissions from the contested Woodfibre LNG plant in Squamish that is expected to release annual emissions equivalent to 170,000 new cars on the road.

Import emissions cast a new light on B.C.’s latest “milestone” announcement that 30,000 electric cars are now among 3.7 million registered vehicles in the province.

BC Electric Vehicles Announcement Horgan Heyman Mungall Weaver
In November of 2018 the province announced a new target to have all new light-duty cars and trucks sold to be zero-emission vehicles by the year 2040. Photo: Province of B.C. / Flickr

“Making sure more of the vehicles driven in the province are powered by BC Hydro’s clean electricity is one of the most important steps to reduce [carbon] pollution,” said the November 28 release from the energy ministry, noting that electrification has prompted a first call for power in 15 years from BC Hydro.

Mullany points out that Powerex’s priority is to make money for the province and not to reduce emissions.

“It’s not there for the cleanest outcome,” he said. “At some time we have to step up to say it’s either the money or the clean power, which is more important to us?”

Electricity bought and sold by little-known, unregulated Powerex
These transactions are money-makers for Powerex, an opaque entity that is exempt from B.C.’s freedom of information laws. 

Little detailed information is available to the public about the dealings of Powerex, which is overseen by a board of directors comprised of BC Hydro board members and BC Hydro CEO and president Chris O’Reilly. 

According to BC Hydro’s annual service plan, Powerex’s net income ranged from $59 million to $436 million from 2014 to 2018. 

“We will never know the true picture. It’s a black box.” 

Powerex’s CEO Tom Bechard — the highest paid public servant in the province — took home $939,000 in pay and benefits last year, earning $430,000 of his executive compensation through a bonus and holdback based on his individual and company performance.  

“The problem is that all of the trade goes on at Powerex and Powerex is an unregulated entity,” Mullany says. 

“We will never know the true picture. It’s a black box.” 

In 2018, Powerex exported 8.7 million megawatt hours of electricity to the U.S. for a total value of almost $570 million, according to data from the Canada Energy Regulator. That same year, Powerex imported 9.6 million megawatt hours of electricity from the U.S. for almost $360 million. 

Powerex sold B.C.’s publicly subsidized power for an average of $87 per megawatt hour in 2018, according to the Canada Energy Regulator. It imported electricity for an average of $58 per megawatt hour that year. 

In an emailed statement in response to questions from The Narwhal, BC Hydro said “there can be a need to import some power to meet our electricity needs” due to dam reservoir fluctuations during the year and from year to year.

‘Impossible’ to determine if electricity is from coal or wind power
Emissions associated with electricity imports are on average “significantly lower than the emissions of a natural gas generating plant because we mostly import electricity from hydro generation and, increasingly, power produced from wind and solar,” BC Hydro claimed in its statement. 

But U.S. energy economist Robert McCullough says there’s no way to distinguish gas and coal-fired U.S. power exports to B.C. from wind or hydro power, noting that “electrons lack labels.” 

Similarly, when B.C. imports power from Alberta, where generators are shifting to gas and 48.5 per cent of electricity production is coal-fired and 38 per cent comes from natural gas, there’s no way to tell if the electricity is from coal, wind or gas, McCullough says.

“It really is impossible to make that determination.” 

Wyoming Gilette coal pits NASA
The Gillette coal pits in Wyoming, one of the largest coal-producers in the U.S. Photo: NASA Earth Observatory

Neither the Canada Energy Regulator nor Statistics Canada could provide annual data on electricity imports and exports between B.C. and Alberta. 

But you can watch imports and exports in real time on this handy Alberta website, which also lists Alberta’s power sources. 

In 2018, California, Washington and Oregon supplied considerably more power to B.C. than other states, according to data from Canada Energy Regulator. 

Washington, where about one-quarter of generated power comes from fossil fuels, led the pack, with more than $339 million in electricity exports to B.C. 

California, which still gets more than half of its power from gas-fired plants even though it leads the U.S. in renewable energy with substantial investments in wind, solar and geothermal, was in second place, selling about $18.4 million worth of power to B.C. 

And Oregon, which produces about 43 per cent of its power from natural gas and six per cent from coal, exported about $6.2 million worth of electricity to B.C. last year. 

By comparison, Nebraska’s power exports to B.C. totalled about $1.6 million, Montana’s added up to $1.3 million,  Nevada’s were about $706,000 and Wyoming’s were about $346,000.

Clean electrons or dirty electrons?
Dan Woynillowicz, deputy director of Clean Energy Canada, which co-chaired the B.C. government’s Climate Solutions and Clean Growth Advisory Council, says B.C. typically exports power to other jurisdictions during peak demand. 

Gas-fired plants and hydro power can generate electricity quickly, while coal-fired power plants take longer to ramp up and wind power is variable, Woynillowicz notes. 

“When you need power fast and there aren’t many sources that can supply it you’re willing to pay more for it.”

Woynillowicz says “the odds are high” that B.C. power exports are displacing dirty power.

Elsewhere in Canada, analysts warn that Ontario's electricity could get dirtier as policies change, raising similar concerns.

“As a consumer you never know whether you’re getting a clean electron or a dirty electron. You’re just getting an electron.” 


Related News

View more

Global electric power demand surges above pre-pandemic levels

Global Power Sector CO2 Surge 2021 shows electricity demand outpacing renewable energy, with coal and fossil fuels rebounding, undermining green recovery goals and climate change targets flagged by the IEA and IPCC.


Key Points

Record rise in power sector CO2 in 2021 as demand outpaced renewables and coal rebounded, undermining a green recovery.

✅ Electricity demand rose 5% above pre-pandemic levels

✅ Fossil fuels supplied 61% of power; coal led the rebound

✅ Wind and solar grew 15% but lagged demand


Carbon dioxide emissions from the global electric power sector surged past pre-pandemic levels to record highs in the first half of 2021, according to new research by London-based environmental think tank Ember.

Electricity demand and emissions are now 5% higher than where they were before the Covid-19 outbreak, which prompted worldwide lockdowns that led to a temporary drop in global greenhouse gas emissions. Electricity demand also surpassed the growth of renewable energy, and surging electricity demand is putting power systems under strain, the analysis found.

The findings signal a failure of countries to achieve a so-called “green recovery” that would entail shifting away from fossil fuels toward renewable energy, though European responses to Covid-19 have accelerated the electricity system transition by about a decade, to avoid the worst consequences of climate change.

The report found that 61% of the world’s electricity still came from fossil fuels in 2020. Five G-20 countries had more than 75% of their electricity supplied from fossil fuels last year, with Saudi Arabia at 100%, South Africa at 89%, Indonesia at 83%, Mexico at 75% and Australia at 75%.

Coal generation did fall a record 4% in 2020, but overall coal supplied 43% of the additional energy demand between 2019 and 2020, with soaring electricity and coal use underscoring persistent demand pressures. Asia currently generates 77% of the world’s coal electricity and China alone generates 53%, up from 44% in 2015.

The world’s transition out of coal power, which contributes to roughly 30% of the world’s greenhouse gas emissions, is happening far too slowly to avoid the worst impacts of climate change, the study warned. And the International Energy Agency forecasts coal generation will rebound in 2021 as electricity demand picks up again, even as renewables are poised to eclipse coal by 2025 according to other analyses.

“Progress is nowhere near fast enough. Despite coal’s record drop during the pandemic, it still fell short of what is needed,” Ember lead analyst Dave Jones said in a statement.

Jones said coal power usage must collapse by 80% by the end of the decade to avoid dangerous levels of global warming above 1.5 degrees Celsius (2.7 degrees Fahrenheit).

“We need to build enough clean electricity to simultaneously replace coal and electrify the global economy,” Jones said. “World leaders have yet to wake up to the enormity of the challenge.”

The findings come ahead of a major U.N. climate conference in Glasgow, Scotland, in November, where negotiators will push for more ambitious climate action and emissions reduction pledges from nations.

Without immediate, rapid and large-scale reductions to global emissions, scientists of the Intergovernmental Panel on Climate Change warn that the average global temperature will likely cross the 1.5 degrees Celsius threshold within 20 years.

The study also highlighted some upsides. Wind and solar generation, for instance, rose by 15% in 2020, and low-emissions sources are set to cover almost all the growth in global electricity demand in the next three years, producing nearly a tenth of the world’s electricity last year and doubling production since 2015.

Some countries now get about 10% of their electricity from wind and solar, including India, China, Japan, Brazil. The U.S. and Europe have experienced the biggest growth in wind and solar, and in the EU, wind and solar generated more electricity than gas last year, with Germany at 33% and the U.K. leads the G20 for wind power at 29%.


Related News

View more

IEA: Electricity investment surpasses oil and gas for the first time

Electricity Investment Surpasses Oil and Gas 2016, driven by renewable energy, power grids, and energy efficiency, as IEA reports lower oil and gas spending, rising solar and wind capacity, and declining coal power plant approvals.


Key Points

A 2016 milestone where electricity topped global energy investment, led by renewables, grids, and efficiency, per the IEA.

✅ IEA: electricity investment hit $718b; oil and gas fell to $650b.

✅ Renewables led with $297b; solar and wind unit costs declined.

✅ Coal plant approvals plunged; networks and storage spending rose.


Investments in electricity surpassed those in oil and gas for the first time ever in 2016 on a spending splurge on renewable energy and power grids as the fall in crude prices led to deep cuts, the International Energy Agency (IEA) said.

Total energy investment fell for the second straight year by 12 per cent to US$1.7 trillion compared with 2015, the IEA said. Oil and gas investments plunged 26 per cent to US$650 billion, down by over a quarter in 2016, and electricity generation slipped 5 per cent.

"This decline (in energy investment) is attributed to two reasons," IEA chief economist Laszlo Varro told journalists.

"The reaction of the oil and gas industry to the prolonged period of low oil prices which was a period of harsh investment cuts; and technological progress which is reducing investment costs in both renewable power and in oil and gas," he said.

Oil and gas investment is expected to rebound modestly by 3 per cent in 2017, driven by a 53 per cent upswing in U.S. shale, and spending in Russia and the Middle East, the IEA said in a report.

"The rapid ramp up of U.S. shale activities has triggered an increase of U.S. shale costs of 16 per cent in 2017 after having almost halved from 2014-16," the report said.

The global electricity sector, however, was the largest recipient of energy investment in 2016 for the first time ever, overtaking oil, gas and coal combined, the report said.

"Robust investments in renewable energy and increased spending in electricity networks, which supports the outlook that low-emissions sources will cover most demand growth, made electricity the biggest area of capital investments," Varro said.

Electricity investment worldwide was US$718 billion, lifted by higher spending in power grids which offset the fall in power generation investments.

"Investment in new renewables-based power capacity, at US$297 billion, remained the largest area of electricity spending, despite falling back by 3 per cent as clean energy investment in developing nations slipped, the report said."

Although renewables investments was 3 per cent lower than five years ago, capacity additions were 50 per cent higher and expected output from this capacity about 35 per cent higher, thanks to the fall in unit costs and technology improvements in solar PV and wind generation, the IEA said.


COAL INVESTMENT IS COMING TO AN END

Investments in coal-fired electricity plants fell sharply. Sanctioning of new coal power plants fell to the lowest level in nearly 15 years, reflecting concerns about local air pollution, and emergence of overcapacity and competition from renewables, with renewables poised to eclipse coal in global power generation, notably in China. Coal investments, however, grew in India.

"Coal investment is coming to an end. At the very least, it is coming to a pause," Varro said.

The IEA report said energy efficiency investments continued to expand in 2016, reaching US$231 billion, with most of it going to the building sector globally.

Electric vehicles sales rose 38 per cent in 2016 to 750,000 vehicles at $6 billion, and represented 10 per cent of all transport efficiency spending. Some US$6 billion was spent globally on electronic vehicle charging stations, the IEA said.

Spending on electricity networks and storage continued the steady rise of the past five years, as surging electricity demand puts power systems under strain, reaching an all-time high of US$277 billion in 2016, with 30 per cent of the expansion driven by China’s spending in its distribution system, the report said.

China led the world in energy investments with 21 per cent of global total share, the report said, driven by low-carbon electricity supply and networks projects.

Although oil and gas investments fell in the United States in 2016, its total energy investments rose 16 per cent, even as Americans use less electricity in recent years, on the back of spending in renewables projects, the IEA report said.


Related News

View more

Blizzard and Extreme Cold Hit Calgary and Alberta

Calgary Winter Storm and Extreme Cold delivers heavy snowfall, ECCC warnings, blowing snow, icy roads, and dangerous wind chill across southern Alberta, as a low-pressure system and northerly inflow fuel hazardous travel and frostbite risks.


Key Points

A severe Alberta storm with heavy snow, strong winds, ECCC warnings, dangerous wind chill, and high frostbite risk.

✅ ECCC extends snowfall and winter storm warnings regionwide.

✅ Wind chill -28 to -47; frostbite possible within 5-30 minutes.

✅ AMA rescues surge; non-essential travel strongly discouraged.


Calgary and much of southern Alberta faced a significant winter storm that brought heavy snowfall, strong winds, and dangerously low temperatures. Environment and Climate Change Canada (ECCC) issued extended and expanded snowfall and winter storm warnings as persistent precipitation streamed along the southern borders. The combination of a low-pressure system off the West Coast, where a B.C. 'bomb cyclone' had left tens of thousands without power, and a northerly inflow at the surface led to significant snow accumulations in a short period.

The storm resulted in poor driving conditions across much of southern Alberta, with snow-packed and icy roads, as well as limited visibility due to blowing snow. ECCC advised postponing non-essential travel until conditions improved. As of 10 a.m. on January 17, the 511 Alberta map showed poor driving conditions throughout the region, while B.C. electricity demand hit an all-time high amid the cold.

In Calgary, the city recorded four centimeters of snow on January 16, with an additional four centimeters expected on January 17. Temperatures remained far below seasonal averages until the end of the week, and Calgary electricity use tends to surge during such cold snaps according to Enmax, with improvements starting on Sunday.

The extreme cold posed significant risks, with wind chills of -28 to -39 capable of causing frostbite in 10 to 30 minutes, as a Quebec power demand record illustrated during the deep freeze. When wind chills dropped to -40 to -47, frostbite could occur in as little as five to 10 minutes. Residents were advised to watch for signs of frostbite, including color changes on fingers and toes, pain, numbness, tingling sensations, or swelling. Those most at risk included young children, older adults, people with chronic illnesses, individuals working or exercising outdoors, and those without proper shelter.

In response to the severe weather, the Alberta Motor Association (AMA) experienced a surge in calls for roadside assistance. Between January 12 and 14, there were approximately 32,000 calls, with about 22,000 of those requiring rescues between January 12 and 14. The high volume of requests led the AMA to temporarily cease providing wait time updates on their website due to the inability to provide accurate information, while debates over Alberta electricity prices also intensified during the cold.

The storm also had broader implications across Canada. Heavy snow was expected to fall across wide swaths of southern British Columbia and parts of southern Alberta, as BC Hydro's winter payment plan offered billing relief to customers during the stretch. Northern Alberta was under extreme cold warnings, with temperatures expected to dip to -40°C through the rest of the week. Similar extreme cold was forecast for southern Ontario, with wind chill values reaching -30°C.

As the storm progressed, conditions began to improve. The wind warning for central Alberta ended by January 17, though a blowing snow advisory remained in effect for the southeast corner of the province. Northwest winds gusting up to 90 km/h combined with falling snow continued to cause poor visibility in some areas, while California power outages and landslides were reported amid concurrent severe storms along the coast. Conditions were expected to improve by mid-morning.

In the aftermath of the storm, residents were reminded of the importance of preparedness and caution during severe winter weather. Staying informed through official weather advisories, adjusting travel plans, and taking necessary precautions can help mitigate the risks associated with such extreme conditions.


Related News

View more

Electricity prices rise more than double EU average in first half of 2021

Estonia energy prices 2021 show sharp electricity hikes versus the EU average, mixed natural gas trends, kWh tariffs on Nord Pool spiking, and VAT, taxes, and support measures shaping household bills.


Key Points

EU-high electricity growth, early gas dip, then Nord Pool spikes; taxes, VAT, and subsidies shaped energy bills.

✅ Electricity up 7% on year; EU average 2.8% in H1 2021.

✅ Gas fell 1% in H1; later spiked with global market.

✅ VAT, taxes, excise and aid impacted household costs.


Estonia saw one of the highest rates in growth of electricity prices in the first half of 2021, compared with the same period in key trends in 2020 across Europe. These figures were posted before the more recent, record level of electricity and natural gas prices; the latter actually dropped slightly in Estonia in the first half of the year.

While electricity prices rose 7 percent on year in the first half of 2021 in Estonia, the average for the EU as a whole, where energy prices drove inflation across the bloc, stood at 2.8 percent over the same period, BNS reports.

Hungary (€10 per 100 Kwh) and Bulgaria (€10.20 per 100 Kwh) saw the lowest electricity prices EU-wide, while at €31.9 per KWH, Germany's power prices posted the most expensive rate, while Denmark, Belgium and Ireland also had high prices, in excess of €25 per Kwh.

Slovenia saw the highest electricity price rise, at 15 percent, and even the United States' electricity prices saw their steepest rise in decades during the same era, while Estonia was in third place, joint with Romania at 7 percent as noted, and behind Poland (8 percent).

Lithuania, on the other hand, experienced the third highest electricity price fall over the first half of 2021, compared with the same period in 2020, at 6 percent, behind only Cyprus (7 percent) and the Netherlands (10 percent, largely due to a tax cut).

Urmas Reinsalu: VAT on electricity, gas and heating needs to be lowered
The EU average price of electricity was €21.9 percent per Kwh, with taxes and excise accounting for 39 percent of this, even as prices in Spain surged across the day-ahead market.

Estonia has also seen severe electricity price rises in the second half of the year so far, with records set and then promptly broken several times earlier in October, while an Irish electricity provider raised prices amid similar pressures, and a support package for low income households rolled out for the winter season (October to March next year). The price on the Nord Pool market as of €95.01 per Kwh; a day earlier it had stood at €66.21 per Kwh, while on October 19 the price was €140.68 per Kwh.

Gas prices
Natural gas prices to household, meanwhile, dropped in Estonia over the same period, at a sharper rate (1 percent) than the EU average (0.5 percent), according to Eurostat.

Gas prices across the EU were lowest in Lithuania (€2.8 per 100 Kwh) and highest in the Netherlands (€9.6 per KWH), while the highest growth was seen in Denmark (19 percent), in the first half of 2021.

Natural gas prices dropped in 20 member states, however, with the largest drop again coming in Lithuania (23 percent).

The average price of natural gas EU-side in the first half of 2021 was €6.4, and taxes and excise duties accounted on average for 36 percent of the total.

The second half of the year has seen steep gas price rises in Estonia, largely the result of increases on the world market, though European gas benchmarks later fell to pre-Ukraine war levels.


Related News

View more

Sign Up for Electricity Forum’s Newsletter

Stay informed with our FREE Newsletter — get the latest news, breakthrough technologies, and expert insights, delivered straight to your inbox.

Electricity Today T&D Magazine Subscribe for FREE

Stay informed with the latest T&D policies and technologies.
  • Timely insights from industry experts
  • Practical solutions T&D engineers
  • Free access to every issue

Live Online & In-person Group Training

Advantages To Instructor-Led Training – Instructor-Led Course, Customized Training, Multiple Locations, Economical, CEU Credits, Course Discounts.

Request For Quotation

Whether you would prefer Live Online or In-Person instruction, our electrical training courses can be tailored to meet your company's specific requirements and delivered to your employees in one location or at various locations.