Three Mile Island Nuclear Debate spotlights subsidies, carbon pricing, wholesale power markets, grid reliability, and zero-emissions goals as Pennsylvania weighs keeping Exelon's reactor open amid natural gas competition and flat electricity demand.
Key Points
Debate over subsidies, carbon pricing, and grid reliability shaping Three Mile Island's zero-emissions future.
✅ Zero emissions credits vs market integrity
✅ Carbon pricing to value clean baseload power
✅ Closure risks jobs, tax revenue, and reliability
Three Mile Island is at the center of a new conversation about the future of nuclear energy in the United States nearly 40 years after a partial meltdown at the Central Pennsylvania plant sparked a national debate about the safety of nuclear power.
The site is slated to close in just two years, a closure plan Exelon has signaled, unless Pennsylvania or a regional power transmission operator delivers some form of financial relief, says Exelon, the Chicago-based power company that operates the plant.
That has drawn the Keystone State into a growing debate: whether to let struggling nuclear plants shut down if they cannot compete in the regional wholesale markets where energy is bought and sold, or adopt measures to keep them in the business of generating power without greenhouse gas emissions.
""The old compromise — that in order to have a reliable, affordable electric system you had to deal with a significant amount of air pollution — is a compromise our new customers today don't want to hear about.""
-Joseph Dominguez, Exelon executive vice president
Nuclear power plants produce about two-thirds of the country's zero-emissions electricity, a role many view as essential to net-zero emissions goals for the grid.
The debate is playing out as some regions consider putting a price on planet-warming carbon emissions produced by some power generators, which would raise their costs and make nuclear plants like Three Mile Island more viable, and developments such as Europe's nuclear losses highlight broader energy security concerns.
States that allow nuclear facilities to close need to think carefully because once a reactor is powered down, there's no turning back, said Jake Smeltz, chief of staff for Pennsylvania State Sen. Ryan Aument, who chairs the state's Nuclear Energy Caucus.
"If we wave goodbye to a nuclear station, it's a permanent goodbye because we don't mothball them. We decommission them," he told CNBC.
Three Mile Island's closure would eliminate more than 800 megawatts of electricity output. That's roughly 10 percent of Pennsylvania's zero-emissions energy generation, by Exelon's calculation. Replacing that with fossil fuel-fired power would be like putting roughly 10 million cars on the road, it estimates.
A closure would also shed about 650 well-paying jobs, putting the just transition challenge in focus for local workers and communities, tied to about $60 million in wages per year. Dauphin County and Londonderry Township, a rural area on the Susquehanna River where the plant is based, stand to lose $1 million in annual tax revenue that funds schools and municipalities. The 1,000 to 1,500 workers who pack local hotels, stores and restaurants every two years for plant maintenance would stop visiting.
Pennsylvanians and lawmakers must now decide whether these considerations warrant throwing Exelon a lifeline. It's a tough sell in the nation's second-largest natural gas-producing state, which already generates more energy than it uses. And time is running out to reach a short-term solution.
"What's meaningful to us is something where we could see the results before we turn in the keys, and we turn in the keys the third quarter of '19," said Joseph Dominguez, Exelon's executive vice president for governmental and regulatory affairs and public policy.
The end of the nuclear age?
The problem for Three Mile Island is the same one facing many of the nation's 60 nuclear plants: They are too expensive to operate.
Financial pressure on these facilities is mounting as power demand remains stagnant due to improved energy efficiency, prices remain low for natural gas-fired generation and costs continue to fall for wind and solar power.
Three Mile Island is something of a special case: The 1979 incident left only one of its two reactors operational, but it still employs about as many people as a plant with two reactors, making it less efficient. In the last three regional auctions, when power generators lock in buyers for their future energy generation, no one bought power from Three Mile Island.
But even dual-reactor plants are facing existential threats. FirstEnergy Corp's Beaver Valley will sell or close its nuclear plant near the Pennsylvania-Ohio border next year as it exits the competitive power-generation business, and facilities like Ohio's Davis-Besse illustrate what's at stake for the region.
Five nuclear power plants have shuttered across the country since 2013. Another six have plans to shut down, and four of those would close well ahead of schedule. An analysis by energy research firm Bloomberg New Energy Finance found that more than half the nation's nuclear plants are facing some form of financial stress.
Today's regional energy markets, engineered to produce energy at the lowest cost to consumers, do not take into account that nuclear power generates so much zero-emission electricity. But Dominguez, the Exelon vice president, said that's out of step with a world increasingly concerned about climate change.
"What we see is increasingly our customers are interested in getting electricity from zero air pollution sources," Dominguez said. "The old compromise — that in order to have a reliable, affordable electric system you had to deal with a significant amount of air pollution — is a compromise our new customers today don't want to hear about."
Strange bedfellows
Faced with the prospect of nuclear plant closures, Chicago and New York have both allowed nuclear reactors to qualify for subsidies called zero emissions credits. Exelon lobbied for the credits, which will benefit some of its nuclear plants in those states.
Even though the plants produce nuclear waste, some environmental groups like the Natural Resources Defense Council supported these plans. That's because they were part of broader packages that promote wind and solar power, and the credits for nuclear are not open-ended. They essentially provide a bridge that keeps zero-emissions power from nuclear reactors on the grid as renewable energy becomes more viable.
Lawmakers in Pennsylvania, Ohio and Connecticut are currently exploring similar options. Jake Smeltz, chief of staff to state Sen. Aument, said legislation could surface in Pennsylvania as soon as this fall. The challenge is to get people to consider the attributes of the sources of their electricity beyond just cost, according to Smeltz.
"Are the plants worth essentially saving? That's a social choice. Do they provide us with something that has benefits beyond the electrons they make? That's the debate that's been happening in other states, and those states say yes," he said.
Subsidies face opposition from anti-nuclear energy groups like Three Mile Island Alert, as well as natural gas trade groups and power producers who compete against Exelon by operating coal and natural gas plants.
"Where we disagree is to have an out-of-market subsidy for one specific company, for a technology that is now proven and mature in our view, at the expense of consumers and the integrity of competitive markets," NRG Energy Mauricio Gutierrez told analysts during a conference call this month.
Smeltz notes that power producers like NRG would fill in the void left by nuclear plants as they continue to shut down.
"The question that I think folks need to answer is are these programs a bailout or is the opposition to the program a payout? Because at the end of the day someone is going to make money. The question is who and how much?" Smeltz said.
Changing the market
Another critic is PJM Interconnection, the regional transmission organization that operates the grid for 13 states, including Pennsylvania, and Washington, D.C.
The subsidies distort price formation and inject uncertainty into the markets, says Stu Bresler, senior vice president in charge of operations and markets at PJM.
The danger PJM sees is that each new subsidy creates a precedent for government intervention. The uncertainty makes it harder for investors to determine what sort of power generation is a sound investment in the region, Bresler explained. Those investors could simply decide to put their capital to work in other energy markets where the regulatory outlook is more stable, ultimately leading to underinvestment in places where government intervenes, he added.
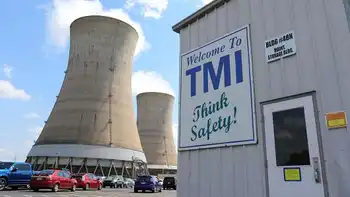
Three Mile Island nuclear power plant, Londonderry Township, Pennsylvania
PJM believes longer-term, regional approaches are more appropriate. It has produced research that outlines how coal plants and nuclear energy, which provide the type of stable energy that is still necessary for reliable power supply, could play a larger role in setting prices. It is also preparing to release a report on how to put a price on carbon emissions in all or parts of the regional grid.
"If carbon emissions are the concern and that is the public policy issue with which policymakers are concerned, the simple be-all answer from a market perspective is putting a price on carbon," Bresler said.
Three Mile Island could be viable if natural gas prices rose from below $3 per million British thermal units to about $5 per mmBtu and if a "reasonable" price were applied to carbon, according to Exelon's Dominguez. He is encouraged by the fact that conversations around new pricing models and carbon pricing are gaining traction.
"The great part about this is everybody understands we have a major problem. We're losing some of the lowest-cost, cleanest and most reliable resources in America," Dominguez said.
Related News