Wind energy — too much of a good thing

By GLG News


CSA Z463 Electrical Maintenance

Our customized live online or in‑person group training can be delivered to your staff at your location.

  • Live Online
  • 6 hours Instructor-led
  • Group Training Available
Regular Price:
$249
Coupon Price:
$199
Reserve Your Seat Today
A surfeit of wind energy is pushing down the price of all electricity.

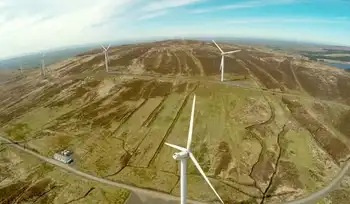
The real time price of electricity in West Texas, where almost all generation is wind, was negative for 23% of April. The negative prices spilled over to the rest of Texas for about 1% of the month. This may be the future of the electric industry, with negative prices for a substantial amount of time each month.

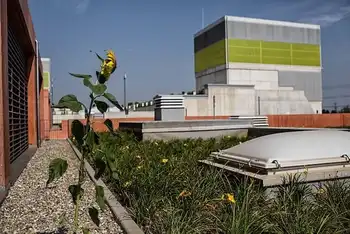
Various government programs are promoting renewable energy production schemes, such as wind machines, solar cells, and geothermal. These schemes include:

• Tax Credits — Developers receive a discount on their income taxes for investment in renewable energy projects. The tax credits can be based on the amount invested in the project or in the amount of energy produced by the project.

• Renewable Portfolio Standards (RPS) — States require their utilities to produce a stated fraction of their electricity using various types of renewable energy. The definition of utility varies, sometimes including municipally owned utilities, cooperatively owned utilities, marketers, and consumers who produce their own electricity. The definition of renewable varies, sometimes including nuclear, conventional hydro, trash burners, etc.

RPS generally includes a provision for a Renewable Energy Credit (REC) where a utility with a surplus of renewable can sell their compliance to others with a shortage. Some states value one form of renewable at multiples of other forms of renewable, such that RECs may not be fungible across state lines.

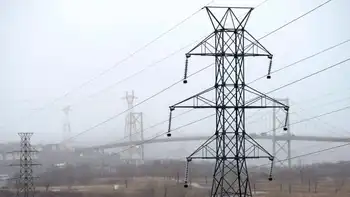
The effect of these government programs is a surfeit of renewable energy projects, especially wind projects. Since electricity is fungible, the surfeit of renewable energy projects is creating a surplus of electricity capacity, and sometimes a surplus of the actual production of electricity. Since electricity cannot be easily stored, the surplus can cause operating problems and is driving down the market price for electricity in the competitive markets such as ERCOT, the Electricity Reliability Council Of Texas, which operates the electricity facilities in most of Texas.

ERCOT has identified four different market areas based on the likelihood of transmission constraints between these market areas. The smallest market area is the West market area, which is dominated by wind generation. The capacity of wind generators in the West market area is so great that they occasionally swamp the transmission lines connecting the West market area with the rest of ERCOT. During such times, ERCOT calls upon the generators in the West market area to reduce generation, essentially to dump wind.

Until recently the ERCOT procedure was to actually tell generators in the West market area to dump wind. The wind generators apparently were unhappy with the command and control attitude of ERCOT and sought an economic approach. The current ERCOT approach allows generators in the West market area to bid for access to the transmission lines connecting the West market area to the rest of ERCOT. At least that was effectively the situation for 23% of the time in April 2009. During 664 of the quarter hour periods in April, the price for generation in the West market area was less than zero, with generators paying for the right to dump electricity into the grid. During 28 of those quarter hour periods the negative prices spilled over to other parts of ERCOT.

Renewable energy projects are able to bid negative prices due to the substantial revenue streams they obtain from sources other than ERCOT. A close analogy exists in another renewable energy market, the burning of trash in incinerators to make electricity.

Some incinerators do not have a sufficient volume of trash to produce all of the electricity for which they might be under contractual obligation to produce. The incinerators at such time will buy fossil fuels, such as coal, oil, or natural gas. As much as possible, the incinerators will instead burn trash, charging the trash hauler a tipping fee. Thus, the incinerators will see their fuel cost go from positive to negative depending upon the abundance of trash.

The trash hauler is willing to pay the tipping fee to the incinerator as opposed to the higher cost of owning a sanitary land fill or paying a higher tipping feel at an independently owned land fill. The trash hauler would prefer to be paid by the incinerator for the fuel provided by the trash hauler, but is able to afford the tipping fee because the trash hauler has other sources of revenue in the form of pickup fees. Similarly, renewable energy projects would prefer to be paid for their electricity but can afford to pay for the right to dump their electricity onto ERCOT since they have other sources of revenue.

The migration of extreme electricity prices from one region to another region has been seen in the past. While the ERCOT example is the spread of low prices from the West market area to the rest of ERCOT, the West Coast of North America provided the opposite example in 2000/2001.

The high prices faced by California were passed on by the market to Oregon, Washington, and Canada. Consumers in that area responded, most famously by shutting down aluminum smelters to sell their electrical rights into the California market. This led to higher world prices of aluminum ingots and to higher electricity prices in Venezuela. The electricity supply agreements to the smelters in Venezuela had net back pricing, with the price of electricity determined by the price the smelters received for their ingots.

Related News

NRC Begins Special Inspection at River Bend Nuclear Power Plant

NRC Special Inspection at River Bend reviews failures of portable emergency diesel generators, nuclear safety measures, and Entergy Operations actions after Fukushima; off-site power loss readiness, remote COVID-19 oversight, and corrective action plans are assessed.


Key Points

An NRC review of generator test failures at River Bend, assessing nuclear safety, root causes, and corrective actions.

✅ Evaluates failures of portable emergency diesel generators

✅ Reviews causal analyses and adequacy of corrective actions

✅ Remote COVID-19 oversight; public report expected within 45 days


The Nuclear Regulatory Commission has begun a special inspection at the River Bend nuclear power plant, part of broader oversight that includes the Turkey Point renewal application, to review circumstances related to the failure of five portable emergency diesel generators during testing. The plant, operated by Entergy Operations, is located in St. Francisville, La., as nations like France outage risks continue to highlight broader reliability concerns.

The generators are used to supply power to plant systems in the event of a prolonged loss of off-site electrical power coupled with a failure of the permanently installed emergency generators, a concern underscored by incidents such as the SC nuclear plant leak that shut down production for weeks. These portable generators were acquired as part of the facility's safety enhancements mandated by the NRC following the 2011 accident at the Fukushima Dai-ichi facility in Japan, and amid constraints like France limiting output from warm rivers, the emphasis on resilience remains.

The three-member NRC team will develop a chronology of the test failures and evaluate the licensee's causal analyses and the adequacy of corrective actions, informed by lessons from cases like Davis-Besse closure stakes that underscore risk management.

Due to the COVID-19 pandemic, they will complete most of their work remotely, while other regions address constraints such as high river temperatures limiting output for nuclear stations. An inspection report documenting the team's findings, released as global nuclear project milestones continue across the sector, will be publicly available within 45 days of the end of the inspection.


Related News

View more

Electric cars will challenge state power grids

Electric Vehicle Grid Integration aligns EV charging with grid capacity using smart charging, time-of-use rates, V2G, and demand response to reduce peak load, enable renewable energy, and optimize infrastructure planning.


Key Points

Aligning EV charging with grid needs via smart charging, TOU pricing, and V2G to balance load and support renewables.

✅ Time-of-use rates shift charging to off-peak hours

✅ Smart charging responds to real-time grid signals

✅ V2G turns fleets into distributed energy storage


When Seattle City Light unveiled five new electric vehicle charging stations last month in an industrial neighborhood south of downtown, the electric utility wasn't just offering a new spot for drivers to fuel up. It also was creating a way for the service to figure out how much more power it might need as electric vehicles catch on.

Seattle aims to have nearly a third of its residents driving electric vehicles by 2030. Washington state is No. 3 in the nation in per capita adoption of plug-in cars, behind California and Hawaii. But as Washington and other states urge their residents to buy electric vehicles — a crucial component of efforts to reduce carbon emissions — they also need to make sure the electric grid can handle it amid an accelerating EV boom nationwide.

The average electric vehicle requires 30 kilowatt hours to travel 100 miles — the same amount of electricity an average American home uses each day to run appliances, computers, lights and heating and air conditioning.

An Energy Department study found that increased electrification across all sectors of the economy could boost national consumption by as much as 38 percent by 2050, in large part because of electric vehicles. The environmental benefit of electric cars depends on the electricity being generated by renewables.

So far, states predict they will be able to sufficiently boost power production. But whether electric vehicles will become an asset or a liability to the grid largely depends on when drivers charge their cars.

Electricity demand fluctuates throughout the day; demand is higher during daytime hours, peaking in the early evening. If many people buy electric vehicles and mostly try to charge right when they get home from work — as many now do — the system could get overloaded or force utilities to deliver more electricity than they are capable of producing.

In California, for example, the worry is not so much with the state’s overall power capacity, but rather with the ability to quickly ramp up production and maintain grid stability when demand is high, said Sandy Louey, media relations manager for the California Energy Commission, in an email. About 150,000 electric vehicles were sold in California in 2018 — 8 percent of all state car sales.

The state projects that electric vehicles will consume 5.4 percent of the state’s electricity, or 17,000 gigawatt hours, by 2030.

Responding to the growth in electric vehicles will present unique challenges for each state. A team of researchers from the University of Texas at Austin estimated the amount of electricity that would be required if every car on the road transitioned to electric. Wyoming, for instance, would need to nudge up its electricity production only 17 percent, while Maine would have to produce 55 percent more.

Efficiency Maine, a state trust that oversees energy efficiency and greenhouse gas reduction programs, offers rebates for the purchase of electric vehicles, part of state efforts to incentivize growth.

“We’re certainly mindful that if those projections are right, then there will need to be more supply,” said Michael Stoddard, the program’s executive director. “But it’s going to unfold over a period of the next 20 years. If we put our minds to it and plan for it, then we should be able to do it.”

A November report sponsored by the Energy Department found that there has been almost no increase in electricity demand nationwide over the past 10 years, while capacity has grown an average of 12 gigawatts per year (1 GW can power more than a half-million homes). That means energy production could climb at a similar rate and still meet even the most aggressive increase in electric vehicles, with proper planning.

Charging during off-peak hours would allow not only many electric vehicles to be added to the roads but also utilities to get more use out of power plants that run only during the limited peak times through improved grid coordination and flexible demand.

Seattle City Light and others are looking at various ways to promote charging during ideal times. One method is time-of-day rates. For the Seattle chargers unveiled last month, users will pay 31 cents per kilowatt hour during peak daytime hours and 17 cents during off-peak hours. The utility will monitor use at its charging stations to see how effective the rates are at shifting charging to more favorable times.

The utility also is working on a pilot program to study charging behavior at home. And it is partnering with customers such as King County Metro that are electrifying large vehicle fleets, including growing electric truck fleets that will demand significant power, to make sure they have both the infrastructure and charging patterns to integrate smoothly.

“Traditionally, our utility approach is to meet the load demand,” said Emeka Anyanwu, energy innovation and resources officer for Seattle City Light.

Instead, he said, the utility is working with customers to see whether they can use existing assets without the need for additional investment.

Numerous analysts say that approach is crucial.

“Even if there’s an overall increase in consumption, it really matters when that occurs,” said Sally Talberg, head of the Michigan Public Service Commission, which oversees the state’s utilities. “The encouragement of off-peak charging and other technology solutions that could come to bear could offset any negative impact.”

One of those solutions is smart charging, a system in which vehicles are plugged in but don’t charge until they receive a signal from the grid that demand has tapered off a sufficient amount. This is often paired with a lower rate for drivers who use it. Several smart-charging pilot programs are being conducted by utilities, although they have not yet been phased in widely, amid ongoing debates over charging control among manufacturers and utilities.

In many places, the increased electricity demand from electric vehicles is seen as a benefit to utilities and rate payers. In the Northwest, electricity consumption has remained relatively stagnant since 2000, despite robust population growth and development. That’s because increasing urbanization and building efficiency have driven down electricity needs.

Electric vehicles could help push electricity consumption closer to utilities’ capacity for production. That would bring in revenue for the providers, which would help defray the costs for maintaining that capacity, lowering rates for all customers.

“Having EV loads is welcome, because it’s environmentally cleaner and helps sustain revenues for utilities,” said Massoud Jourabchi, manager of economic analysis for the Northwest Power and Conservation Council, which develops power plans for the region.

Colorado also is working to promote electric cars, with the aim of putting 940,000 on the road by 2030. The state has adopted California’s zero-emission vehicles mandate, which requires automakers to reach certain market goals for their sales of cars that don’t burn fossil fuels, while extending tax credits for the purchase of such cars, investing in charging stations and electrifying state fleets.

Auto dealers have opposed the mandate, saying it infringes on consumer freedom.

“We think it should be a customer choice, a consumer choice and not a government mandate,” said Tim Jackson, president and chief executive of the Colorado Automobile Dealers Association.

Jackson also said that there’s not yet a strong consumer appetite for electric vehicles, meaning that manufacturers that fail to sell the mandated number of emission-free vehicles would be required to purchase credits, which he thinks would drive up the price of their other models.

Republicans in the state have registered similar concerns, saying electric vehicle adoption should take place based on market forces, not state intervention.

Many in the utility community are excited about the potential for electric cars to serve as mobile energy storage for the grid. Vehicle-to-grid technology, known as V2G, would allow cars charging during the day to take on surplus power from renewable energy sources.

Then, during peak demand times, electric vehicles would return some of that stored energy to the grid. As demand tapers off in the evening, the cars would be able to recharge.

In practice, V2G technology could be especially beneficial if used by heavy-duty fleets, such as school buses or utility vehicles. Those fleets would have substantial battery storage and long periods where they are idle, such as evenings and weekends — and even longer periods such as summer and the holiday season when school is out. The batteries on a bus, Jourabchi said, could store as much as 10 times the electricity needed to power a home for a day.


Related News

View more

Solar + Wind = 10% of US Electricity Generation in 1st Half of 2018

US Electricity Generation H1 2018 saw wind and solar gains but hydro declines, as natural gas led the grid mix and coal fell; renewables' share, GWh, emissions, and capacity additions shaped the power sector.


Key Points

It is the H1 2018 US power mix, where natural gas led, coal declined, and wind and solar grew while hydro fell.

✅ Natural gas reached 32% of generation, highest share

✅ Coal fell; renewables roughly tied nuclear at ~20%

✅ Wind and solar up; hydro output down vs 2017


To complement our revival of US electricity capacity reports, here’s a revival of our reports on US electricity generation.

As with the fresh new capacity report, things are not looking too bright when it comes to electricity generation. There’s still a lot of grey — in the bar charts below, in the skies near fossil fuel power plants, and in the human and planetary outlook based on how slowly we are cutting fossil fuel electricity generation.

As you can see in the charts above, wind and solar energy generation increased notably from the first half of 2017 to the first half of 2018, and the EIA expected larger summer solar and wind generation in subsequent months, reinforcing that momentum.

A large positive when it comes to the environment and human health is that coal generation dropped a great deal year over year — by even more than renewables increased, though the EIA later noted an increase in coal-fired generation in a subsequent year, complicating the trend. However, on the down side, natural gas soared as it became the #1 source of electricity generation in the United States (32% of US electricity). Furthermore, coal was still solidly in the #2 position (27% of US electricity). Renewables and nuclear were essentially in a tie at 19.8% of generation, with renewables just a tad above nuclear.

Actually, combined with an increase in nuclear power generation, natural gas electricity production increased so much that the renewable energy share of electricity generation actually dropped in the first half of 2018 versus the first half of 2017, even amid declining electricity use in some periods. It was 19.8% this year and 20% last year.

Again, solar and wind saw a significant growth in its market share, from 9% to 9.9%, but hydro brought the whole category down due to a decrease from 9% to 8%.

The visuals above are probably the best way to examine it all. The H1 2018 chart was still dominated by fossil fuels, which together accounted for approximately 60% of electricity generation, even though by 2021 non-fossil sources supplied about 40% of U.S. electricity, highlighting the longer-term shift. In H1 2017, the figure was 59.7%. Furthermore, if you switch to the “Change H1 2018 vs H1 2017 (GWh)” chart, you can watch a giant grey bar representing natural gas take over the top of the chart. It almost looks like it’s part of the border of the chart. The biggest glimmer of positivity in that chart is seeing the decline in coal at the bottom.

What will the second half of the year bring? Well, the gigantic US electricity generation market shifts slowly, even as monthly figures can swing, as January generation jumped 9.3% year over year according to the EIA, reminding us about volatility. There is so much base capacity, and power plants last so long, that it takes a special kind of magic to create a rapid transition to renewable energy. As you know from reading this quarter’s US renewable energy capacity report, only 43% of new US power capacity in the first half of the year was from renewables. The majority of it was from natural gas. Along with other portions of the calculation, that means that electricity generation from natural gas is likely to increase more than electricity generation from renewables.

Jump into the numbers below and let us know if you have any more thoughts.


Related News

View more

Hydro-Quebec adopts a corporate structure designed to optimize the energy transition

Hydro-Québec Unified Corporate Structure advances the energy transition through integrated planning, strategy, infrastructure delivery, and customer operations, aligning generation, transmission, and distribution while ensuring non-discriminatory grid access and agile governance across assets and behind-the-meter technologies.


Key Points

A cross-functional model aligning strategy, planning, and operations to accelerate Quebec's low-carbon transition.

✅ Four groups: strategy, planning, infrastructure, operations.

✅ Ensures non-discriminatory transmission access compliance.

✅ No staff reductions; staged implementation from Feb 28.


As Hydro-Que9bec prepares to play a key role in the transition to a low-carbon economy, the complexity of the work to be done in the coming decade requires that it develop a global vision of its operations and assets, from the drop of water entering its turbines to the behind-the-meter technologies marketed by its subsidiary Hilo. This has prompted the company to implement a new corporate structure that will maximize cooperation and agility, including employee-led pandemic support that builds community trust, making it possible to bring about the energy transition efficiently with a view to supporting the realization of Quebecers’ collective aspirations.

Toward a single, unified Hydro

Hydro-Québec’s core mission revolves around four major functions that make up the company’s value chain, alongside policy choices like peak-rate relief during emergencies. These functions consist of:

  1. Developing corporate strategies based on current and future challenges and business opportunities
  2. Planning energy needs and effectively allocating financial capital, factoring in pandemic-related revenue impacts on demand and investment timing
  3. Designing and building the energy system’s multiple components
  4. Operating assets in an integrated fashion and providing the best customer experience by addressing customer choice and flexibility expectations across segments.

Accordingly, Hydro-Québec will henceforth comprise four groups respectively in charge of strategy and development; integrated energy needs planning; infrastructure and the energy system; and operations and customer experience, including billing accuracy concerns that can influence satisfaction. To enable the company to carry out its mission, these groups will be able to count on the support of other groups responsible for corporate functions.

Across Canada, leadership changes at other utilities highlight the need to rebuild ties with governments and investors, as seen with Hydro One's new CEO in Ontario.

“For over 20 years, Hydro-Québec has been operating in a vertical structure based on its main activities, namely power generation, transmission and distribution. This approach must now give way to one that provides a cross-functional perspective allowing us to take informed decisions in light of all our needs, as well as those of our customers and the society we have the privilege to serve,” explained Hydro-Québec’s President and Chief Executive Officer, Sophie Brochu.

In terms of gender parity, the management team continues to include several men and women, thus ensuring a diversity of viewpoints.

Hydro-Québec’s new structure complies with the regulatory requirements of the North American power markets, in particular with regard to the need to provide third parties with non-discriminatory access to the company’s transmission system. The frameworks in place ensure that certain functions remain separate and help coordinate responses to operational events such as urban distribution outages that challenge continuity of service.

These changes, which will be implemented gradually as of Monday, February 28, do not aim to achieve any staff reductions.


Related News

View more

Global oil demand to decline in 2020 as Coronavirus weighs heavily on markets

COVID-19 Impact on Global Oil Demand 2020 signals an IEA forecast of declining consumption as travel restrictions curb transport fuels, disrupt energy markets, and shift OPEC and non-OPEC supply dynamics amid economic slowdown.


Key Points

IEA sees first demand drop since 2009 as COVID-19 curbs travel, weakening transport fuels and unsettling energy markets.

✅ IEA base case: 2020 demand at 99.9 mb/d, down 90 kb/d from 2019.

✅ Travel restrictions hit transport fuels; China drives the decline.

✅ Scenarios: low -730 kb/d; high +480 kb/d in 2020.


Global oil demand is expected to decline in 2020 as the impact of the new coronavirus (COVID-19) spreads around the world, constricting travel and broader economic activity, according to the International Energy Agency’s latest oil market forecast.

The situation remains fluid, creating an extraordinary degree of uncertainty over what the full global impact of the virus will be. In the IEA’s central base case, even as global CO2 emissions flatlined in 2019 according to the IEA, demand this year drops for the first time since 2009 because of the deep contraction in oil consumption in China, and major disruptions to global travel and trade.

“The coronavirus crisis is affecting a wide range of energy markets – including coal-fired electricity generation, gas and renewables – but its impact on oil markets is particularly severe because it is stopping people and goods from moving around, dealing a heavy blow to demand for transport fuels,” said Dr Fatih Birol, the IEA’s Executive Director. “This is especially true in China, the largest energy consumer in the world, which accounted for more than 80% of global oil demand growth last year. While the repercussions of the virus are spreading to other parts of the world, what happens in China will have major implications for global energy and oil markets.”

The IEA now sees global oil demand at 99.9 million barrels a day in 2020, down around 90,000 barrels a day from 2019. This is a sharp downgrade from the IEA’s forecast in February, which predicted global oil demand would grow by 825,000 barrels a day in 2020.

The short-term outlook for the oil market will ultimately depend on how quickly governments move to contain the coronavirus outbreak, how successful their efforts are, and what lingering impact the global health crisis has on economic activity.

To account for the extreme uncertainty facing energy markets, the IEA has developed two other scenarios for how global oil demand could evolve this year. In a more pessimistic low case, global measures fail to contain the virus, and global demand falls by 730,000 barrels a day in 2020. In a more optimistic high case, the virus is contained quickly around the world, and global demand grows by 480,000 barrels a day.

“We are following the situation extremely closely and will provide regular updates to our forecasts as the picture becomes clearer,” Dr Birol said. “The impact of the coronavirus on oil markets may be temporary. But the longer-term challenges facing the world’s suppliers are not going to go away, especially those heavily dependent on oil and gas revenues. As the IEA has repeatedly said, these producer countries need more dynamic and diversified economies in order to navigate the multiple uncertainties that we see today.”

The IEA also published its medium-term outlook examining the key issues in global demand, supply, refining and trade to 2025, as well as the trajectory of the global energy transition now shaping markets. Following a contraction in 2020 and an expected sharp rebound in 2021, yearly growth in global oil demand is set to slow as consumption of transport fuels grows more slowly and as national net-zero pathways, with Canada needing more electricity to reach net-zero influencing power demand, according to the report. Between 2019 and 2025, global oil demand is expected to grow at an average annual rate of just below 1 million barrels a day. Over the period as whole, demand rises by a total of 5.7 million barrels a day, with China and India accounting for about half of the growth.

At the same time, the world’s oil production capacity is expected to rise by 5.9 million barrels a day, with more than three-quarters of it coming from non-OPEC producers, the report forecasts. But production growth in the United States and other non-OPEC countries is set to lose momentum after 2022, amid shifts in Wall Street's energy strategy linked to policy signals, allowing OPEC producers from the Middle East to turn the taps back up to help keep the global oil market in balance.

The medium-term market report, Oil 2020, also considers the impact of clean energy transitions on oil market trends. Demand growth for gasoline and diesel between 2019 and 2025 is forecast to weaken as countries around the world implement policies to improve efficiency and cut carbon dioxide emissions – and as solar power becomes the cheapest electricity in many markets and electric vehicles increase in popularity. The impact of energy transitions on oil supply remains unclear, with many companies prioritising short-cycle projects for the coming years.

“The coronavirus crisis is adding to the uncertainties the global oil industry faces as it contemplates new investments and business strategies,” Dr Birol said. “The pressures on companies are changing, with European oil majors turning electric to diversify. They need to show that they can deliver not just the energy that economies rely on, but also the emissions reductions that the world needs to help tackle our climate challenge.”


Related News

View more

Wind Power Surges in U.S. Electricity Mix

U.S. Wind Power 2025 drives record capacity additions, with FERC data showing robust renewable energy growth, IRA incentives, onshore and offshore projects, utility-scale generation, grid integration, and manufacturing investment boosting clean electricity across key states.


Key Points

Overview of record wind additions, IRA incentives, and grid expansion defining the U.S. clean electricity mix in 2025.

✅ FERC: 30.1% of new U.S. capacity in Jan 2025 from wind

✅ Major projects: Cedar Springs IV, Boswell, Prosperity, Golden Hills

✅ IRA incentives drive onshore, offshore builds and manufacturing


In early 2025, wind power has significantly strengthened its position in the United States' electricity generation portfolio. According to data from the Federal Energy Regulatory Commission (FERC), wind energy accounted for 30.1% of the new electricity capacity added in January 2025, and as the most-used renewable source in the U.S., it also surpassed the previous record set in 2024. This growth is attributed to substantial projects such as the 390.4 MW Cedar Springs Wind IV and the 330.0 MW Boswell Wind Farm in Wyoming, along with the 300.0 MW Prosperity Wind Farm in Illinois and the 201.0 MW Golden Hills Wind Farm Expansion in Oregon. 

The expansion of wind energy capacity is part of a broader trend where solar and wind together accounted for over 98% of the new electricity generation capacity added in the U.S. in January 2025. This surge is further supported by the federal government's Inflation Reduction Act (IRA) and broader policy support for renewables, which has bolstered incentives for renewable energy projects, leading to increased investments and the establishment of new manufacturing facilities. 

By April 2025, clean electricity sources, including wind and solar, were projected to surpass 51% of total utility-scale electricity generation in the U.S., building on a 25.5% renewable share seen in recent data, marking a significant milestone in the nation's energy transition. This achievement is attributed to a combination of factors: a seasonal drop in electricity demand during the spring shoulder season, increased wind speeds in key areas like Texas, and higher solar production due to longer daylight hours and expanded capacity in states such as California, Arizona, and Nevada, supported by record installations across the solar and storage industry. 

Despite a 7% decline in wind power production in early April compared to the same period in 2024—primarily due to weaker wind speeds in regions like Texas—the overall contribution of wind energy remained robust, supported by an 82% clean-energy pipeline that includes wind, solar, and batteries. This resilience underscores the growing reliability of wind power as a cornerstone of the U.S. electricity mix. 

Looking ahead, the U.S. Department of Energy projects that wind energy capacity will continue to grow, with expectations of adding between 7.3 GW and 9.9 GW in 2024, and potentially increasing to 14.5 GW to 24.8 GW by 2028. This growth is anticipated to be driven by both onshore and offshore wind projects, with onshore wind representing the majority of new additions, continuing a trajectory since surpassing hydro capacity in 2016 in the U.S.

Early 2025 has witnessed a notable increase in wind power's share of the U.S. electricity generation mix. This trend reflects the nation's ongoing commitment to expanding renewable energy sources, especially after renewables surpassed coal in 2022, supported by favorable policies and technological advancements. As the U.S. continues to invest in and develop wind energy infrastructure, the role of wind power in achieving a cleaner and more sustainable energy future becomes increasingly pivotal.


Related News

View more

Sign Up for Electricity Forum’s Newsletter

Stay informed with our FREE Newsletter — get the latest news, breakthrough technologies, and expert insights, delivered straight to your inbox.

Electricity Today T&D Magazine Subscribe for FREE

Stay informed with the latest T&D policies and technologies.
  • Timely insights from industry experts
  • Practical solutions T&D engineers
  • Free access to every issue

Live Online & In-person Group Training

Advantages To Instructor-Led Training – Instructor-Led Course, Customized Training, Multiple Locations, Economical, CEU Credits, Course Discounts.

Request For Quotation

Whether you would prefer Live Online or In-Person instruction, our electrical training courses can be tailored to meet your company's specific requirements and delivered to your employees in one location or at various locations.