U.S. demand for residential solar rising

By Reuters


NFPA 70b Training - Electrical Maintenance

Our customized live online or in‑person group training can be delivered to your staff at your location.

  • Live Online
  • 12 hours Instructor-led
  • Group Training Available
Regular Price:
$599
Coupon Price:
$499
Reserve Your Seat Today
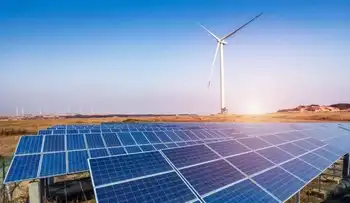
U.S. demand for residential solar power installations is surging despite an economic recession, thanks to government financial incentives, some easing in credit availability, and increasing public recognition of its environmental benefits, industry executives said.

Companies represented at the PV America solar conference in Philadelphia said the volume of their installations as much as tripled in 2008 and they see further gains this year as more people recognize that they can cut their electricity bills by at least 15 percent with an array of solar panels installed on the roof of their homes.

Geogenix LLC, a New Jersey-based residential solar company with 20 employees, installed about 150 systems in the first six years of its existence until 2008, and expects to do about that number this year alone, said managing member Gaurav Naik. He predicted the company would install at least 300 systems in 2010 when it plans to expand into Pennsylvania and some surrounding states.

"There is unprecedented demand for residential solar systems," he said.

Faced with a cost of about $50,000 for installation of a 7-kilowatt system on a typical 2,500-square-foot house, a New Jersey homeowner can defray the expense with a $12,500 rebate from the state and a federal tax credit of $11,000, Naik said.

After the first year, the homeowner can also expect a refund check for about $3,200 from the local utility in return for installing the solar panels, Naik said. The owner can expect to save about $1,700 a year in electricity bills, and should recoup the initial investment within five to eight years, he said.

According to industry trade group the Solar Energy Industries Association, there was an overall 16 percent increase in solar capacity, including commercial installations, in 2008.

Jeffrey Wolfe, chief executive of Vermont-based installer groSolar, said the market has also been boosted by lower prices for solar panels due in part to an increase in the supply of the polysilicon, the raw material used for their construction.

Wolfe argued the industry is benefiting from a cultural change that is more accepting of the need to find alternatives to fossil fuels, in part because of last year's surge in gasoline prices to more than $4 a gallon.

"People have seen what energy prices can do, and they have come to the end of their rope in denying climate change," Wolfe said.

Companies are also getting creative in bringing the upfront costs of solar power down for customers. groSolar, for one, is providing financing to customers who are unable to front the $40,000-$50,000 price tag for a typical solar installation. Wolfe's company now operates a lease program requiring a down payment of $1,000 and then regular monthly payments for use of the system.

In California, Arizona and Oregon, SolarCity installs systems without any down payment from the customer, who then pays a lease fee which typically ranges from $25 to $60 a month, said David Arfin, vice president of customer financing. The company owns and maintains the system but the homeowner benefits from the reduced utility bills, he said.

Arfin said the company's business tripled in 2008, and it is hiring 100 new installers to help meet "massive" demand.

Naik of Geogenix said financing for solar installations has gotten easier for qualified borrowers since the first quarter of 2009. He cited one client with a high 740 credit score who needed to borrow $38,000 and secured a 10-year loan at prime plus 2 percent by working with a financial institution that had previously done business with the company.

Related News

Told "no" 37 times, this Indigenous-owned company brought electricity to James Bay anyway

Five Nations Energy Transmission Line connects remote First Nations to the Ontario power grid, delivering clean, reliable electricity to Western James Bay through Indigenous-owned transmission infrastructure, replacing diesel generators and enabling sustainable community growth.


Key Points

An Indigenous-owned grid link providing reliable power to Western James Bay First Nations, replacing polluting diesel.

✅ Built by five First Nations; fully Indigenous-owned utility

✅ 270 km line connecting remote James Bay communities

✅ Ended diesel dependence; enabled sustainable development


For the Indigenous communities along northern Ontario’s James Bay — the ones that have lived on and taken care of the lands as long as anyone can remember — the new millenium marked the start of a diesel-less future, even as Ontario’s electricity outlook raised concerns about getting dirtier in policy debates. 

While the southern part of the province took Ontario’s power grid for granted, despite lessons from Europe’s power crisis about reliability, the vast majority of these communities had never been plugged in. Their only source of power was a handful of very loud diesel-powered generators. Because of that, daily life in the Attawapiskat, Kashechewan and Fort Albany First Nations involved deliberating a series of tradeoffs. Could you listen to the radio while toasting a piece of bread? How many Christmas lights could you connect before nothing else was usable? Was there enough power to open a new school? 

The communities wanted a safe, reliable, clean alternative, with Manitoba’s clean energy illustrating regional potential, too. So did their chiefs, which is why they passed a resolution in 1996 to connect the area to Ontario’s grid, not just for basic necessities but to facilitate growth and development, and improve their communities’ quality of life. 

The idea was unthinkable at the time — scorned and dismissed by those who held the keys to Ontario’s (electrical) power, much like independent power projects can be in other jurisdictions. Even some in the community didn’t fully understand it. When the idea was first proposed at a gathering of Nishnawbe Aski Nation, which represents 49 First Nations, one attendee said the only way he could picture the connection was as “a little extension cord running through the bush from Moosonee.” 

But the leadership of Attawapiskat, Kashechewan and Fort Albany First Nations had been dreaming and planning. In 1997, along with members of Taykwa Tagamou and Moose Cree First Nations, they created the first, and thus far only, fully Indigenous-owned energy company in Canada: Five Nations Energy Inc., as partnerships like an OPG First Nation hydro project would later show in action, too. 

Over the next five years, the organization built Omushkego Ishkotayo, the Cree name for the Western James Bay transmission line: “Omushkego” refers to the Swampy Cree people, and “Ishkotayo” to hydroelectric power, while other regions were commissioning new BC generating stations in parallel. The 270-kilometre-long transmission line is in one of the most isolated regions of Ontario, one that can only be accessed by plane, except for a few months in winter when ice roads are strong enough to drive on. The project went online in 2001, bringing reliable power to over 7,000 people who were previously underserved by the province’s energy providers. It also, somewhat controversially, enabled Ontario’s first diamond mine in Attawapiskat territory.

The future the First Nations created 25 years ago is blissfully quiet, now that the diesel generators are shut off. “When the power went on, you could hear the birds,” Patrick Chilton, the CEO of Five Nations Energy, said with a smile. “Our communities were glowing.”

Power, politics and money: Five Nations Energy needed government, banks and builders on board
Chilton took over in 2013 after the former CEO, his brother Ed, passed away. “This was all his idea,” Chilton told The Narwhal in a conversation over Zoom from his office in Timmins, Ont. The company’s story has never been told before in full, he said, because he felt “vulnerable” to the forces that fought against Omushkego Ishkotayo or didn’t understand it, a dynamic underscored by Canada’s looming power problem reporting in recent years. 

The success of Five Nations Energy is a tale of unwavering determination and imagination, Chilton said, and it started with his older brother. “Ed was the first person who believed a transmission line was possible,” he said.

In a Timmins Daily Press death notice published July 2, 2013, Ed Chilton is described as having “a quiet but profound impact on the establishment of agreements and enterprises benefitting First Nations peoples and their lands.” Chilton doesn’t describe him that way, exactly. 

“If you knew my brother, he was very stubborn,” he said. A certified engineering technologist, Ed was a visionary whose whole life was defined by the transmission line. He was the first to approach the chiefs with the idea, the first to reach out to energy companies and government officials and the one who persuaded thousands of people in remote, underserved communities that it was possible to bring power to their region.

After that 1996 meeting of Nishnawbe Aski Nation, there came a four-year-long effort to convince the rest of Ontario, and the country, the project was possible and financially viable. The chiefs of the five First Nations took their idea to the halls of power: Queen’s Park, Parliament Hill and the provincial power distributor Hydro One (then Ontario Hydro). 

“All of them said no,” Chilton said. “They saw it as near to impossible — the idea that you could build a transmission line in the ‘swamp,’ as they called it.” The Five Nations Energy team kept a document at the time tracking how many times they heard no; it topped out at 37. 

One of the worst times was in 1998, at a meeting on the 19th floor of the Ontario Hydro building in the heart of downtown Toronto. There, despite all their preparation and planning, a senior member of the Ontario Hydro team told Chilton, Martin and other chiefs “you’ll build that line over my dead body,” Chilton recalled. 

At the time, Chilton said, Ontario Hydro was refusing to cooperate: unwilling to let go of its monopoly over transmission lines, but also saying it was unable to connect new houses in the First Nations to diesel generators it said were at maximum capacity. (Ontario Hydro no longer exists; Hydro One declined to comment.)

“There’s always naysayers no matter what you’re doing,” Martin said. “What we were doing had never been done before. So of course people were telling us how we had never managed something of this size or a budget of this size.” 

“[Our people] basically told them to blow it up your ass. We can do it,” Chilton said.

So the chiefs of the five nations did something they’d never done before: they went to all of the big banks and many, many charitable foundations trying to get the money, a big ask for a project of this scale, in this location. Without outside support, their pitch was that they’d build it themselves.

This was the hardest part of the process, said Lawrence Martin, the former Grand Chief of Mushkegowuk Tribal Council and a member of the Five Nations Energy board. “We didn’t know how to finance something like this, to get loans,” he told The Narwhal. “That was the toughest task for all of us to achieve.”

Eventually, they got nearly $50 million in funding from a series of financial organizations including the Bank of Montreal, Pacific and Western Capital, the Northern Ontario Heritage Fund Corporation (an Ontario government agency) and the engineering and construction company SNC Lavalin, which did an assessment of the area and deemed the project viable. 

And in 1999, Ed Chilton, other members of the Chilton family and the chiefs were able to secure an agreement with Ontario Hydro that would allow them to buy electricity from the province and sell it to their communities. 


Related News

View more

Renewable power surpasses fossil fuels for first time in Europe

EU Renewable Power Overtakes Fossil Fuels, reflecting a greener energy mix as wind, solar, and hydro expand, cutting CO2 emissions and curbing coal while negative prices rise amid pandemic-driven demand drops.


Key Points

A milestone as renewables surpass fossil power in the EU, driven by wind, solar, hydro growth and pandemic demand.

✅ 40% renewables vs 34% fossil in H1 across 27 EU states

✅ Wind, solar, hydro rose; coal generation fell 32% year-on-year

✅ Lower demand, carbon prices, grid priority boosted clean output


Renewable power for the first time contributed a bigger share in the European generation mix than fossil fuels, as described in Europe's green surge as the fallout from the pandemic cut energy demand.

About 40 percent of the electricity in the first half in the 27 EU countries came from renewable sources, exceeding the global renewables share reported elsewhere, compared with 34 percent from plants burning fossil fuels, according to environmental group Ember in London. As a result, carbon dioxide emissions from the power sector fell 23 percent.

The rise is significant and encouraging for law makers as Europe prepares to spend billions of euros to recover from the virus, with wind power investments underscoring the momentum, and set the bloc on track to neutralize its carbon footprint by the middle of the century.

“This marks a symbolic moment ​in the transition of Europe’s electricity sector,” said Dave Jones, an electricity analyst at Ember. “For countries like Poland and Czech Republic grappling with how to get off coal, there is now a clear way out.”

While power demand slumped, output from wind and solar farms increased, reflecting global wind and solar gains, because more plants came online in breezy and sunny weather. At the same time, wet conditions boosted hydro power in Iberia and the Nordic markets.

Those conditions helped renewables become a rare bright spot throughout the economic tumult this year. In many areas, renewable sources of electricity have priority to the grid, meaning they could keep growing even as demand shrank and other power plants were turned off.

Electricity demand in the EU fell 7 percent overall. Fossil-fuel power generation plunged 18 percent in the first half compared with a year earlier. Renewable generation grew by 11 percent, according to Ember.

Coal was by far the biggest loser in 2020. It’s one of the most-polluting sources of power and its share is slumping in Europe as the price of carbon increases, with renewables surpassing coal in the US illustrating the broader shift, and governments move to cut emissions. Power from coal fell 32 percent across the EU.

Despite the economics, the decision to shut off coal for good will come down to political agreements between producers and governments, while reducing reliance on Russian energy reshapes policy debates.

One consequence of the jump in renewables is that negative prices have increased, as solar is reshaping prices in Northern Europe in similar ways. On particularly windy or sunny days when there isn’t much demand, the grid can be flooded with power. That’s leading wind farms to be shut off and customers to be paid to consume electricity.


Related News

View more

Which of the cleaner states imports dirty electricity?

Hourly Electricity Emissions Tracking maps grid balancing areas, embodied emissions, and imports/exports, revealing carbon intensity shifts across PJM, ERCOT, and California ISO, and clarifying renewable energy versus coal impacts on health and climate.


Key Points

An hourly method tracing generation, flows, and embodied emissions to quantify carbon intensity across US balancing areas.

✅ Hourly traces of imports/exports and generation mix

✅ Consumption-based carbon intensity by balancing area

✅ Policy insights for renewables, coal, health costs


In the United States, electricity generation accounts for nearly 30% of our carbon emissions. Some states have responded to that by setting aggressive renewable energy standards; others are hoping to see coal propped up even as its economics get worse. Complicating matters further is the fact that many regional grids are integrated, and as America goes electric the stakes grow, meaning power generated in one location may be exported and used in a different state entirely.

Tracking these electricity exports is critical for understanding how to lower our national carbon emissions. In addition, power from a dirty source like coal has health and environment impacts where it's produced, and the costs of these aren't always paid by the parties using the electricity. Unfortunately, getting reliable figures on how electricity is produced and where it's used is challenging, even for consumers trying to find where their electricity comes from in the first place, leaving some of the best estimates with a time resolution of only a month.

Now, three Stanford researchers—Jacques A. de Chalendar, John Taggart, and Sally M. Benson—have greatly improved on that standard, and they have managed to track power generation and use on an hourly basis. The researchers found that, of the 66 grid balancing areas within the United States, only three have carbon emissions equivalent to our national average, and they have found that imports and exports of electricity have both seasonal and daily changes. de Chalendar et al. discovered that the net results can be substantial, with imported electricity increasing California's emissions/power by 20%.

Hour by hour
To figure out the US energy trading landscape, the researchers obtained 2016 data for grid features called balancing areas. The continental US has 66 of these, providing much better spatial resolution on the data than the larger grid subdivisions. This doesn't cover everything—several balancing areas in Canada and Mexico are tied in to the US grid—and some of these balancing areas are much larger than others. The PJM grid, serving Pennsylvania, New Jersey, and Maryland, for example, is more than twice as large as Texas' ERCOT, in a state that produces and consumes the most electricity in the US.

Despite these limitations, it's possible to get hourly figures on how much electricity was generated, what was used to produce it, and whether it was used locally or exported to another balancing area. Information on the generating sources allowed the researchers to attach an emissions figure to each unit of electricity produced. Coal, for example, produces double the emissions of natural gas, which in turn produces more than an order of magnitude more carbon dioxide than the manufacturing of solar, wind, or hydro facilities. These figures were turned into what the authors call "embodied emissions" that can be traced to where they're eventually used.

Similar figures were also generated for sulfur dioxide and nitrogen oxides. Released by the burning of fossil fuels, these can both influence the global climate and produce local health problems.

Huge variation
The results were striking. "The consumption-based carbon intensity of electricity varies by almost an order of magnitude across the different regions in the US electricity system," the authors conclude. The low is the Bonneville Power grid region, which is largely supplied by hydropower; it has typical emissions below 100kg of carbon dioxide per megawatt-hour. The highest emissions come in the Ohio Valley Electric region, where emissions clear 900kg/MW-hr. Only three regional grids match the overall grid emissions intensity, although that includes the very large PJM (where capacity auction payouts recently fell), ERCOT, and Southern Co balancing areas.

Most of the low-emissions power that's exported comes from the Pacific Northwest's abundant hydropower, while the Rocky Mountains area exports electricity with the highest associated emissions. That leads to some striking asymmetries. Local generation in the hydro-rich Idaho Power Company has embodied emissions of only 71kg/MW-hr, while its imports, coming primarily from Rocky Mountain states, have a carbon content of 625kg/MW-hr.

The reliance on hydropower also makes the asymmetry seasonal. Local generation is highest in the spring as snow melts, but imports become a larger source outside this time of year. As solar and wind can also have pronounced seasonal shifts, similar changes will likely be seen as these become larger contributors to many of these regional grids. Similar things occur daily, as both demand and solar production (and, to a lesser extent, wind) have distinct daily profiles.

The Golden State
California's CISO provides another instructive case. Imports represent less than 30% of its total electric use in 2016, yet California electricity imports provided 40% of its embodied emissions. Some of these, however, come internally from California, provided by the Los Angeles Department of Water and Power. The state itself, however, has only had limited tracking of imported emissions, lumping many of its sources as "other," and has been exporting its energy policies to Western states in ways that shape regional markets.

Overall, the 2016 inventory provides a narrow picture of the US grid, as plenty of trends are rapidly changing our country's emissions profile, including the rise of renewables and the widespread adoption of efficiency measures and other utility trends in 2017 that continue to evolve. The method developed here can, however, allow for annual updates, providing us with a much better picture of trends. That could be quite valuable to track things like how the rapid rise in solar power is altering the daily production of clean power.

More significantly, it provides a basis for more informed policymaking. States that wish to promote low-emissions power can use the information here to either alter the source of their imports or to encourage the sites where they're produced to adopt more renewable power. And those states that are exporting electricity produced primarily through fossil fuels could ensure that the locations where the power is used pay a price that includes the health costs of its production.


Related News

View more

Alberta Introduces New Electricity Rules

Alberta Rate of Last Resort streamlines electricity regulations to stabilize the default rate, curb price volatility, and protect rural communities, low-income households, and seniors while preserving competition in the province's energy market.


Key Points

Alberta's Rate of Last Resort sets biennial default electricity prices, curbing volatility and protecting customers.

✅ Biennial default rate to limit price spikes

✅ Focus on rural, senior, and low-income customers

✅ Encourages competitive contracts and market stability


The Alberta government is overhauling its electricity regulations as part of a market overhaul aimed at reducing spikes in electricity prices for consumers and businesses. The new rules, set to be introduced this spring, are intended to stabilize the default electricity rate paid by many Albertans.


Background on the Rate of Last Resort

Albertans currently have the option to sign up for competitive contracts with electricity providers. These contracts can sometimes offer lower rates than the default electricity rate, officially known as the Regulated Rate Option (RRO). However, these competitive rates can fluctuate significantly. Currently, those unable to secure these contracts or those who are on the default rate are experiencing rising electricity prices and high levels of price volatility.

To address this, the Alberta government is renaming the default rate as the Rate of Last Resort designation (RoLR) under the new framework. This aims to reduce the sense of security that some consumers might associate with the current name, which the government feels is misleading.


Key Changes Under New Regulations

The new regulations, which include proposed market changes that affect pricing, focus on:

  • Price Stabilization: Default electricity rates will be set every two years for each utility provider, providing greater predictability by enabling a consumer price cap and reducing the potential for extreme price swings.
  • Rural and Underserved Communities: The changes are intended to particularly benefit rural Albertans and those on the default rate, including low-income individuals and seniors. These groups often lack access to the competitive rates offered by some providers and have been disproportionately affected by recent price increases.
  • Promoting Economic Stability: The goal is to lower the cost of utilities for all Albertans, leading to overall lower costs of living and doing business. The government anticipates these changes will create a more attractive environment for investment and job creation.


Opposition Views

Critics argue that limiting the flexibility of prices for the default electricity rate could interfere with market dynamics and stifle market competition among providers. Some worry it could ultimately lead to higher prices in the long term. Others advocate directly subsidizing low-income households rather than introducing broad price controls.


Balancing Affordability and the Market

The Alberta government maintains that the proposed changes will strike a balance between ensuring affordable electricity for vulnerable Albertans and preserving a competitive energy market. Provincial officials emphasize that the new regulations should not deter consumers from seeking out competitive rates if they choose to.


The Path Ahead

The new electricity regulations are part of the Alberta government's broader Affordable Utilities Program, alongside electricity policy changes across the province. The legislation is expected to be introduced and debated in the provincial legislature this spring with the potential of coming into effect later in the year. Experts expect these changes will significantly impact the Alberta electricity market and ignite further discussion about how best to manage rising utility costs for consumers and businesses.


Related News

View more

Europeans push back from Russian oil and gas

EU Renewable Energy Transition is accelerating under REPowerEU, as wind and solar generation hit records, improving energy security, efficiency, and decarbonization while reducing reliance on Russian fossil fuels across the EU grid.


Key Points

EU shift to wind and solar under REPowerEU to cut fossil fuels, boost efficiency, and secure energy supply.

✅ Wind and solar set record 22% of EU electricity in 2022

✅ REPowerEU targets over 40% renewables and 15% lower demand by 2030

✅ Diversifies away from Russian fuels; partners with US and Norway


Europe is producing all-time highs of wind and solar energy as the 27-country group works to reduce its reliance on fossil fuels from Russia, a shift underscored by Europe's green surge across the bloc.

Four months after Vladimir Putin’s full-scale invasion of Ukraine in February 2022, the European Commission launched REPowerEU. This campaign aims to:

  • Boost the use of renewable energy.
  • Reduce overall energy consumption.
  • Diversify energy sources.

EU countries were already moving toward renewable energy, but Russia’s war against Ukraine accelerated that trend. In 2022, for the first time, renewables surpassed fossil fuels and wind and solar power surpassed gas as a source of electricity. Wind and solar provided a record-breaking 22% of EU countries’ electrical supply, according to London-based energy think tank Ember.

“We have to double down on investments in home-grown renewables,” European Commission President Ursula von der Leyen said in October 2022. “Not only for the climate but also because the transition to the clean energy is the best way to gain independence and to have security of energy supply.”

Across the continent, growth in solar generation rose by 25% in 2022, according to Ember, as solar reshapes electricity prices in Northern Europe. Twenty EU countries produced their highest share of solar power in 2022. In October, Greece ran entirely on renewables for several hours and is seven years ahead of schedule for its 2030 solar capacity target.

Meanwhile, Ireland's green electricity target aims to make more than a third of its power supply renewable within four years.

By 2030, RePowerEU aims to provide more than 40% of the EU’s total power from renewables, aligning with global renewable records being shattered worldwide.

To meet the European Commission’s goal to cut EU energy usage by 15%, people and governments changed their habits and became more energy-efficient, while Germany's solar power boost helped bolster supply. Among their actions:

  • Germany turned down the heat in public buildings and lowered the cost of train tickets to reduce car usage, as clean energy hit 50% in Germany during this period.
  • Spain ordered stores and public buildings to turn off their lights at night.
  • France dimmed the Eiffel Tower and reduced city speed limits.

For the oil and gas that the EU still needed to import, countries turned to partners such as Norway and the United States.


Related News

View more

Ottawa making electricity more expensive for Albertans

Alberta Electricity Price Surge reflects soaring wholesale rates, natural gas spikes, carbon tax pressures, and grid decarbonization challenges amid cold-weather demand, constrained supply, and Europe-style energy crisis impacts across the province.


Key Points

An exceptional jump in Alberta's power costs driven by gas price spikes, high demand, policy costs, and tight supply.

✅ Wholesale prices averaged $123/MWh in December

✅ Gas costs surged; supply constraints and outages

✅ Carbon tax and decarbonization policies raised costs


Albertans just endured the highest electricity prices in 21 years. Wholesale prices averaged $123 per megawatt-hour in December, more than triple the level from the previous year and highest for December since 2000.

The situation in Alberta mirrors the energy crisis striking Europe where electricity prices are also surging, largely due to a shocking five-fold increase in natural gas prices in 2021 compared to the prior year.

The situation should give pause to Albertans when they consider aggressive plans to “decarbonize” the electric grid, including proposals for a fully renewable grid by 2030 from some policymakers.

The explanation for skyrocketing energy prices is simple: increased demand (because of Calgary's frigid February demand and a slowly-reviving post-pandemic economy) coupled with constrained supply.

In the nitty gritty details, there are always particular transitory causes, such as disputes with Russian gas companies (in the case of Europe) or plant outages (in the case of Alberta).

But beyond these fleeting factors, there are more permanent systemic constraints on natural gas (and even more so, coal-fired) power plants.

I refer of course to the climate change policies of the Trudeau government at the federal level and some of the more aggressive provincial governments, which have notable implications for electricity grids across Canada.

The most obvious example is the carbon tax, the repeal of which Premier Jason Kenney made a staple of his government.

Putting aside the constitutional issues (on which the Supreme Court ruled in March of last year that the federal government could impose a carbon tax on Alberta), the obvious economic impact will be to make carbon-sourced electricity more expensive.

This isn’t a bug or undesired side-effect, it’s the explicit purpose of a carbon tax.

Right now, the federal carbon tax is $40 per tonne, is scheduled to increase to $50 in April, and will ultimately max out at a whopping $170 per tonne in 2030.

Again, the conscious rationale of the tax, aligned with goals for cleaning up Canada's electricity, is to make coal, oil and natural gas more expensive to induce consumers and businesses to use alternative energy sources.

As Albertans experience sticker shock this winter, they should ask themselves — do we want the government intentionally making electricity and heating oil more expensive?

Of course, the proponent of a carbon tax (and other measures designed to shift Canadians away from carbon-based fuels) would respond that it’s a necessary measure in the fight against climate change, and that Canada will need more electricity to hit net-zero according to the IEA.

Yet the reality is that Canada is a bit player on the world stage when it comes to carbon dioxide, responsible for only 1.5% of global emissions (as of 2018).

As reported at this “climate tracker” website, if we look at the actual policies put in place by governments around the world, they’re collectively on track for the Earth to warm 2.7 degrees Celsius by 2100, far above the official target codified in the Paris Agreement.

Canadians can’t do much to alter the global temperature, but federal and provincial governments can make energy more expensive if policymakers so choose, and large-scale electrification could be costly—the Canadian Gas Association warns of $1.4 trillion— if pursued rapidly.

As renewable technologies become more reliable and affordable, business and consumers will naturally adopt them; it didn’t take a “manure tax” to force people to use cars rather than horses.

As official policy continues to make electricity more expensive, Albertans should ask if this approach is really worth it, or whether options like bridging the Alberta-B.C. electricity gap could better balance costs.

Robert P. Murphy is a senior fellow at the Fraser Institute.


Related News

View more

Sign Up for Electricity Forum’s Newsletter

Stay informed with our FREE Newsletter — get the latest news, breakthrough technologies, and expert insights, delivered straight to your inbox.

Electricity Today T&D Magazine Subscribe for FREE

Stay informed with the latest T&D policies and technologies.
  • Timely insights from industry experts
  • Practical solutions T&D engineers
  • Free access to every issue

Download the 2025 Electrical Training Catalog

Explore 50+ live, expert-led electrical training courses –

  • Interactive
  • Flexible
  • CEU-cerified