Energy Poverty in Extreme Heat exposes vulnerable households to heatwaves, utility shutoffs, and unreliable grid infrastructure, straining public health. Community nonprofits, cooling centers, and policy reform aim to improve electricity access, resilience, and affordable energy.
Key Points
Without reliable, affordable power in heatwaves, health risks rise and cooling, food storage, and daily needs suffer.
✅ Risks: heat illness, dehydration, and indoor temperatures above 90F
✅ Causes: utility shutoffs, aging grid, unpaid bills, remote areas
✅ Relief: cooling centers, aid programs, weatherization, bill credits
In a particular pocket of America, approximately 13,000 families endure the dual challenges of sweltering heat and living without electricity, and the broader risk of summer shut-offs highlights how widespread these pressures have become across the country. This article examines the factors contributing to their plight, the impact of living without electricity during hot weather, and efforts to alleviate these hardships.
Challenges Faced by Families
For these 13,000 families, daily life is significantly impacted by the absence of electricity, especially during the scorching summer months. Without access to cooling systems such as air conditioners or fans, residents are exposed to dangerously high temperatures, which can lead to heat-related illnesses and discomfort, particularly among vulnerable populations such as children, the elderly, and individuals with health conditions, where electricity's role in public health became especially evident.
Causes of Electricity Shortages
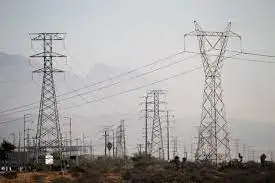
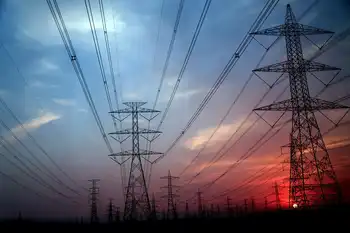
The reasons behind the electricity shortages vary. In some cases, it may be due to economic challenges that prevent families from paying utility bills, resulting in disconnections. Other factors include outdated or unreliable electrical infrastructure in underserved communities, as reflected in a recent grid vulnerability report that underscores systemic risks, where maintenance and upgrades are often insufficient to meet growing demand.
Impact of Extreme Heat
During heatwaves, the lack of electricity exacerbates health risks and quality of life issues for affected families, aligning with reports of more frequent outages across the U.S. Furthermore, the absence of refrigeration and cooking facilities can compromise food safety and nutritional intake, further impacting household well-being.
Community Support and Resilience
Despite these challenges, communities and organizations often rally to support families living without electricity. Local nonprofits, community centers, and government agencies provide assistance such as distributing fans, organizing cooling centers, and delivering essentials like bottled water and non-perishable food items during heatwaves to alleviate immediate hardships and improve summer blackout preparedness in vulnerable neighborhoods.
Long-term Solutions
Addressing electricity access issues requires comprehensive, long-term solutions. These may include policy reforms to ensure equitable access to affordable energy, investments in upgrading infrastructure in underserved areas, and expanding financial assistance programs to help families maintain uninterrupted electricity service, in recognition that climate change risks increasingly stress the grid.
Advocacy and Awareness
Advocacy efforts play a crucial role in raising awareness about the challenges faced by families living without electricity and advocating for sustainable solutions. By highlighting these issues, community leaders, activists, and policymakers can work together to drive policy changes, secure funding for infrastructure improvements, and promote energy efficiency initiatives, drawing lessons from Canada's harsh-weather grid exposures that illustrate regional vulnerabilities.
Building Resilience
Building resilience in vulnerable communities involves not only improving access to reliable electricity but also enhancing preparedness for extreme weather events. This includes developing emergency response plans, educating residents about heat safety measures, and fostering community partnerships to support those in need during crises.
Conclusion
As temperatures rise and climate impacts intensify, addressing the plight of families living without electricity becomes increasingly urgent. By prioritizing equitable access to energy, investing in resilient infrastructure, and fostering community resilience, stakeholders can work towards ensuring that all families have access to essential services, even during the hottest months of the year. Collaborative efforts between government, nonprofit organizations, and community members are essential in creating sustainable solutions that improve quality of life and promote health and well-being for all residents.
Related News