California Managed Decline of Fossil Fuels aligns oil phaseout with carbon neutrality, leveraging ZEV adoption, solar and wind growth, severance taxes, drilling setbacks, fracking oversight, CARB rules, and CalGEM regulation to deliver a just transition.
Key Points
California's strategy to phase out oil and gas while meeting carbon-neutral goals through policy, regulation, and equity.
✅ Severance taxes fund clean energy and workforce transition.
✅ Setbacks restrict drilling near schools, homes, and hospitals.
✅ CARB and CalGEM tighten fracking oversight and ZEV targets.
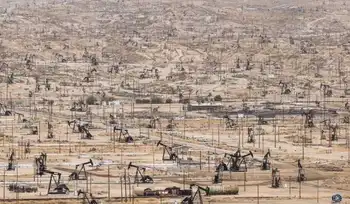
California’s energy past is on a collision course with its future. Think of major oil-producing U.S. states, and Texas, Alaska or North Dakota probably come to mind. Although its position relative to other states has been falling for 20 years, California remains the seventh-largest oil-producing state, with 162 million barrels of crude coming up in 2018, translating to tax revenue and jobs.
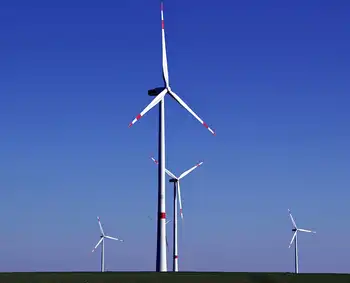
At the same time, California leads the nation in solar rooftops and electric vehicles on the road by a wide margin and ranking fifth in installed wind capacity. Clean energy is the state’s future, and the state is increasingly exporting its energy policies across the West, influencing regional markets. By law, California must have 100 percent carbon-free electricity by 2045, and an executive order signed by former Governor Jerry Brown calls for economywide carbon-neutrality by the same year.
So how can the state reconcile its divergent energy path? How should clean-energy-minded lawmakers wind down California’s oil and gas sector in a way that aligns with the state’s long-term climate targets while providing a just transition for the industry’s workforce?
Any efforts to reduce fossil fuel supply must run parallel to aggressive demand-reduction measures such as California’s push to have 5 million zero-emission vehicles on the road by 2030, said Ethan Elkind, director of Berkeley Law's climate program, especially amid debates over keeping the lights on without fossil fuels in the near term. After all, if oil demand in California remains strong, crude from outside the state will simply fill the void.
“If we don’t stop using it, then that supply is going to get here, even if it’s not produced in-state,” Elkind said in an interview.
Lawmakers have a number of options for policies that would draw down and eventually phase out fossil fuel production in California, according to a new report from the Center for Law, Energy and the Environment at the UC Berkeley School of Law, co-authored by Elkind and Ted Lamm.
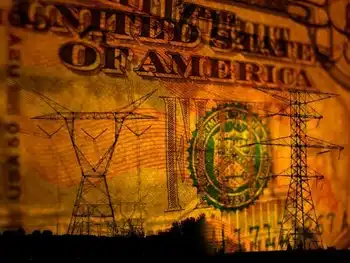
They could impose a higher price on California's oil production through a "severance" tax or carbon-based fee, with the revenue directed to measures that wean the state from fossil fuels. (California, alone among major oil-producing states, does not have an oil severance tax.)
Lawmakers could establish a minimum drilling setback from schools, playgrounds, homes and other sensitive sites. They could push the state's oil and gas regulator, the California Geologic Energy Management Division, to prioritize environmental and climate concerns.
A major factor holding lawmakers back is, of course, politics, including debates over blackouts and climate policy that shape public perception. Given the state’s clean-energy ambitions, it might surprise non-Californians that the oil and gas industry is one of the Golden State’s most powerful special interest groups.
Overcoming a "third-rail issue" in California politics
The Western States Petroleum Association, the sector’s trade group in California's capital of Sacramento, spent $8.8 million lobbying state policymakers in 2019, more than any other interest group. Over the last five years, the group, which cultivates both Democratic and Republican lawmakers, has spent $43.3 million on lobbying, nearly double the total of the second-largest lobbying spender.
Despite former Governor Brown’s reputation as a climate champion, critics say he was unwilling to forcefully take on the oil and gas industry. However, things may take a different turn under Brown's successor, Governor Gavin Newsom.
In May 2019, when Newsom released California's midyear budget revision (PDF), the governor's office noted the need for "careful study and planning to decrease demand and supply of fossil fuels, while managing the decline in a way that is economically responsible and sustainable.”
Related reliability concerns surfaced as blackouts revealed lapses in power supply across the state.
Writing for the advocacy organization Oil Change International, David Turnbull observed, “This may mark the first time that a sitting governor in California has recognized the need to embark upon a managed decline of fossil fuel supply in the state.”
“It is significant because typically this is one of those third-rail issues, kind of a hot potato that governors don’t even want to touch at all — including Jerry Brown, to a large extent, who really focused much more on the demand side of fuel consumption in the state,” said Berkeley Law’s Elkind.
California's revised budget included $1.5 million for a Transition to a Carbon-Neutral Economy report, which is being prepared by University of California researchers for the California Environmental Protection Agency. In an email, a CalEPA spokesperson said the report is due by the end of this year.
Winding down oil and gas production
Since the release of the revised budget last May, Newsom has taken initial steps to increase oversight of the oil and gas industry. In July 2019, he fired the state’s top oil and gas regulator for issuing too many permits to hydraulically fracture, or frack, wells.
Later in the year, he appointed new leadership to oversee oil and gas regulation in the state, and he signed a package of bills that placed constraints on fossil fuel production. The next month, Newsom halted the approval of new fracking operations until pending permits could be reviewed by a panel of scientists at Lawrence Livermore National Laboratory. The California Geologic Energy Management Division (CalGEM) did not resume issuing fracking permit approvals until April of this year.
Not all steps have been in the same direction. This month Newsom dropped a proposal to add dozens of analysts, engineers and geologists at CalGEM, citing COVID-related economic pressure. The move would have increased regulatory oversight on fossil fuel producers and was opposed by the state's oil industry.
Ultimately, more durable measures to wind down fossil fuel supply and demand will require new legislation, even as regulators weigh whether the state needs more power plants to maintain reliability.
A 2019 bill by Assemblymember Al Muratsuchi (D-Torrance), AB 345, would have codified the minimum 2,500-foot setback for new oil and gas wells. However, before the final vote in the Assembly, the bill’s buffer requirement was dropped and replaced with a requirement for CalGEM “to consider a setback distance of 2,500 feet.” The bill passed the Assembly in January over "no" votes from several moderate Democrats; it now awaits action in the Senate.
A bill previously introduced by Assemblymember Phil Ting (D-San Francisco), AB 1745, didn’t even make it that far. Ting’s bill would have required that all new passenger cars registered in the state after January 1, 2040, be zero-emission vehicles (ZEV). The bill died in committee without a vote in April 2018.
But the backing of the California Air Resources Board (CARB), one of the world's most powerful air-quality regulators, could change the political conversation. In March, CARB chair Mary Nichols said she now supports consideration of California establishing a 100 percent zero-emission vehicle sales target by 2030, as policymakers also consider a revamp of electricity rates to clean the grid.
“In the past, I’ve been skeptical about whether that would do more harm than good in terms of the backlash by dealers and others against something that sounded so un-California like,” Nichols said during an online event. “But as time has gone on, I’ve become more convinced that we need to send the longer-term signal about where we’re headed.”
Another complicating factor for California’s political leaders is the lack of a willing federal partner — at least in the short term — in winding down oil and gas production, amid warnings about a looming electricity shortage that could pressure the grid.
Under the Trump administration, the Bureau of Land Management, which oversees 15 million acres of federal land in California, has pushed to open more than 1 million acres of public and private land across eight counties in Central California to fracking. In January 2020, California filed a federal lawsuit to block the move.
Related News