Atlantic Canada Energy Regulatory Reform accelerates smart grids, renewables, hydrogen, and small modular reactors to meet climate targets, enabling interprovincial transmission, EV charging, and decarbonization toward a net-zero grid by 2035 with agile, collaborative policies.
Key Points
A policy shift enabling smart grids, clean energy, and transmission upgrades to decarbonize Atlantic Canada by 2035.
✅ Agile rules for smart grids, EV load, and peak demand balancing
✅ Interprovincial transmission: Maritime Link, NB-PEI, Atlantic Loop
✅ Supports hydrogen, SMRs, and renewables to cut GHG emissions
Atlantica Centre for Energy Senior Policy Consultant Neil Jacobsen says the future of Atlantic Canada’s electricity grid depends on agile regulations, supported by targeted research such as the $2M Atlantic grid study, that match the pace at which renewable technologies are being developed in the race to meet Canada’s climate goals.
In an interview, Jacobsen stressed the need for a more modernized energy regulatory framework, so the Atlantic Provinces can collaborate to quickly develop and adopt cleaner energy.
To this end, Atlantica released a paper that makes the case for responsive smart grid technology, the adaptation of alternative forms of clean energy, the adaptation of hydrogen as an energy source, petroleum price regulation in Atlantic Canada and small modular reactors.
Jacobsen said regulations need to match Canada’s urgency around reducing greenhouse gas emissions by 40 to 45 percent by 2030, achieving a net-neutral national power grid by 2035 and ultimately a net-zero grid by 2050 in Canada – and the goal that 50 percent of Canadian vehicle sales being electric by 2030.
“It’s an evolution of policy and regulations to adapt to a very aggressive timeline of aggressive climate change and decarbonization targets,” said Jacobsen.
“These are transformational energy and environmental commitments, so the path forward really requires the ability to introduce and adapt and move forward with new clean renewable energy technologies.”
Jacobsen said Atlantica’s recommendations are not a criticism of existing regulations– but an acknowledgment that they need to evolve.
He noted newer, clearer regulations will make way for new energy sources – particularly a region that has the countries highest rates of dependency on fossil fuels and growing climate risks, with Atlantic grids under threat from more intense storms.
“We have a long way to go, but at the same time, we have a lot to celebrate. Atlantic Canada is leading the country in reducing greenhouse gas emissions,” said Jacobsen.
“There are new ways of producing energy that requires us to be able to be much more responsive and this is an opportunity to create a higher level of alignment here, in Atlantic Canada.”
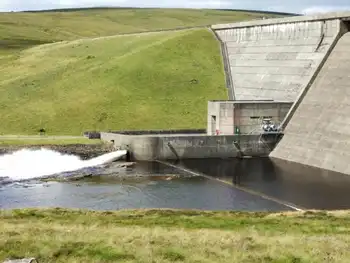
Jacobsen said Atlantica is looking to aid interprovincial cooperation in providing power, echoing calls for a western Canadian grid elsewhere, through projects like the 500-megawatt, 170-kilometre Maritime Link that transports power from the Muskrat Falls hydroelectric dam in Labrador, through Newfoundland and across the Cabot Strait, to Nova Scotia – or NB Power’s export of electricity to P.E.I., via sub-sea cables crossing the Northumberland Strait.
He noted streamlined regulations may allow for more potential wider-scale partnerships, like the proposed Atlantic Loop project, aligning with macrogrid investments that would involve upgrading transmission capacity on the East Coast to allow hydroelectric power from Labrador and Quebec to displace coal use in the region.
Atlantic Canada has led the way with adaption new renewable technologies, noted Jacobsen, referring to nuclear startups Moltex Energy and ARC Nuclear Canada’s efforts to develop small modular nuclear reactor technology in New Brunswick, as well as the potential of adopting hydrogen fuel technology and Nova Scotia’s strides in developing offshore renewable energy.
“I don’t think we have any choice other than to be forceful and aggressive in driving forward a renewable energy agenda.”
Jacobsen said cooperation between the Atlantic provinces is crucial because of how challenging it is to meet energy demand with heavy seasonal and daily variations in energy demand in the region – something smart grid technology could address.
Smart Grid Atlantic is a four-year research and demonstration program testing technologies that provide cleaner local power, support a smarter electricity infrastructure across the region, more renewable power, more information and control over power use and more reliable electricity.
“It can be challenging for utilities to meet those cyclical demands, especially as grids are increasingly exposed to harsh weather across Canada. Smart girds add knowledge of the flow of electrons in a way that can help even out those electricity demands – and quite frankly, those demands will only increase when you look at the electrification of the transportation sector,” he said.
Jacobsen said Atlantica’s paper and call for modernized regulations are only the beginning of a conversation.
Related News