Drax Biomass Conversion accelerates renewable energy by replacing coal with wood pellets, sustainable forestry feedstock, and piloting carbon capture and storage, supporting the UK grid, emissions cuts, and a net-zero pathway.
Key Points
Drax Biomass Conversion is Drax's shift from coal to biomass with CCS pilots to cut emissions and aid UK's net-zero.
✅ Coal units converted to biomass wood pellets
✅ Sourced from sustainable forestry residues
✅ CCS pilots target lifecycle emissions cuts
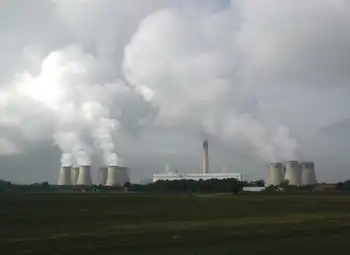
A power station that used to be the biggest polluter in western Europe has made a near-complete switch to renewable energy, mirroring broader shifts as Denmark's largest energy company plans to end coal by 2023.
The Drax Power Station in Yorkshire, England, used to spew out millions of tons of carbon dioxide a year by burning coal. But over the past eight years, it has overhauled its operations by converting four of its six coal-fired units to biomass. The plant's owners say it now generates 15% of the country's renewable power, as Britain recently went a full week without coal power for the first time.
The change means that just 6% of the utility's power now comes from coal, as the wider UK coal share hits record lows across the national electricity system. The ultimate goal is to stop using coal altogether.
"We've probably reduced our emissions more than any other utility in the world by transforming the way we generate power," Will Gardner, CEO of the Drax Group, told CNN Business.
Subsidies have helped finance the switch to biomass, which consists of plant and agricultural matter and is viewed as a promising substitute for coal, and utilities such as Nova Scotia Power are also increasing biomass use. Last year, Drax received £789 million ($1 billion) in government support.
Is biomass good for the environment?
While scientists disagree over the extent to which biomass as a fuel is environmentally friendly, and some environmentalists urge reducing biomass use amid concerns about lifecycle emissions, Drax highlights that its supplies come from from sustainably managed and growing forests.
Most of the biomass used by Drax consists of low-grade wood, sawmill residue and trees with little commercial value from the United States. The material is compressed into sawdust pellets.
Gardner says that by purchasing bits of wood not used for construction or furniture, Drax makes it more financially viable for forests to be replanted. And planting new trees helps offset biomass emissions.
Forests "absorb carbon as they're growing, once they reach maturity, they stop absorbing carbon," said Raphael Slade, a senior research fellow at Imperial College London.
But John Sterman, a professor at MIT's Sloan School of Management, says that in the short term burning wood pellets adds more carbon to the atmosphere than burning coal.
That carbon can be absorbed by new trees, but Sterman says the process can take decades.
"If you're looking at five years, [biomass is] not very good ... If you're looking at a century-long time scale, which is the sort of time scale that many foresters plan, then [biomass] can be a lot more beneficial," says Slade.
Carbon capture
Enter carbon capture and storage technology, which seeks to prevent CO2 emissions from entering the atmosphere and has been touted as a possible solution to the climate crisis.
Drax, for example, is developing a system to capture the carbon it produces from burning biomass. But that could be 10 years away.
The Coal King is racing to avoid bankruptcy
The power station is currently capturing just 1 metric ton of CO2 emissions per day. Gardner says it hopes to increase this to 10,000 metric tons per day by the mid to late 2020s.
"The technology works but scaling it up and rolling it out, and financing it, are going to be significant challenges," says Slade.
The Intergovernmental Panel on Climate Change shares this view. The group said in a 2018 report that while the potential for CO2 capture and storage was considerable, its importance in the fight against climate change would depend on financial incentives for deployment, and whether the risks of storage could be successfully managed. These include a potential CO2 pipeline break.
In the United Kingdom, the government believes that carbon capture and storage will be crucial to reaching its goal of achieving net-zero greenhouse gas emissions by 2050, even as low-carbon generation stalled in 2019 according to industry analysis.
It has committed to consulting on a market-based industrial carbon capture framework and in June awarded £26 million ($33 million) in funding for nine carbon capture, usage and storage projects, amid record coal-free generation on the British grid.
Related News