FERC approves New England power grid plan

By Reuters


NFPA 70b Training - Electrical Maintenance

Our customized live online or in‑person group training can be delivered to your staff at your location.

  • Live Online
  • 12 hours Instructor-led
  • Group Training Available
Regular Price:
$599
Coupon Price:
$499
Reserve Your Seat Today
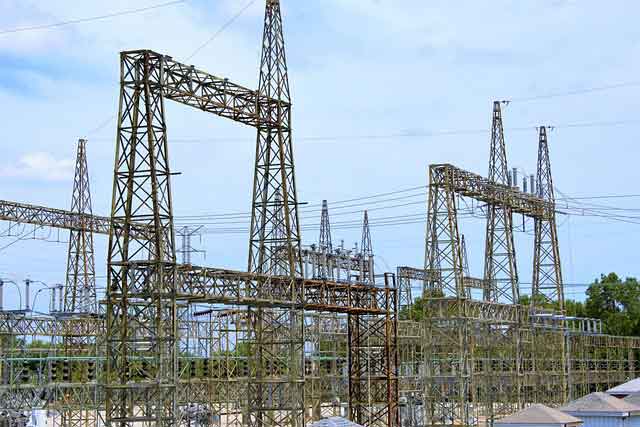
The Federal Energy Regulatory Commission conditionally approved a plan for New England's transmission grid operator to form an independent entity that controls the region's power flows.

ISO New England currently operates the $4.5 billion wholesale marketplace for more than 14 million people in Massachusetts, Maine, Connecticut, Vermont, New Hampshire and Rhode Island.

The FERC action formally designates ISO New England as a regional transmission organization (RTOs), which the agency has endorsed as a way to pool available supplies to improve reliability and lower costs for consumers. The agency has already approved RTOs in the Midwest and the Northeast.

The New England grid has been operating since 1997 in a less formal arrangement in which utilities pool their power into a common network, but still retain control of their transmission wires.

With the status change, the non-profit ISO New England will control the grid's day-to-day operations and have the authority to reroute flows in order to maintain reliability.

U.S. and Canadian federal investigators have found that a lack of such control by the Midwest's grid controller helped cause last August's massive blackout in the Northeast.

FERC has sought to place control of the U.S. grid in the hands of independent groups that lack profit-driven incentives to favor their own generation when routing power flows.

"We have here what will be a truly independent (regional transmission organization), not dependent on the benevolence of the transmission owners," said FERC Chairman Pat Wood.

The status change will give the grid group "greater independence and authority" over the New England network, said Gordon van Welie, the grid's president and chief executive.

FERC set for hearing a proposed 12.8 percent increase in return on equity that participating utilities would earn as incentive for agreeing to join the regional grid.

The agency wants to offer utilities incentives to divest their generation into regional grids, but has yet to decide on the exact formulas it will use, Wood said.

The biggest transmission owners in New England include subsidiaries of NSTAR Electric and Gas Corp., Northeast Utilities Co. , Energy East Corp. , and National Grid Transco Plc .

Related News

US January power generation jumps 9.3% on year: EIA

US January power generation climbed to 373.2 TWh, EIA data shows, with coal edging natural gas, record wind output, record nuclear generation, rising hydro, and stable utility-scale solar amid higher Henry Hub prices.


Key Points

US January power generation hit 373.2 TWh; coal led gas, wind and nuclear set records, with solar edging higher.

✅ Coal 31.8% share; gas 29.4%; coal output 118.7 TWh, gas 109.6 TWh.

✅ Wind hit record 26.8 TWh; nuclear record 74.6 TWh.

✅ Total generation 373.2 TWh, highest January since 2014.


The US generated 373.2 TWh of power in January, up 7.9% from 345.9 TWh in December and 9.3% higher than the same month in 2017, Energy Information Administration data shows.

The monthly total was the highest amount in January since 377.3 TWh was generated in January 2014.

Coal generation totaled 118.7 TWh in January, up 11.4% from 106.58 TWh in December and up 2.8% from the year-ago month, consistent with projections of a coal-fired generation increase for the first time since 2014. It was also the highest amount generated in January since 132.4 TWh in 2015.

For the second straight month, more power was generated from coal than natural gas, as 109.6 TWh came from gas, up 3.3% from 106.14 TWh in December and up 19.9% on the year.

However, the 118.7 TWh generated from coal was down 9.6% from the five-year average for the month, due to the higher usage of gas and renewables and a rising share of non-fossil generation in the overall mix.

#google#

Coal made up 31.8% of the total US power generation in January, up from 30.8% in December but down from 33.8% in January 2017.

Gas` generation share was at 29.4% in the latest month, with momentum from record gas-fired electricity earlier in the period, down from 30.7% in December but up from 26.8% in the year-ago month.

In January, the NYMEX Henry Hub gas futures price averaged $3.16/MMBtu, up 13.9% from $2.78/MMBtu averaged in December but down 4% from $3.29/MMBtu averaged in the year-ago month.


WIND, NUCLEAR GENERATION AT RECORD HIGHS

Wind generation was at a record-high 26.8 TWh in January, up 29.3% from 22.8 TWh in December and the highest amount on record, according to EIA data going back to January 2001. Wind generated 7.2% of the nation`s power in January, as an EIA summer outlook anticipates larger wind and solar contributions, up from 6.6% in December and 6.1% in the year-ago month.

Utility-scale solar generated 3.3 TWh in January, up 1.3% from 3.1 TWh in December and up 51.6% on the year. In January, utility-scale solar generation made up 0.9% of US power generation, during a period when solar and wind supplied 10% of US electricity in early 2018, flat from December but up from 0.6% in January 2017.

Nuclear generation was also at a record-high 74.6 TWh in January, up 1.3% month on month and the highest monthly total since the EIA started tracking it in January 2001, eclipsing the previous record of 74.3 TWh set in July 2008. Nuclear generation made up 20% of the US power in January, down from 21.3% in December and 21.4% in the year-ago month.

Hydro power totaled 25.4 TWh in January, making up 6.8% of US power generation during the month, up from 6.5% in December but down from 8.2% in January 2017.


Related News

View more

Is The Global Energy Transition On Track?

Global Decarbonization Strategies align renewable energy, electrification, clean air policies, IMO sulfur cap, LNG fuels, and the EU 2050 roadmap to cut carbon intensity and meet Paris Agreement targets via EVs and efficiency.


Key Points

Frameworks that cut emissions via renewables, EVs, efficiency, cleaner marine fuels, and EU policy roadmaps.

✅ Renewables scale as wind and solar outcompete new coal and gas.

✅ Electrification of transport grows as EV costs fall and charging expands.

✅ IMO 2020 sulfur cap and LNG shift cut shipping emissions and particulates.


Are we doing enough to save the planet? Silly question. The latest prognosis from the United Nations’ Intergovernmental Panel on Climate Change made for gloomy reading. Fundamental to the Paris Agreement is the target of keeping global average temperatures from rising beyond 2°C. The UN argues that radical measures are needed, and investment incentives for clean electricity are seen as critical by many leaders to accelerate progress to meet that target.

Renewable power and electrification of transport are the pillars of decarbonization. It’s well underway in renewables - the collapse in costs make wind and solar generation competitive with new build coal and gas.

Renewables’ share of the global power market will triple by 2040 from its current level of 6% according to our forecasts.

The consumption side is slower, awaiting technological breakthrough and informed by efforts in countries such as New Zealand’s electricity transition to replace fossil fuels with electricity. The lower battery costs needed for electric vehicles (EVs) to compete head on and displace internal combustion engine (ICE)  cars are some years away. These forces only start to have a significant impact on global carbon intensity in the 2030s. Our forecasts fall well short of the 2°C target, as does the IEA’s base case scenario.

Yet we can’t just wait for new technology to come to the rescue. There are encouraging signs that society sees the need to deal with a deteriorating environment. Three areas of focus came out in discussion during Wood Mackenzie’s London Energy Forum - unrelated, different in scope and scale, each pointing the way forward.

First, clean air in cities.  China has shown how to clean up a local environment quickly. The government reacted to poor air quality in Beijing and other major cities by closing older coal power plants and forcing energy intensive industry and the residential sector to shift away from coal. The country’s return on investment will include a substantial future health care dividend.

European cities are introducing restrictions on diesel cars to improve air quality. London’s 2017 “toxicity charge” is a precursor of an Ultra-Low Emission Zone in 2019, and aligns with UK net-zero policy changes that affect transport planning, to be extended across much of the city by 2020. Paris wants to ban diesel cars from the city centre by 2025 and ICE vehicles by 2030. Barcelona, Madrid, Hamburg and Stuttgart are hatching similar plans.


College Promise In California: Community-Wide Efforts To Support Student Success

Second, desulphurisation of global shipping. High sulphur fuel oil (HSFO) meets around 3.5 million barrels per day (b/d) of the total marine market of 5 million b/d. A maximum of 3.5% sulphur content is allowed currently. The International Maritime Organisation (IMO) implements a 0.5% limit on all shipping in 2020, dramatically reducing the release of sulphur oxides into the atmosphere.

Some ships will switch to very low sulphur fuel oil, of which only around 1.4 million b/d will be available in 2020. Others will have to choose between investing in scrubbers or buying premium-priced low sulphur marine gas oil.

Longer-term, lower carbon-intensity gas is a winner as liquefied natural gas becomes fuel of choice for many newbuilds. Marine LNG demand climbs from near zero to 50 million tonnes per annum (tpa) by 2040 on our forecasts, behind only China, India and Japan as a demand centre. LNG will displace over 1 million b/d of oil demand in shipping by 2040.

Third, Europe’s radical decarbonisation plans. Already in the vanguard of emissions reductions policy, the European Commission is proposing to reduce carbon emissions for new cars and vans by 30% by 2030 versus 2020. The targets come with incentives for car manufacturers linked to the uptake of EVs.

The 2050 roadmap, presently at the concept stage, envisages a far more demanding regime, with EU electricity plans for 2050 implying a much larger power system. The mooted 80% reduction in emissions compared with 1990 will embrace all sectors. Power and transport are already moving in this direction, but the legacy fuel mix in many other sectors will be disrupted, too.

Near zero-energy buildings and homes might be possible with energy efficiency improvements, renewables and heat pumps. Electrification, recycling and bioenergy could reduce fossil fuel use in energy intensive sectors like steel and aluminium, and Europe’s oil majors going electric illustrates how incumbents are adapting. Some sectors will cite the risk decarbonisation poses to Europe’s global competitiveness. If change is to come, industry will need to build new partnerships with society to meet these targets.

The 2050 roadmap signals the ambition and will be game changing for Europe if it is adopted. It would provide a template for a global roll out that would go a long way toward meeting UN’s concerns.


Related News

View more

Nunavut's electricity price hike explained

Nunavut electricity rate increase sees QEC raise domestic electricity rates 6.6% over two years, affecting customer rates, base rates, subsidies, and kWh overage charges across communities, with public housing exempt and territory-wide pricing denied.


Key Points

A 6.6% QEC hike over 2018-2019, affecting customer rates, subsidies, and kWh overage; public housing remains exempt.

✅ 3.3% on May 1, 2018; 3.3% on Apr 1, 2019

✅ Subsidy caps: 1,000 kWh Oct-Mar; 700 kWh Apr-Sep

✅ Territory-wide base rate denied; public housing exempt


Ahead of the Nunavut government's approval of the general rate increase for the Qulliq Energy Corporation, many Nunavummiut wondered how the change would impact their electricity bills.

QEC's request for a 6.6-per-cent increase was approved by the government last week. The increase will be spread out over two years, a pattern similar to BC Hydro's two-year rate plan, with the first increase (3.3 per cent) effective May 1, 2018. The remaining 3.3 per cent will be applied on April 1, 2019.

Public housing units, however, are exempt from the government's increase altogether.

The power corporation also asked for a territory-wide rate, so every community would pay the same base rate (we'll go over specific terms in a minute if you're not familiar with them). But that request was denied, even as Manitoba Hydro scaled back increases next year, and QEC will now take the next two years reassessing each community's base rate.

#google#

So, what does this mean for your home's power bill? Well, there's a few things you need to know, which we'll get to in a second.

But in essence, as long as you don't go over the government-subsidized monthly electricity usage limit, you're paying an extra 3.61 cents per kilowatt hour (kWh).

To be clear, we're talking about non-government domestic rates — basically, private homeowners — and those living in a government-owned unit but pay for their own power.


The basics

First, some quick terminology. The "base rate" term we're going to use (and used above) in this story refers to the community rate. As in, what QEC charges customers in every community. The "customer rate" is the rate customers actually pay, after the government's subsidy.


The first thing you need to know is everyone in Nunavut starts off by paying the same customer rate, unlike jurisdictions using a price cap to limit spikes.

That's because the government subsidizes electricity costs, and that subsidy is different in every community, because the base rate is different.

For example, Iqaluit's new base rate after the 3.3 per cent increase (remember, the 6.6 per cent is being applied over two years) is 56.69 cents per kWh, while Kugaaruk's base rate rose to 112.34 cents per kWh. Those, by the way, are the territory's lowest and highest respective base rates.

However, customers in both Iqaluit and Kugaaruk will each now pay 28.35 cents per kWh because, remember, the government subsidizes the base rates in every community.

Now, remember earlier we mentioned a "government-subsidized monthly electricity usage limit?" That's where customers in various communities start to pay different amounts.

As simply as we can explain it, the government will only cover so much electricity usage in a month, in every household.

Between October and March, the government will subsidize the first 1,000 kilowatt hours, and only 700 kilowatt hours from April to September. QEC says the average Nunavut home will use about 500 kilowatt hours every month over the course of a year.

But if your household goes over that limit, you're at the mercy of your community's base rate for any extra electricity you use. Homes in Kugaaruk in December, for instance, will have to pay that 122.34 cents for every extra kilowatt hour it uses, while homes in Iqaluit only have to pay 56.69 cents per kWh for its extra electricity.

That's where many Nunavummiut have criticized the current rate structure, because smaller communities are paying more for their extra costs than larger communities.

QEC had hoped — as it had asked for — to change the structure so every community pays the same base rate. So regardless of if people go over their electricity usage limits for the government subsidy, everyone would pay the same overage rates.

But the government denied that request.


New rate is actually lower

The one thing we should highlight, however, is the new rate after the increase is actually lower than what customers were paying in 2014.

For the past seven months, customers have been getting power from QEC at a discount, whereas Newfoundland customers began paying for Muskrat Falls during the same period, to different effect.

That's because when QEC sets its rates, it does so based on global oil price forecasts. Since 2014, the price of oil worldwide has slumped, and so QEC was able to purchase it at less than it had anticipated.

When that happens, and QEC makes more than $1 million within a six month period thanks to the lower oil prices, it refunds the excess profits back to customers through a discount on electricity base rates — a mechanism similar to a lump-sum credit used elsewhere — the government subsidy, however, doesn't change so the savings are passed on directly to customers.

Now, the 6.6 per cent increase to electricity rates, is actually being applied to the discounted base rate from the last seven months.

So again, while customers are paying more than they have been for the last seven months, it's lower than what they were paying in 2014.

Lastly, to be clear, all the figures used in this story are only for domestic non-government rates. Commercial rates and changes have not been explored in this story, given the differences in subsidy and rate application.


Related News

View more

Cost, safety drive line-burying decisions at Tucson Electric Power

TEP Undergrounding Policy prioritizes selective underground power lines to manage wildfire risk, engineering costs, and ratepayer impacts, balancing transmission and distribution reliability with right-of-way, safety, and vegetation management per Arizona regulators.


Key Points

A selective TEP approach to bury lines where safety, engineering, and cost justify undergrounding.

✅ Selective undergrounding for feeders near substations

✅ Balances wildfire mitigation, reliability, and ratepayer costs

✅ Follows ACC rules, BLM and USFS vegetation management


Though wildfires in California caused by power lines have prompted calls for more underground lines, Tucson Electric Power Co. plans to keep to its policy of burying lines selectively for safety.

Like many other utilities, TEP typically doesn’t install its long-range, high-voltage transmission lines, such as the TransWest Express project, and distribution equipment underground because of higher costs that would be passed on to ratepayers, TEP spokesman Joe Barrios said.

But the company will sometimes bury lower-voltage lines and equipment where it is cost-effective or needed for safety as utilities adapt to climate change across North America, or if customers or developers are willing to pay the higher installation costs

Underground installations generally include additional engineering expenses, right-of-way acquisition for projects like the New England Clean Power Link in other regions, and added labor and materials, Barrios said.

“This practice avoids passing along unnecessary costs to customers through their rates, so that all customers are not asked to subsidize a discretionary expenditure that primarily benefits residents or property owners in one small area of our service territory,” he said, adding that the Arizona Corporation Commission has supported the company’s policy.

Even so, TEP will place equipment underground in some circumstances if engineering or safety concerns, including electrical safety tips that utilities promote during storm season, justify the additional cost of underground installation, Barrios said.

In fact, lower-voltage “feeder” lines emerging from distribution substations are typically installed underground until the lines reach a point where they can be safely brought above ground, he added.

While in California PG&E has shut off power during windy weather to avoid wildfires in forested areas traversed by its power lines after events like the Drum Fire last June, TEP doesn’t face the same kind of wildfire risk, Barrios said.

Most of TEP’s 5,000 miles of transmission and distribution lines aren’t located in heavily forested areas that would raise fire concerns, though large urban systems have seen outages after station fires in Los Angeles, he said.

However, TEP has an active program of monitoring transmission lines and trimming vegetation to maintain a fire-safety buffer zone and address risks from vandalism such as copper theft where applicable, in compliance with federal regulations and in cooperation with the U.S. Bureau of Land Management and the U.S. Forest Service.


Related News

View more

Sudbury Hydro crews aim to reconnect service after storm

Sudbury Microburst Power Outage strains hydro crews after straight-line winds; New Sudbury faces downed power lines, tree damage, and hazardous access as restoration efforts, mutual aid, and safety protocols aim to reconnect customers by weekend.


Key Points

A microburst downed lines in New Sudbury, cutting power as crews tackle hazardous access and complex repairs.

✅ Straight-line winds downed poles, trees, and service lines

✅ Crews face backyard access hazards, complex reconnections

✅ Mutual aid linemen, arborists, and crane work speed restoration


About 300 Sudbury Hydro customers are still without power Thursday after Monday's powerful microburst storm, part of a series of damaging storms in Ontario seen across the province.

The utility's spokesperson, Wendy Watson, says the power in the affected New Sudbury neighbourhoods should be back on by the weekend, even as Toronto power outages persisted in a recent storm.

The storm, which Environment Canada said was classified as a microburst or straight line wind damage, similar to a severe windstorm in Quebec, downed a number of power lines in the city.

Now crews are struggling with access to the lines, a challenge that BC Hydro's atypical storm response also highlighted, as they work to reconnect service in the area.

"In some cases, you can't get to someone's back yard, or you have to go through the neighbour's yard," Watson said.

"We have one case where [we had] equipment working over a swimming pool. It's dicey, it's really dirty and it's dangerous."

Monday's storm caused massive property damage across the city, particularly in New Sudbury. (Benjamin Aubé/CBC)

Veteran arborist Jim Allsop told CBC News he hasn't seen damage like this in his 30-plus years in the business.

"I don't know how many we've done up to date, but I have another 35 trees on houses," Allsop said. "We'll be probably another week."

"We've rented a crane to help speed up the process, and increase safety, and we're getting five or six done in our 12-hour days."

Scott Aultman, a lineman with North Bay Hydro, said he has seen a few storms in his career, and isn't usually surprised by extensive damage a storm can cause.

"When you see a trailer on its side, you know, you don't see that every day," Aultman said.

But during the clean up, Aultman said the spirit of camaraderie runs high with crews from different areas, as seen when Canadian crews helped Florida during Hurricane Irma.

"We were pumped. It's part of the trade, everybody gets together," Aultman said. "We had a big storm in 2006 and the Sudbury guys were up helping us, so it's great, it's nice to be able to return the favour and help them out."


Related News

View more

WY Utility's First Wind Farm Faces Replacement

Foote Creek I Wind Farm Repowering upgrades Wyoming turbines with new nacelles, towers, and blades, cutting 68 units to 12 while sustaining 41.6 MW, under PacifiCorp and Rocky Mountain Power's Energy Vision 2020 plan.


Key Points

Replacement at Foote Creek Rim I, cutting to 12 turbines while sustaining about 41.6 MW using modern 2-4.2 MW units.

✅ 12 turbines replace 68, output steady near 41.6 MW

✅ New nacelles, towers, blades; taller 500 ft turbines

✅ Part of PacifiCorp Energy Vision 2020 and Gateway West


A Wyoming utility company has filed a permit to replace its first wind farm—originally commissioned in 1998, composed of over 65 turbines—amid new gas capacity competing with nuclear in Ohio, located at Foote Creek Rim I. The replacement would downsize the number of turbines to 12, which would still generate roughly the same energy output.

According to the Star Tribune, PacifiCorp’s new installation would involve new nacelles, new towers and new blades. The permit was filed with Carbon County.


New WY Wind Farm

The replacement wind turbines will stand more than twice as tall as the old: Those currently installed stand 200 feet tall, whereas their replacements will tower closer to 500 feet. Though this move is part of the company’s overall plan to expand its state wind fleet as some utilities respond to declining coal returns in the Midwest, the work going into the Foote Creek site is somewhat special, noted David Eskelsen, spokesperson for Rocky Mountain Power, the western arm of PacifiCorp.

“Foote Creek I repowering is somewhat different from the repowering projects announced in the (Energy Vision) 2020 initiative,” he said. “Foote Creek is a complete replacement of the existing 68 foundations, towers, turbine nacelles and rotors (blades).”

Currently, the turbines at Foote Creek have 600 kilowatts capacity each; the replacements’ maximum production ranges from 2 megawatts to 4.2 megawatts each, with the total output remaining steady at 41.4 megawatts, a scale similar to a 30-megawatt wind expansion in Eastern Kings, though there will be a slight capacity increase to 41.6 megawatts, according to the Star Tribune.

As part of the wind farm repowering initiative, PacifiCorp is to become full owner and operator of the Foote Creek site. When the farm was originally built, an Oregon-based water and electric board was 21 percent owner; 37 percent of the project’s output was tied into a contract with the Bonneville Power Administration.

Otherwise, PacifiCorp is moving to further expand its state wind fleet in line with initiatives like doubling renewable electricity by 2030 in Saskatchewan, with the addition of three new wind farms—to be located in Carbon, Albany and Converse counties—which may add up to 1,150 megawatts of power.

According to PacifiCorp, the company has more than 1,000 megawatts of owned wind generation capability, along with long-term purchase agreements for more than 600 megawatts from other wind farms owned by other entities. Energy Vision 2020 refers to a $3.5 billion investment and company move that is looking to upgrade the company's existing wind fleet with newer technology, adding 1,150 megawatts of new wind resources by 2020 and a a new 140-mile Gateway West transmission segment in Wyoming, comparable to a transmission project in Missouri just energized.


Related News

View more

Sign Up for Electricity Forum’s Newsletter

Stay informed with our FREE Newsletter — get the latest news, breakthrough technologies, and expert insights, delivered straight to your inbox.

Electricity Today T&D Magazine Subscribe for FREE

Stay informed with the latest T&D policies and technologies.
  • Timely insights from industry experts
  • Practical solutions T&D engineers
  • Free access to every issue

Live Online & In-person Group Training

Advantages To Instructor-Led Training – Instructor-Led Course, Customized Training, Multiple Locations, Economical, CEU Credits, Course Discounts.

Request For Quotation

Whether you would prefer Live Online or In-Person instruction, our electrical training courses can be tailored to meet your company's specific requirements and delivered to your employees in one location or at various locations.