Ensuring power security for the World Cup

By Industrial Info Resources


Protective Relay Training - Basic

Our customized live online or in‑person group training can be delivered to your staff at your location.

  • Live Online
  • 12 hours Instructor-led
  • Group Training Available
Regular Price:
$699
Coupon Price:
$599
Reserve Your Seat Today
South Africa's power demand is returning to mid-2008 levels amid steady growth in the country's manufacturing sector.

Pressure on power supplies from national utility Eskom could come from the mining and heavy industrial sectors, as global demand for commodities and industrial feedstocks continues to recover. Industry takes up 83% of the power supply, and the 17% taken by domestic users is steady as the population appears to be watching consumption in the face of a power tariff hike.

Added to this potentially tense power supply scene is the prospect of the soccer's World Cup tournament, which kicks off in Johannesburg in mid-June. The tournament will see games, followed by crowds of local and visiting fans, taking place at stadiums throughout the country until the final in mid-July. Eskom has said that it has a program in place to ensure the security of the power supply during the World Cup period, including an assessment of potential risks at all the utility's power stations and the prioritization of actions to mitigate the risk.

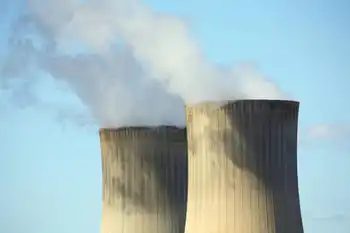
In the course of this plan, the country's only nuclear power station, the 1,800-MW Koeberg on the Atlantic coast near Cape Town, will undergo pre-emptive maintenance work on a cooling system during a shutdown of seven days next week and another shutdown sometime in April. Eskom has identified a possible risk related to the system that takes sea water to transfer heat from structures and components inside the reactor building. Short shutdowns were being implemented to allow power stations to undergo maintenance or replacements.

Tony Stott, a senior Eskom manager, said that the shutdowns were not expected to cause power shortages in the Western Cape region. He said that during the shutdowns, Eskom would supplement the supply from Koeberg with electrical power from other base-load power stations. It was unlikely that Eskom would have to incur the extra expense of running two peaking open-cycle gas turbines sited in the Western Cape.

Related News

UK low-carbon electricity generation stalls in 2019

UK low-carbon electricity 2019 saw stalled growth as renewables rose slightly, wind expanded, nuclear output fell, coal hit record lows, and net-zero targets demand faster deployment to cut CO2 intensity below 100gCO2/kWh.


Key Points

Low-carbon sources supplied 54% of UK power in 2019, up just 1TWh; wind grew, nuclear fell, and coal dropped to 2%.

✅ Wind up 8TWh; nuclear down 9TWh amid outages

✅ Fossil fuels 43% of generation; coal at 2%

✅ Net-zero needs 15TWh per year added to 2030


The amount of electricity generated by low-carbon sources in the UK stalled in 2019, Carbon Brief analysis shows.

Low-carbon electricity output from wind, solar, nuclear, hydro and biomass rose by just 1 terawatt hour (TWh, less than 1%) in 2019. It represents the smallest annual increase in a decade, where annual growth averaged 9TWh. This growth will need to double in the 2020s to meet UK climate targets while replacing old nuclear plants as they retire.

Some 54% of UK electricity generation in 2019 came from low-carbon sources, including 37% from renewables and 20% from wind alone, underscoring wind's leading role in the power mix during key periods. A record-low 43% was from fossil fuels, with 41% from gas and just 2% from coal, also a record low. In 2010, fossil fuels generated 75% of the total.

Carbon Brief’s analysis of UK electricity generation in 2019 is based on figures from BM Reports and the Department for Business, Energy and Industrial Strategy (BEIS). See the methodology at the end for more on how the analysis was conducted.

The numbers differ from those published earlier in January by National Grid, which were for electricity supplied in Great Britain only (England, Wales and Scotland, but excluding Northern Ireland), including via imports from other countries.

Low-carbon low
In 2019, the UK became the first major economy to target net-zero greenhouse gas emissions by 2050, increasing the ambition of its legally binding Climate Change Act.

To date, the country has cut its emissions by around two-fifths since 1990, with almost all of its recent progress coming from the electricity sector.

Emissions from electricity generation have fallen rapidly in the decade since 2010 as coal power has been almost phased out and even gas output has declined. Fossil fuels have been displaced by falling demand and by renewables, such as wind, solar and biomass.

But Carbon Brief’s annual analysis of UK electricity generation shows progress stalled in 2019, with the output from low-carbon sources barely increasing compared to a year earlier.

The chart below shows low-carbon generation in each year since 2010 (grey bars) and the estimated level in 2019 (red). The pale grey bars show the estimated future output of existing low-carbon sources after old nuclear plants retire and the pale red bars show the amount of new generation needed to keep electricity sector emissions to less than 100 grammes of CO2 per kilowatt hour (gCO2/kWh), the UK’s nominal target for the sector.

 Annual electricity generation in the UK by fuel, terawatt hours, 2010-2019. Top panel: fuel by fuel. Bottom panel: cumulative total generation from all sources. Source: BEIS energy trends, BM Reports and Carbon Brief analysis. Chart by Carbon Brief using Highcharts.
As the chart shows, the UK will require significantly more low-carbon electricity over the next decade as part of meeting its legally binding climate goals.

The nominal 100gCO2/kWh target for 2030 was set in the context of the UK’s less ambitious goal of cutting emissions to 80% below 1990 levels by 2050. Now that the country is aiming to cut emissions to net-zero by 2050, that 100gCO2/kWh indicator is likely to be the bare minimum.

Even so, it would require a rapid step up in the pace of low-carbon expansion, compared to the increases seen over the past decade. On average, low-carbon generation has risen by 9TWh each year in the decade since 2010 – including a rise of just 1TWh in 2019.

Given scheduled nuclear retirements and rising demand expected by the Committee on Climate Change (CCC) – with some electrification of transport and heating – low-carbon generation would need to increase by 15TWh each year until 2030, just to meet the benchmark of 100gCO2/kWh.

For context, the 3.2 gigawatt (GW) Hinkley C new nuclear plant being built in Somerset will generate around 25TWh once completed around 2026. The world’s largest offshore windfarm, the 1.2GW Hornsea One scheme off the Yorkshire coast, will generate around 5TWh each year.

The new Conservative government is targeting 40GW of offshore wind by 2030, up from today’s figure of around 8GW. If policies are put in place to meet this goal, then it could keep power sector emissions below 100gCO2/kWh, depending on the actual performance of the windfarms built.

However, new onshore wind and solar, further new nuclear or other low-carbon generation, such as gas with carbon capture and storage (CCS), is likely to be needed if demand is higher than expected, or if the 100gCO2/kWh benchmark is too weak in the context of net-zero by 2050.

The CCC says it is “likely” to “reflect the need for more rapid deployment” of low-carbon towards net-zero emissions in its advice on the sixth UK carbon budget for 2033-2037, due in September.

Trading places
Looking more closely at UK electricity generation in 2019, Carbon Brief’s analysis shows why there was so little growth for low-carbon sources compared to the previous year.

There was another increase for wind power in 2019 (up 8TWh, 14%), with record wind generation as several large new windfarms were completed including the 1.2GW Hornsea One project in October and the 0.6GW Beatrice offshore windfarm in Q2 of 2019. But this was offset by a decline for nuclear (down 9TWh, 14%), due to ongoing outages for reactors at Hunterston in Scotland and Dungeness in Kent.

(Analysis of data held by trade organisation RenewableUK suggests some 0.6GW of onshore wind capacity also started operating in 2019, including the 0.2GW Dorenell scheme in Moray, Scotland.)

As a result of these movements, the UK’s windfarms overtook nuclear for the first time ever in 2019, becoming the country’s second-largest source of electricity generation, and earlier, wind and solar together surpassed nuclear in the UK as momentum built. This is shown in the figure below, with wind (green line, top panel) trading places with nuclear (purple) and gas (dark blue) down around 25% since 2010 but remaining the single-largest source.

 Annual electricity generation in the UK by fuel, terawatt hours, 2010-2019. Top panel: fuel by fuel. Bottom panel: cumulative total generation from all sources. Source: BEIS energy trends, BM Reports and Carbon Brief analysis. Chart by Carbon Brief using Highcharts.
The UK’s currently suspended nuclear plants are due to return to service in January and March, according to operator EDF, the French state-backed utility firm. However, as noted above, most of the UK’s nuclear fleet is set to retire during the 2020s, with only Sizewell B in Suffolk due to still be operating by 2030. Hunterston is scheduled to retire by 2023 and Dungeness by 2028.

Set against these losses, the UK has a pipeline of offshore windfarms, secured via “contracts for difference” with the government, at a series of auctions. The most recent auction, in September 2019, saw prices below £40 per megawatt hour – similar to current wholesale electricity prices.

However, the capacity contracted so far is not sufficient to meet the government’s target of 40GW by 2030, meaning further auctions – or some other policy mechanism – will be required.

Coal zero
As well as the switch between wind and nuclear, 2019 also saw coal fall below solar for the first time across a full year, echoing the 2016 moment when wind outgenerated coal across the UK, after it suffered another 60% reduction in electricity output. Just six coal plants remain in the UK, with Aberthaw B in Wales and Fiddlers Ferry in Cheshire closing in March.

Coal accounted for just 2% of UK generation in 2019, a record-low coal share since centralised electricity supplies started to operate in 1882. The fuel met 40% of UK needs as recently as 2012, but has plummeted thanks to falling demand, rising renewables, cheaper gas and higher CO2 prices.

The reduction in average coal generation hides the fact that the fuel is now often not required at all to meet the UK’s electricity needs. The chart below shows the number of days each year when coal output was zero in 2019 (red line) and the two previous years (blue).

 Cumulative number of days when UK electricity generation from renewable sources has been higher than that from fossil fuels. Source: BEIS energy trends, BM Reports and Carbon Brief analysis. Chart by Carbon Brief using Highcharts.
The 83 days in 2019 with zero coal generation amount to nearly a quarter of the year and include the record-breaking 18-day stretch without the fuel.

Great Britain has been running for a record TWO WEEKS without using coal to generate electricity – the first time this has happened since 1882.

The country’s grid has been coal-free for 45% of hours in 2019 so far.https://www.carbonbrief.org/countdown-to-2025-tracking-the-uk-coal-phase-out …

Coal generation was set for significant reductions around the world in 2019 – including a 20% reduction for the EU as a whole – according to analysis published by Carbon Brief in November.

Notably, overall UK electricity generation fell by another 9TWh in 2019 (3%), bringing the total decline to 58TWh since 2010. This is equivalent to more than twice the output from the Hinkley C scheme being built in Somerset. As Carbon Brief explained last year, falling demand has had a similar impact on electricity-sector CO2 emissions as the increase in output from renewables.

This is illustrated by the fact that the 9TWh reduction in overall generation translated into a 9TWh (6%) cut in fossil-fuel generation during 2019, with coal falling by 10TWh and gas rising marginally.

Increasingly renewable
As fossil-fuel output and overall generation have declined, the UK’s renewable sources of electricity have continued to increase. Their output has risen nearly five-fold in the past decade and their share of the UK total has increased from 7% in 2010 to 37% in 2019.

As a result, the UK’s increasingly renewable grid is seeing more minutes, hours and days during which the likes of wind, solar and biomass collectively outpace all fossil fuels put together, and on some days wind is the main source as well.

The chart below shows the number of days during each year when renewables generated more electricity than fossil fuels in 2019 (red line) and each of the previous four years (blue lines). In total, nearly two-fifths of days in 2019 crossed this threshold.

 Cumulative number of days when the UK has not generated any electricity from coal. Source: BEIS energy trends, BM Reports and Carbon Brief analysis. Chart by Carbon Brief using Highcharts.
There were also four months in 2019 when renewables generated more of the UK’s electricity than fossil fuels: March, August, September and December. The first ever such month came in September 2018 and more are certain to follow.

National Grid, which manages Great Britain’s high-voltage electricity transmission network, is aiming to be able to run the system without fossil fuels by 2025, at least for short periods. At present, it sometimes has to ask windfarm operators to switch off and gas plants to start running in order to keep the electricity grid stable.

Note that biomass accounted for 11% of UK electricity generation in 2019, nearly a third of the total from all renewables. Some two-thirds of the biomass output is from “plant biomass”, primarily wood pellets burnt at Lynemouth in Northumberland and the Drax plant in Yorkshire. The remainder was from an array of smaller sites based on landfill gas, sewage gas or anaerobic digestion.

The CCC says the UK should “move away” from large-scale biomass power plants, once existing subsidy contracts for Drax and Lynemouth expire in 2027.

Using biomass to generate electricity is not zero-carbon and in some circumstances could lead to higher emissions than from fossil fuels. Moreover, there are more valuable uses for the world’s limited supply of biomass feedstock, the CCC says, including carbon sequestration and hard-to-abate sectors with few alternatives.

Methodology
The figures in the article are from Carbon Brief analysis of data from BEIS Energy Trends chapter 5 and chapter 6, as well as from BM Reports. The figures from BM Reports are for electricity supplied to the grid in Great Britain only and are adjusted to include Northern Ireland.

In Carbon Brief’s analysis, the BM Reports numbers are also adjusted to account for electricity used by power plants on site and for generation by plants not connected to the high-voltage national grid. This includes many onshore windfarms, as well as industrial gas combined heat and power plants and those burning landfill gas, waste or sewage gas.

By design, the Carbon Brief analysis is intended to align as closely as possible to the official government figures on electricity generated in the UK, reported in BEIS Energy Trends table 5.1.

Briefly, the raw data for each fuel is in most cases adjusted with a multiplier, derived from the ratio between the reported BEIS numbers and unadjusted figures for previous quarters.

Carbon Brief’s method of analysis has been verified against published BEIS figures using “hindcasting”. This shows the estimates for total electricity generation from fossil fuels or renewables to have been within ±3% of the BEIS number in each quarter since Q4 2017. (Data before then is not sufficient to carry out the Carbon Brief analysis.)

For example, in the second quarter of 2019, a Carbon Brief hindcast estimates gas generation at 33.1TWh, whereas the published BEIS figure was 34.0TWh. Similarly, it produces an estimate of 27.4TWh for renewables, against a BEIS figure of 27.1TWh.

National Grid recently shared its own analysis for electricity in Great Britain during 2019 via its energy dashboard, which differs from Carbon Brief’s figures.


Related News

View more

The Haves and Have-Nots of Electricity in California

California Public Safety Power Shutoffs highlight wildfire prevention as PG&E outages disrupt schools, businesses, and rural communities, driving generator use, economic hardship, and emergency preparedness across Northern California during high-wind events.


Key Points

Utility outages to reduce wildfire risk during extreme winds, impacting homes and businesses in high-risk California.

✅ PG&E cuts power during high winds to prevent wildfires

✅ Costs rise for generators, fuel, batteries, and spoiled food

✅ Rural, low-income communities face greater economic losses


The intentional blackout by California’s largest utility this week put Forest Jones out of work and his son out of school. On Friday morning Mr. Jones, a handyman and single father, sat in his apartment above a tattoo parlor waiting for the power to come back on and for school to reopen.

“I’ll probably lose $400 or $500 dollars because of this,” said Mr. Jones, who lives in the town of Paradise, which was razed by fire last year and is slowly rebuilding. “Things have been really tough up here.”

Millions of people were affected by the blackout, which spanned the outskirts of Silicon Valley to the forests of Humboldt County near the Oregon border. But the outage, which the power company said was necessary to reduce wildfire risk across the region, also drew a line between those who were merely inconvenienced and those who faced a major financial hardship.

To have the lights on, the television running and kitchen appliances humming is often taken for granted in America, even as U.S. grid during coronavirus questions persisted. During California’s blackout it became an economic privilege.

The economic impacts of the shut-off were especially acute in rural, northern towns like Paradise, where incomes are a fraction of those in the San Francisco Bay Area.

Both wealthy and poorer areas were affected by the blackout but interviews across the state suggested that being forced off the grid disproportionately hurt the less affluent. One family in Humboldt County said they had spent $150 on batteries and water alone during the shutdown.

“To be prepared costs money,” Sue Warhaftig, a massage therapist who lives in Mill Valley, a wealthy suburb across the Golden Gate Bridge from San Francisco. Ms. Warhaftig spent around two days without electricity but said she had been spared from significant sacrifices during the blackout.

She invested in a generator to keep the refrigerator running and to provide some light. She cooked in the family’s Volkswagen camper van in her driveway. At night she watched Netflix on her phone, which she was able to charge with the generator. Her husband, a businessman, is in London on a work trip. Her two sons, both grown, live in Southern California and Seattle.

“We were inconvenienced but life wasn’t interrupted,” Ms. Warhaftig said. “But so many people’s lives were.

Pacific Gas & Electric restored power to large sections of Northern California on Friday, including Paradise, where the electricity came back on in the afternoon. But hundreds of thousands of people in other areas remained in the dark. The carcasses of burned cars still littered the landscape around Paradise, where 86 people died in the Camp Fire last year, some of them while trying to escape.

Officials at power company said that by Saturday they hoped to have restored power to 98 percent of the customers who were affected.

The same dangerous winds that spurred the shut-off in Northern California have put firefighters to work in the south. The authorities in Los Angeles County ordered the evacuation of nearly 100,000 people on Friday as the Saddleridge Fire burned nearly 5,000 acres and destroyed 25 structures. The Sandalwood Fire, which ignited Thursday in Riverside County, had spread to more than 800 acres and destroyed 74 structures by Friday afternoon.

While this week’s outage was the first time many customers in Northern California experienced a deliberate power shut-off, residents in and around Paradise have had their power cut four times in recent months, residents say.

Many use a generator, but running one has become increasingly expensive with gasoline now at more than $4 a gallon in California.

On Friday, Dennis and Viola Timmer drove up the hill to their home in Magalia, a town adjacent to Paradise, loaded with $102 dollars of gasoline for their generators. It was their second gasoline run since the power went out Tuesday night.

The couple, retired and on a fixed income after Mr. Timmer’s time in the Navy and in construction, said the power outage had severely limited their ability to do essential tasks like cooking, or to leave the house.

“You know what it feels like? You’re in jail,” said Ms. Timmer, 72. “You can’t go anywhere with the generators running.”

Since the generators are not powerful enough to run heat or air conditioning, the couple slept in their den with an electric space heater.

“It’s really difficult because you don’t have a normal life,” Ms. Timmer said. “You’re trying to survive.”

To be sure, the shutdown has affected many people regardless of economic status, and similar disruptions abroad, like a London power outage that disrupted routines, show how widespread such challenges can be. The areas without power were as diverse as the wealthy suburbs of Silicon Valley, the old Gold Rush towns of the Sierra Nevada, the East Bay of San Francisco and the seaside city of Arcata.

Ms. Cahn’s cellphone ran out of power during the blackout and even when she managed to recharge it in her car cell service was spotty, as it was in many areas hit by the blackout.

Accustomed to staying warm at night with an electric blanket, Ms. Cahn slept under a stack of four blankets.

“I’m doing what I have to do which is not doing very much,” she said.

Further south in Marin City, Chanay Jackson stood surrounded by fumes from generators still powering parts of the city.

She said that food stamps were issued on the first of the month and that many residents who had to throw away food were out of luck.

“They’re not going to issue more food stamps just because the power went out,” Ms. Jackson said. “So they’re just screwed until next month.”

Strong winds have many times in the past caused power lines to come in contact with vegetation, igniting fires that are then propelled by the gusts, and hurricanes elsewhere have crippled infrastructure with Louisiana grid rebuild after Laura according to state officials. This was the case with the Camp Fire.

Since higher elevations had more extreme winds many of the neighborhoods where power was turned off this week were in hills and canyons, including in the Sierra Nevada.

The shut-off, which by one estimate affected a total of 2.5 million people, has come under strong criticism by residents and politicians, and warnings from Cal ISO about rolling blackouts as the power grid strained. The company’s website crashed just as customers sought information about the outage. Gov. Gavin Newsom called it unacceptable. But his comments were nuanced, criticizing the way the shut-off was handled, not the rationale for it. Mr. Newsom and others said the ravages of the Camp Fire demanded preventive action to prevent a reoccurrence.

Yet the calculus of trying to avoid deadly fires by shutting off power will continue to be debated as California enters its peak wildfire season, even as electricity reliability during COVID-19 was generally maintained for most consumers.

In the city of Grass Valley, Matthew Gottschalk said he and his wife realized that a generator was essential when they calculated that they had around $500 worth of food in their fridge.

“I don’t know what we would have done,” said Mr. Gottschalk, whose power went out Tuesday night.

His neighbors are filling coolers with ice. Everyone is hoping the power will come back on soon.

“Ice is going to run out and gas is going to run out,” he said.


Related News

View more

Biden Imposes Higher Tariffs on Chinese Electric Cars and Solar Cells

U.S. Tariffs on Chinese EVs and Solar Cells target trade imbalances, subsidies, and intellectual property risks, bolstering domestic manufacturing, supply chains, and national security across clean energy, automotive technology, and renewable markets.


Key Points

Policy measures raising duties on Chinese EVs and solar cells to protect U.S. industry, IP, and national security.

✅ Raises duties to counter subsidies and IP risks

✅ Supports domestic EV and solar manufacturing jobs

✅ May reshape supply chains, prices, and trade flows


In a significant move aimed at bolstering domestic industries and addressing trade imbalances, the Biden administration has announced higher tariffs on Chinese-made electric cars and solar cells. This decision marks a strategic shift in U.S. trade policy, with market observers noting EV tariffs alongside industrial and financial implications across sectors today.

Tariffs on Electric Cars

The imposition of tariffs on Chinese electric cars comes amidst growing competition in the global electric vehicle (EV) market. U.S. automakers and policymakers have raised concerns about unfair trade practices, subsidies, and market access barriers faced by American EV manufacturers in China amid escalating trade tensions with key partners. The tariffs aim to level the playing field and protect U.S. interests in the burgeoning electric vehicle sector.

Impact on Solar Cells

Similarly, higher tariffs on Chinese solar cells address concerns regarding intellectual property theft, subsidies, and market distortions in the solar energy industry, where tariff threats have influenced investment signals across North American markets.

The U.S. solar sector, a key player in renewable energy development, has called for measures to safeguard fair competition and promote domestic manufacturing of solar technologies.

Economic and Political Implications

The tariff hikes underscore broader economic tensions between the United States and China, spanning trade, technology, and geopolitical issues. While aimed at protecting American industries, these tariffs could lead to retaliatory measures from China and impact global supply chains, particularly in renewable energy and automotive sectors, as North American electricity exports at risk add to uncertainty across markets.

Industry and Market Responses

Industry stakeholders have responded with mixed reactions to the tariff announcements. U.S. automakers and solar manufacturers supportive of the tariffs argue they will help level the playing field and encourage domestic production. However, critics warn of potential energy price spikes for consumers, supply chain disruptions, and unintended consequences for global clean energy goals.

Strategic Considerations

The Biden administration's tariff policy reflects a broader strategy to promote economic resilience, innovation, and national security in critical industries, even as cross-border electricity exports become flashpoints in trade policy debates today.

Efforts to strengthen domestic supply chains, invest in renewable energy infrastructure, and foster international partnerships remain central to U.S. economic competitiveness and climate objectives.

Future Outlook

Looking ahead, navigating U.S.-China trade relations will continue to be a complex challenge for policymakers. Balancing economic interests, diplomatic engagements, and environmental priorities, alongside regional public support for tariffs, will shape future trade policy decisions affecting electric vehicles, renewable energy, and technology sectors globally.

Conclusion

The Biden administration's decision to impose higher tariffs on Chinese electric cars and solar cells represents a strategic response to economic and geopolitical dynamics reshaping global markets. While aimed at protecting American industries and promoting fair trade practices, the tariffs signal a commitment to fostering competitiveness, innovation, and sustainability in critical sectors of the economy. As these measures unfold, stakeholders will monitor their impact on industry dynamics, supply chain resilience, and international trade relations in the evolving landscape of global commerce.


Related News

View more

U.S. Electricity Sales Projections Continue to Fall

US Electricity Demand Outlook examines EIA forecasts, GDP decoupling, energy efficiency, electrification, electric vehicles, grid load growth, and weather variability to frame long term demand trends and utility planning scenarios.


Key Points

An analysis of EIA projections showing demand decoupling from GDP, with EV adoption and efficiency shaping future grid load.

✅ EIA lowers load growth; demand decouples from GDP.

✅ Efficiency and sector shifts depress kWh sales.

✅ EV adoption could revive load and capacity needs.


Electricity producers and distributors are in an unusual business. The product they provide is available to all customers instantaneously, literally at the flip of a switch. But the large amount of equipment, both hardware and software to do this takes years to design, site and install.

From a long range planning perspective, just as important as a good engineering design is an accurate sales projections. For the US electric utility industry the most authoritative electricity demand projec-tions come from the Department of Energy’s Energy Information Administration (EIA). EIA's compre-hensive reports combine econometric analysis with judgment calls on social and economic trends like the adoption rate of new technologies that could affect future electricity demand, things like LED light-ing and battery powered cars, and the rise of renewables overtaking coal in generation.

Before the Great Recession almost a decade ago, the EIA projected annual growth in US electricity production at roughly 1.5 percent per year. After the Great Recession began, the EIA lowered its projections of US electricity consumption growth to below 1 percent. Actual growth has been closer to zero. While the EIA did not antici-pate the last recession or its aftermath, we cannot fault them on that.

After the event, though, the EIA also trimmed its estimates of economic growth. For the 2015-2030 period it now predicts 2.1 percent economic and 0.3 percent electricity growth, down from previously projections of 2.7 percent and 1.3 percent respectively. (See Figures 1 and 2.)


Table 1. EIA electric generation projections by year of forecast (kWh billions)


Table 2. EIA forecast of GDP by year of forecast (billion 2009 $)

Back in 2007, the EIA figured that every one percent increase in economic activity required a 0.48 percent in-crease in electric generation to support it. By 2017, the EIA calculated that a 1 percent growth in economic activity now only required a 0.14 percent increase in electric output. What accounts for such a downgrade or disconnect between electricity usage and economic growth? And what factors might turn the numbers 
around?

First, the US economy lost energy intensive heavy industry like smelting, steel mills and refineries; patterns in China's electricity sector highlight how industrial shifts can reshape power demand. A more service oriented economy (think health care) relies more heavily on the movement of data or information and uses far less power than a manufacturing-oriented economy.

A small volcano in Argentina is about to fuel the next tech boom – and a little known company is going to be right at the center. Early investors stand to gain incredible profits and you can too. Read the report.

Second, internet shopping has hurt so-called "brick and mortar" retailers. Despite the departure of heavy industry, in years past a burgeoning US commercial sector increased its demand and usage of electricity to offset the industrial decline. But not anymore. Energy efficiency measures as well as per-haps greater concern about global warming and greenhouse gas emissions and have cut into electricity sales. “Do more with less” has the right ring to it.

But there may be other components to the ongoing decline in electricity usage. Academic studies show that electricity usage seems to increase with income along an S curve, and flattens out after a certain income level. That is, if you earn $1 billion per year you do not (or cannot) use ten times a much electricity as someone earning only $100 million.

But people at typical, middle income levels increase or decrease electricity usage when incomes rise or fall. The squeeze on middle income families was discussed often in the late presidential campaign. In recent decades an increasing percentage of income has gone to a small percentage of the population at the top of the income scale. This trend probably accounts for some weakness in residential sales. This suggests that government policy addressing income inequality would also boost electricity sales.

Population growth affects demand for electricity as well as the economy as a whole. The EIA has made few changes in its projections, showing 0.7 percent per year population growth in 2015- 2030 in both the 2007 and 2017 forecasts. Recent studies, however, have shown a drop in the birth rate to record lows. More troubling, from a national health perspective is that the average age of death may have stopped rising. Those two factors point to lower population growth, especially if the government also restricts immi-gration. Thus, the US may be approaching a period of rather modest population growth.

All of the above factors point to minimal sales growth for electricity producers in the US--perhaps even lower than the seemingly conservative EIA estimates. But the cloud on the horizon has a silver lining in the shape of an electric car. Both the United Kingdom and France have set dates to end of production of automobiles with internal combustion engines. Several European car makers have declared that 20 percent of their output will be electric vehicles by the early 2020s. If we adopt automobiles powered by electricity and not gasoline or diesel, electricity sales would increase by one third. For the power indus-try, electric vehicles represent the next big thing.

We don’t pretend to know how electric car sales will progress. But assume vehicle turnover rates re-main at the current 7 percent per year and electric cars account for 5 percent of sales in the first five years (as op-posed to 1 percent now), 20 percent in the next five years and 50 percent in the third five year period. Wildly optimistic assumptions? Maybe. By 2030, electric cars would constitute 28 percent of the vehicle fleet. They would add about 10 percent to kilowatt hour sales by that date, assuming that battery efficiencies do not improved by then. Those added sales would require increased electric generation output, with low-emissions sources expected to cover almost all the growth globally. They would also raise long term growth rates for 2015-2030 from the present 0.3 percent to 1.0 percent. The slow upturn in demand should give the electric companies time to gear up so to speak.

In the meantime, weather will continue to play a big role in electricity consumption. Record heat-induced demand peaks are being set here in the US even as surging global demand puts power systems under strain worldwide.

Can we discern a pattern in weather conditions 15 years out? Maybe we can, but that is one topic we don’t expect a government agency to tackle in public right now. Meantime, weather will affect sales more than anything else and we cannot predict the weather. Or can we?


Related News

View more

Kenya Power on the spot over inflated electricity bills

Kenya Power token glitches, inflated bills disrupt prepaid meters via M-Pesa paybill 888880 and third-party vendors like Vendit and Dynamo, causing delays, fast-depleting tokens, and billing estimates; customers report weekend outages and business losses.


Key Points

Service failures delaying token generation and disputed charges from estimated meter readings and slow processing.

✅ Impacts M-Pesa paybill 888880 and authorized third-party vendors

✅ Causes delays, fast-depleting tokens, weekend business closures

✅ Linked to system downtime, billing estimates, meter reading gaps


Kenya Power is again on the spotlight following claims of inflated power bills and a glitch in its electronic payment system that made it impossible to top up tokens on prepaid meters.

Thousands of customers started experiencing the hitch in tokens generation on Friday evening, with the problem extending through the weekend.

Small businesses such as barber shops that top up multiple times a week were hardest hit.

“My business usually thrives during weekends but I was forced to close early in the evening due to lack of power although I had paid for the tokens that were never generated,” said Mr John Kamau, a fast food restaurant owner in Nairobi.

Kenya Power processes up to 200,000 electronic transactions per day for power users, with 85 per cent done through its Safaricom M-Pesa paybill number 888880.

The remaining share is handled by its authorised third party vendors such as Vendit (paybill number 501200) and Dynamo (800904), which charge a premium for the transaction.

The sole electricity distributor admitted its system encountered challenges that crippled token generation across all vendors, advising customers on prepaid meters to buy the units from Kenya Power banking halls across the country until normalcy returned.


STATEMENT

“The IT team is trying to figure out where the problem was before we issue a comprehensive statement on the issue,” the firm responded to Nation queries, adding that the issue had been resolved by yesterday afternoon.

Customers who use Vendit confirmed to Nation they had successfully bought tokens yesterday afternoon.

However, there have been complaints that third party vendors process tokens almost in real time, unlike Kenya Power which, despite indicating a 30 minute delay in its service promise, sometimes takes up to six hours.  

But other users complained of inflated power bills after being slapped with abnormally high charges.


TOKENS

The holder of account number 30624694, for instance, received a post-paid bill of Sh16,765 last month, up from Sh894 the previous month.

She indulged the company and ended up paying just over Sh1,000.

There have also been complaints of tokens getting depleted too fast. For instance, one customer who normally uses Sh4,000 per month complained of her credit running out in a week.

Kenya Power maintains it cannot read all post-paid meters across the country, compelling it to make estimates for a number of customers.

The company argues it is not cost-effective to have meter readers go to all homes. The firm recently indicated plans to put all domestic consumers on prepaid meters to reduce non-payment of electricity bills and cut operation costs on meter reading and postage.


POWER CONSUMPTION

The Nairobi Securities Exchange-listed firm has also adopted a new integrated customer management system to enable consumers to self-check their power consumption and understand their electricity bill and payment obligations through a phone app.

In the past, concerns have been rife that customers often encounter delays when buying tokens through paybill number 888880, unlike through other vendors.

This has raised questions on the ownership of the vendors and the cash commissions they are entitled to, with holiday scam warnings circulating in some markets as well.


FOUL PLAY

Kenya Power has, however, denied any foul play, saying the authorisation of other vendors was to ease pressure on its payment channel, which handles 85 per cent of the nearly 200,000 transactions per day.

“In fact we have 11 vendors, including Equitel, it’s just that people are only aware of Vendit and Dynamo because they have been aggressive in their marketing,” the company said.

Kenya Power has been battling court cases over inflated power bills after it emerged that the utility firm was backdating bills worth Sh10.1 billion from last November.


Related News

View more

Hydro One reports $1.1B Q2 profit boosted by one-time gain due to court ruling

Hydro One Q2 Earnings surge on a one-time gain from a court ruling on a deferred tax asset, lifting profit, revenue, and adjusted EPS at Ontario's largest utility regulated by the Ontario Energy Board.


Key Points

Hydro One Q2 earnings jumped on an $867M court gain, with revenue at $1.67B and adjusted EPS improving to $0.39.

✅ One-time gain: $867M from tax appeal ruling.

✅ Revenue: $1.67B vs $1.41B last year.

✅ Adjusted EPS: $0.39 vs $0.26.


Hydro One Ltd., following the Peterborough Distribution sale transaction closing, reported a second-quarter profit of $1.1 billion, boosted by a one-time gain related to a court decision.

The power utility says it saw a one-time gain of $867 million in the quarter due to an Ontario court ruling on a deferred tax asset appeal that set aside an Ontario Energy Board decision earlier.

Hydro One says the profit amounted to $1.84 per share for the quarter ended June 30, amid investor concerns about uncertainties, up from $155 million or 26 cents per share a year earlier.

Shares also moved lower after the Ontario government announced leadership changes, as seen when Hydro One shares fell on the news in prior trading.

On an adjusted basis, it says it earned 39 cents per share for the quarter, despite earlier profit plunge headlines, up from an adjusted profit of 26 cents per share in the same quarter last year.

Revenue totalled $1.67 billion, up from $1.41 billion in the second quarter of 2019, while other Canadian utilities like Manitoba Hydro face heavy debt burdens.

Hydro One is Ontario’s largest electricity transmission and distribution provider, and its CEO compensation has drawn scrutiny in the province.


Related News

View more

Sign Up for Electricity Forum’s Newsletter

Stay informed with our FREE Newsletter — get the latest news, breakthrough technologies, and expert insights, delivered straight to your inbox.

Electricity Today T&D Magazine Subscribe for FREE

Stay informed with the latest T&D policies and technologies.
  • Timely insights from industry experts
  • Practical solutions T&D engineers
  • Free access to every issue

Download the 2025 Electrical Training Catalog

Explore 50+ live, expert-led electrical training courses –

  • Interactive
  • Flexible
  • CEU-cerified