ATC completes HV transmission line

By Business Wire


Substation Relay Protection Training

Our customized live online or in‑person group training can be delivered to your staff at your location.

  • Live Online
  • 12 hours Instructor-led
  • Group Training Available
Regular Price:
$699
Coupon Price:
$599
Reserve Your Seat Today
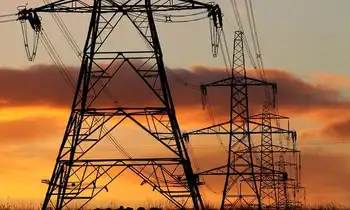
American Transmission Co. has put into service a new, 35-mile high-voltage electric transmission line in south central Wisconsin that provides local electric utilities with improved access to the regional energy market to buy and sell electricity when it is economic to do so.

The 345-kilovolt circuit was built on an existing transmission line right-of-way between the Rockdale Substation in the Town of Christiana in Dane County and the Paddock Substation located in the Town of Beloit in Rock County. The lines that extend south out of the Paddock Substation into Illinois create a path for importing power into Wisconsin.

“Completion of this project is a significant milestone,” said Flora Flygt, director of Transmission Planning. Paddock-Rockdale is the first transmission line project within the footprint of the Midwest Independent System Operator that was justified on economics. Until this project, transmission lines in the region have almost exclusively been built to enhance reliability of electric power in the area. Although improved reliability will be a by-product of the project, economics drove the decision to build.

Flygt said, “The primary benefit of this line is local electric distribution companies now have greater ability to participate in the wholesale electricity market.” She explains, “Wisconsin has fewer transmission line connections to other states compared with its neighboring states. This transmission congestion limits the ability of electric utilities to access the market to purchase lower-cost electricity when prices are lower and sell into the market when prices are higher. The economic benefits of enhanced access can be passed on to end-use customers. The Paddock-Rockdale project provides the needed transmission capacity for today’s energy marketplace, especially with the growing movement toward renewable energy.”

The Paddock-Rockdale project was completed ahead of schedule, and within the approved $133 million budget. Anticipated savings from the project are expected to more than pay for its development.

During construction of the line, ATC took careful consideration of the cost and the environment, using a helicopter for a portion of the work to expedite stringing wire and installing components. By accessing the line via helicopter, fewer timber mats were placed as temporary roads for construction equipment on the ground. As a result, soil disturbance was minimized, which makes restoration work following completion of construction easier and less costly. Restoration will continue throughout the spring and summer.

Related News

Avista Commissions Largest Solar Array in Washington

Adams Nielson Solar Array, a 28 MW DC utility-scale project in Lind, WA, spans 200 acres with 81,700 panels, powering about 4,000 homes, supporting Avista’s Solar Select program and renewable energy, sustainability, and carbon reduction.


Key Points

Adams Nielson Solar Array is a 28 MW DC facility in Lind, WA, powering ~4,000 homes via Avista’s Solar Select.

✅ 81,700 panels across 200 acres in Eastern Washington

✅ Offsets emissions equal to removing 7,300 cars annually

✅ Collaboration by Avista, Strata Solar, WUTC, WSU Energy


Official commissioning of the Adams Nielson solar array located in Lind, WA occurred today. The 28 Megawatt DC array is comprised of 81,700 panels that span 200 acres and generates enough electricity to supply the equivalent of approximately 4,000 homes annually, similar to a new co-op solar project serving South Metro members.

“Avista’s interest in the development of Solar Select, a voluntary commercial solar program reflecting broader corporate adoption such as a corporate solar power plant commissioned by Arvato, is consistent with the Company’s ongoing commitment to provide customers with renewable energy choices at reasonable cost,” said Dennis Vermillion, president, Avista Corporation. “In recent years, an increasing number of Avista customers have expressed their expectations and challenges in acquiring renewable energy. Avista is pleased to lead this effort and develop renewable energy products that meet our customers’ needs today and into the future.” This interest is being generated by a mix of local and national customers across a variety of industries, including Huckleberry’s, Gonzaga University, Community Colleges of Spokane, Hotstart, Central Pre-Mix Concrete, a CRH Co., independently owned McDonald's franchise locations, Spokane City, Main Market and Community Building and VA Medical Center.

Jim Simon, director of sustainability at Gonzaga University said, “The Solar Select program helps Gonzaga University move even closer to achieving its goal of climate neutrality by 2050 by continuing to prioritize renewables in our energy portfolio, as other communities add projects like a municipal solar project to boost local supply. We are grateful for Avista’s leadership in this project and look forward to other opportunities to reduce our greenhouse gas emissions.”

Spokane Mayor David Condon said, “The City of Spokane is pleased to partner with Avista through the Solar Select Program, as we continue to seek out opportunities that are both environmentally and financially responsible. The City already is a net producer of energy, generating more clean, green energy than our use of electricity, natural gas, and fuel, a milestone also seen with North Carolina's first wind farm now fully operational. We are excited to add even more clean energy to power City Hall.”

The Solar Select program created a cost-effective structure to bring solar energy to large business customers in Eastern Washington, allowing them to advance their desired sustainability goals and benefiting from industry service innovations led by companies like Omnidian expanding their global reach. The array is projected to deliver the environmental benefit equivalent of more than 7,300 cars removed from the road each year. This renewable energy program was made possible through a collaboration of Avista, Strata Solar, the Washington Utilities and Transportation Commission, and the WSU Energy Program. 


Related News

View more

In Europe, A Push For Electricity To Solve The Climate Dilemma

EU Electrification Strategy 2050 outlines shifting transport, buildings, and industry to clean power, accelerating EV adoption, heat pumps, and direct electrification to meet targets, reduce emissions, and replace fossil fuels with renewables and low-carbon grids.


Key Points

EU plan to cut emissions 95% by 2050 by electrifying transport, buildings and industry with clean power.

✅ 60% of final energy from electricity by 2050

✅ EVs dominate transport; up to 63% electric share

✅ Heat pumps electrify buildings; industry to 50% direct


The European Union has one of the most ambitious carbon emission reduction goals under the global Paris Agreement on climate change – a 95% reduction by 2050.

It seems that everyone has an idea for how to get there. Some are pushing nuclear energy. Others are pushing for a complete phase-out of fossil fuels and a switch to renewables.

Today the European electricity industry came out with their own plan, amid expectations of greater electricity price volatility in Europe in the coming years. A study published today by Eurelectric, the trade body of the European power sector, concludes that the 2050 goal will not be possible without a major shift to electricity in transport, buildings and industry.

The study finds that for the EU to reach its 95% emissions reduction target, electricity needs to cover at least 60 percent of final energy consumption by 2050. This would require a 1.5 percent year-on-year growth of EU electricity use, with evidence that EVs could raise electricity demand significantly in other markets, while at the same time reducing the EU’s overall energy consumption by 1.3 percent per year.

#google#

Transport is one of the areas where electrification can deliver the most benefit, because an electric car causes far less carbon emissions than a conventional vehicle, with e-mobility emerging as a key driver of electricity demand even if that electricity is generated in a fossil fuel power plant.

In the most ambitious scenario presented by the study, up to 63 percent of total final energy consumption in transport will be electric by 2050, and some analyses suggest that mass adoption of electric cars could occur much sooner, further accelerating progress.

Building have big potential as well, according to the study, with 45 to 63 percent of buildings energy consumption could be electric in 2050 by converting to electric heat pumps. Industrial processes could technically be electrified with up to 50 percent direct electrification in 2050, according to the study. The relative competitiveness of electricity against other carbon-neutral fuels will be the critical driver for this shift, but grid carbon intensity differs across markets, such as where fossil fuels still supply a notable share of generation.


Related News

View more

IAEA - COVID-19 and Low Carbon Electricity Lessons for the Future

Nuclear Power Resilience During COVID-19 shows low-carbon electricity supporting renewables integration with grid flexibility, reliability, and inertia, sustaining decarbonization, stable baseload, and system security while prices fell and demand dropped across markets.


Key Points

It shows nuclear plants providing reliable, low-carbon power and supporting grid stability despite demand declines.

✅ Low prices challenge investment; lifetime extensions are cost-effective.

✅ Nuclear provides inertia, reliability, and dispatchable capacity.

✅ Market reforms should reward flexibility and grid services.


The COVID-19 pandemic has transformed the operation of power systems across the globe, including European responses that many argue accelerated the transition, and offered a glimpse of a future electricity mix dominated by low carbon sources.

The performance of nuclear power, in particular, demonstrates how it can support the transition to a resilient, clean energy system well beyond the COVID-19 recovery phase, and its role in net-zero pathways is increasingly highlighted by analysts today.

Restrictions on economic and social activity during the COVID-19 outbreak have led to an unprecedented and sustained decline in demand for electricity in many countries, in the order of 10% or more relative to 2019 levels over a period of a few months, thereby creating challenging conditions for both electricity generators and system operators (Fig. 1). The recent Sustainable Recovery Report by the International Energy Agency (IEA) projects a 5% reduction in global electricity usage for the entire year 2020, with a record 5.7% decline foreseen in the United States alone. The sustainable economic recovery will be discussed at today's IEA Clean Energy Transitions Summit, where Fatih Birol's call to keep options open will be prominent as IAEA Director General Rafael Mariano Grossi participates.

Electricity generation from fossil fuels has been hard hit, due to relatively high operating costs compared to nuclear power and renewables, as well as simple price-setting mechanisms on electricity markets. By contrast, low-carbon electricity prevailed during these extraordinary circumstances, with the contribution of renewable electricity rising in a number of countries as analyses see renewables eclipsing coal by 2025, due to an obligation on transmission system operators to schedule and dispatch renewable electricity ahead of other generators, as well as due to favourable weather conditions.

Nuclear power generation also proved to be resilient, reliable and adaptable. The nuclear industry rapidly implemented special measures to cope with the pandemic, avoiding the need to shut down plants due to the effects of COVID-19 on the workforce or supply chains. Nuclear generators also swiftly adapted to the changed market conditions. For example, EDF Energy was able to respond to the need of the UK grid operator by curtailing sporadically the generation of its Sizewell B reactor and maintain a cost-efficient and secure electricity service for consumers.

Despite the nuclear industry's performance during the pandemic, faced with significant decreases in demand, many generators have still needed to reduce their overall output appreciably, for example in France, Sweden, Ukraine, the UK and to a lesser extent Germany (Fig. 2), even as the nuclear decline debate continues in Europe. Declining demand in France up to the end of March already contributed to a 1% drop in first quarter revenues at EDF, with nuclear output more than 9% lower than in the year before. Similarly, Russia's Rosatom experienced a significant demand contraction in April and May, contributing to an 11% decline in revenues for the first five months of the year.

Overall, the competitiveness and resilience of low carbon technologies have resulted in higher market shares for nuclear, solar and wind power in many countries since the start of lockdowns (Fig. 3), and low-emissions sources to meet demand growth over the next three years. The share of nuclear generation in South Korea rose by almost 9 percentage points during the pandemic, while in the UK, nuclear played a big part in almost eliminating coal generation for a period of two months. For the whole of 2020, the US Energy Information Administration's Short-Term Energy Outlook sees the share of nuclear generation increasing by more than one percentage point compared to 2019. In China, power production decreased during January-February 2020 by more than 8% year on year: coal power decreased by nearly 9%, hydropower by nearly 12%. Nuclear has proved more resilient with a 2% reduction only. The benefits of these higher shares of clean energy in terms of reduced emissions of greenhouse gases and other air pollutants have been on full display worldwide over the past months.

Challenges for the future

Despite the demonstrated performance of a cleaner energy system through the crisis - including the capacity of existing nuclear power plants to deliver a competitive, reliable, and low carbon electricity service when needed - both short- and long-term challenges remain.

In the shorter term, the collapse in electricity demand has accelerated recent falls in electricity prices, particularly in Europe (Fig. 4), from already economically unsustainable levels. According to Standard and Poor's Midyear Update, the large price drops in Europe result from not only COVID-19 lockdown measures but also collapsing demand due to an unusually warm winter, increased supply from renewables in a context of lower gas prices and CO2 allowances . Such low prices further exacerbate the challenging environment faced by many electricity generators, including nuclear plants. These may impede the required investments in the clean energy transition, with longer term consequences on the achievement of climate goals.

For nuclear power, maintaining and extending the operation of existing plants is essential to support and accelerate the transition to low carbon energy systems. With a supportive investment environment, a 10-20 year lifetime extension can be realized at an average cost of US $30-40/MW*h, making it among the most cost-effective low-carbon options, while also maintaining dispatchable capacity and lowering the overall cost of the clean energy transition. The IEA Sustainable Recovery report indicates that without such extensions 40% of the nuclear fleet in developed economies may be retired within a decade, adding around US$ 80 billion per year to electricity bills. The IEA note the potential for nuclear plant maintenance and extension programmes to support recovery measures by generating significant economic activity and employment.

The need for flexibility

New nuclear power projects can provide similar economic and environmental benefits and applications beyond electricity, but will be all the more challenging to finance without strong policy support and more substantive power market reforms, including improved frameworks for remunerating reliability, flexibility and other services. The need for flexibility in electricity generation and system operation - a trend accelerated by the crisis - will increasingly characterize future energy systems over the medium to longer term.

Looking further ahead, while generators and system operators successfully responded to the crisis, the observed decline in fossil fuel generation draws attention to additional grid stability challenges likely to emerge further into the energy transition. Heavy rotating steam and gas turbines provide mechanical inertia to an electricity system, thereby maintaining its balance. Replacing these capacities with variable renewables may result in greater instability, poorer power quality and increased incidence of blackouts. Large nuclear power plants along with other technologies can fill this role, alleviating the risk of supply disruptions in fully decarbonized electricity systems.

The challenges created by COVID-19 have also brought into focus the need to ensure resilience is built-in to future energy systems to cope with a broader range of external shocks, including more variable and extreme weather patterns expected from climate change.

The performance of nuclear power during the crisis provides a timely reminder of its ongoing contribution and future potential in creating a more sustainable, reliable, low carbon energy system.

Data sources for electricity demand, generation and prices: European Network of Transmission System Operators for Electricity (Europe), Ukrenergo National Power Company (Ukraine), Power System Operation Corporation (India), Korea Power Exchange (South Korea), Operador Nacional do Sistema Eletrico (Brazil), Independent Electricity System Operator (Ontario, Canada), EIA (USA). Data cover 1 January to May/June.


Related News

View more

Which of the cleaner states imports dirty electricity?

Hourly Electricity Emissions Tracking maps grid balancing areas, embodied emissions, and imports/exports, revealing carbon intensity shifts across PJM, ERCOT, and California ISO, and clarifying renewable energy versus coal impacts on health and climate.


Key Points

An hourly method tracing generation, flows, and embodied emissions to quantify carbon intensity across US balancing areas.

✅ Hourly traces of imports/exports and generation mix

✅ Consumption-based carbon intensity by balancing area

✅ Policy insights for renewables, coal, health costs


In the United States, electricity generation accounts for nearly 30% of our carbon emissions. Some states have responded to that by setting aggressive renewable energy standards; others are hoping to see coal propped up even as its economics get worse. Complicating matters further is the fact that many regional grids are integrated, and as America goes electric the stakes grow, meaning power generated in one location may be exported and used in a different state entirely.

Tracking these electricity exports is critical for understanding how to lower our national carbon emissions. In addition, power from a dirty source like coal has health and environment impacts where it's produced, and the costs of these aren't always paid by the parties using the electricity. Unfortunately, getting reliable figures on how electricity is produced and where it's used is challenging, even for consumers trying to find where their electricity comes from in the first place, leaving some of the best estimates with a time resolution of only a month.

Now, three Stanford researchers—Jacques A. de Chalendar, John Taggart, and Sally M. Benson—have greatly improved on that standard, and they have managed to track power generation and use on an hourly basis. The researchers found that, of the 66 grid balancing areas within the United States, only three have carbon emissions equivalent to our national average, and they have found that imports and exports of electricity have both seasonal and daily changes. de Chalendar et al. discovered that the net results can be substantial, with imported electricity increasing California's emissions/power by 20%.

Hour by hour
To figure out the US energy trading landscape, the researchers obtained 2016 data for grid features called balancing areas. The continental US has 66 of these, providing much better spatial resolution on the data than the larger grid subdivisions. This doesn't cover everything—several balancing areas in Canada and Mexico are tied in to the US grid—and some of these balancing areas are much larger than others. The PJM grid, serving Pennsylvania, New Jersey, and Maryland, for example, is more than twice as large as Texas' ERCOT, in a state that produces and consumes the most electricity in the US.

Despite these limitations, it's possible to get hourly figures on how much electricity was generated, what was used to produce it, and whether it was used locally or exported to another balancing area. Information on the generating sources allowed the researchers to attach an emissions figure to each unit of electricity produced. Coal, for example, produces double the emissions of natural gas, which in turn produces more than an order of magnitude more carbon dioxide than the manufacturing of solar, wind, or hydro facilities. These figures were turned into what the authors call "embodied emissions" that can be traced to where they're eventually used.

Similar figures were also generated for sulfur dioxide and nitrogen oxides. Released by the burning of fossil fuels, these can both influence the global climate and produce local health problems.

Huge variation
The results were striking. "The consumption-based carbon intensity of electricity varies by almost an order of magnitude across the different regions in the US electricity system," the authors conclude. The low is the Bonneville Power grid region, which is largely supplied by hydropower; it has typical emissions below 100kg of carbon dioxide per megawatt-hour. The highest emissions come in the Ohio Valley Electric region, where emissions clear 900kg/MW-hr. Only three regional grids match the overall grid emissions intensity, although that includes the very large PJM (where capacity auction payouts recently fell), ERCOT, and Southern Co balancing areas.

Most of the low-emissions power that's exported comes from the Pacific Northwest's abundant hydropower, while the Rocky Mountains area exports electricity with the highest associated emissions. That leads to some striking asymmetries. Local generation in the hydro-rich Idaho Power Company has embodied emissions of only 71kg/MW-hr, while its imports, coming primarily from Rocky Mountain states, have a carbon content of 625kg/MW-hr.

The reliance on hydropower also makes the asymmetry seasonal. Local generation is highest in the spring as snow melts, but imports become a larger source outside this time of year. As solar and wind can also have pronounced seasonal shifts, similar changes will likely be seen as these become larger contributors to many of these regional grids. Similar things occur daily, as both demand and solar production (and, to a lesser extent, wind) have distinct daily profiles.

The Golden State
California's CISO provides another instructive case. Imports represent less than 30% of its total electric use in 2016, yet California electricity imports provided 40% of its embodied emissions. Some of these, however, come internally from California, provided by the Los Angeles Department of Water and Power. The state itself, however, has only had limited tracking of imported emissions, lumping many of its sources as "other," and has been exporting its energy policies to Western states in ways that shape regional markets.

Overall, the 2016 inventory provides a narrow picture of the US grid, as plenty of trends are rapidly changing our country's emissions profile, including the rise of renewables and the widespread adoption of efficiency measures and other utility trends in 2017 that continue to evolve. The method developed here can, however, allow for annual updates, providing us with a much better picture of trends. That could be quite valuable to track things like how the rapid rise in solar power is altering the daily production of clean power.

More significantly, it provides a basis for more informed policymaking. States that wish to promote low-emissions power can use the information here to either alter the source of their imports or to encourage the sites where they're produced to adopt more renewable power. And those states that are exporting electricity produced primarily through fossil fuels could ensure that the locations where the power is used pay a price that includes the health costs of its production.


Related News

View more

Major U.S. utilities spending more on electricity delivery, less on power production

U.S. Utility Spending Shift highlights rising transmission and distribution costs, grid modernization, and smart meters, while generation expenses decline amid fuel price volatility, capital and labor pressures, and renewable integration across the power sector.


Key Points

A decade-long trend where utilities spend more on delivery and grid upgrades, and less on electricity generation costs.

✅ Delivery O&M, wires, poles, and meters drive rising costs

✅ Generation spending declines amid fuel price changes and PPI

✅ Grid upgrades add reliability, resilience, and renewable integration


Over the past decade, major utilities in the United States have been spending more on delivering electricity to customers and less on producing that electricity, a shift occurring as electricity demand is flat across many regions.

After adjusting for inflation, major utilities spent 2.6 cents per kilowatthour (kWh) on electricity delivery in 2010, using 2020 dollars. In comparison, spending on delivery was 65% higher in 2020 at 4.3 cents/kWh, and residential bills rose in 2022 as inflation persisted. Conversely, utility spending on power production decreased from 6.8 cents/kWh in 2010 (using 2020 dollars) to 4.6 cents/kWh in 2020.

Utility spending on electricity delivery includes the money spent to build, operate, and maintain the electric wires, poles, towers, and meters that make up the transmission and distribution system. In real 2020 dollar terms, spending on electricity delivery increased every year from 1998 to 2020 as utilities worked to replace aging equipment, build transmission infrastructure to accommodate new wind and solar generation amid clean energy transition challenges that affect costs, and install new technologies such as smart meters to increase the efficiency, reliability, resilience, and security of the U.S. power grid.

Spending on power production includes the money spent to build, operate, fuel, and maintain power plants, as well as the cost to purchase power in cases where the utility either does not own generators or does not generate enough to fulfill customer demand. Spending on electricity production includes the cost of fuels including natural gas prices alongside capital, labor, and building materials, as well as the type of generators being built.

Other utility spending on electricity includes general and administrative expenses, general infrastructure such as office space, and spending on intangible goods such as licenses and franchise fees, even as electricity sales declined in recent years.

The retail price of electricity reflects the cost to produce and deliver power, the rate of return on investment that regulated utilities are allowed, and profits for unregulated power suppliers, and, as electricity prices at 41-year high have been reported, these components have drawn increased scrutiny.

In 2021, demand for consumer goods and the energy needed to produce them has been outpacing supply, though power demand sliding in 2023 with milder weather has also been noted. This difference has contributed to higher prices for fuels used by electric generators, especially natural gas. The increased cost for fuel, capital, labor, and building materials, as seen in the U.S. Bureau of Labor Statistics’ Producer Price Index, is increasing the cost of power production for 2021. U.S. average electricity prices have been higher every month of this year compared with 2020, according to our Monthly Electric Power Industry Report.


Related News

View more

Hydro One extends ban on electricity disconnections until further notice

Hydro One Disconnection Ban Extension keeps Ontario electricity customers connected during COVID-19, extending the moratorium on power shutoffs and expanding financial relief programs amid ongoing pandemic restrictions and persistent hot weather across the province.


Key Points

An open-ended Ontario utility moratorium preventing residential power shutoffs and offering bill relief during COVID-19.

✅ No residential disconnections until further notice

✅ Extended bill assistance and flexible payment options

✅ Response to COVID-19 restrictions and extreme heat


Ontario's primary electricity provider says it's extending a ban on disconnecting homes from the power grid until further notice.

Hydro One first issued the ban towards the beginning of the province's COVID-19 outbreak, saying self-isolating customers needed to be able to rely on electricity while they were kept at home during the pandemic.

A spokesman for the utility says the ban was initially set to expire at the end of July, but has now been extended in a manner similar to winter disconnection bans without a fixed end-date.

Hydro One says the move is necessary given the ongoing restrictions posed by the pandemic, and notes it has supported provincial COVID-19 efforts in recent months, as well as persistent hot weather across much of the province.

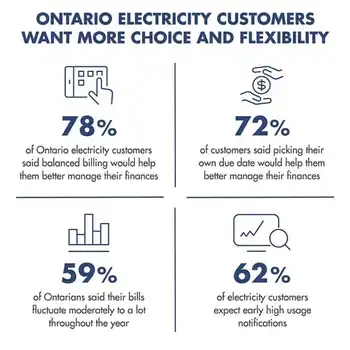
It says it's also planning to extend a financial relief program to help customers struggling to pay their hydro bills, reflecting demand for more choice and flexibility among ratepayers.

The province also extended off-peak electricity rates to provide relief for families, small businesses and farms during this period.


Related News

View more

Sign Up for Electricity Forum’s Newsletter

Stay informed with our FREE Newsletter — get the latest news, breakthrough technologies, and expert insights, delivered straight to your inbox.

Electricity Today T&D Magazine Subscribe for FREE

Stay informed with the latest T&D policies and technologies.
  • Timely insights from industry experts
  • Practical solutions T&D engineers
  • Free access to every issue

Download the 2025 Electrical Training Catalog

Explore 50+ live, expert-led electrical training courses –

  • Interactive
  • Flexible
  • CEU-cerified