UK power grid bottleneck is stalling renewable energy, with connection queues, planning delays, and transmission infrastructure gaps raising costs, slowing decarbonization, and deterring investment as government considers reforms led by a new chief adviser.
Key Points
Delays and capacity gaps that hinder connecting new generation and demand, raising costs and slowing decarbonization.
✅ Connection queues delay projects for years
✅ Planning and NIMBY barriers stall transmission builds
✅ Investment costs on bills risk political pushback
During his three decades at investment bank Morgan Stanley, Franck Petitgas developed a reputation for solving problems that vexed others. Fixing the UK’s creaking power grid could be his most challenging task yet.
Earlier this year, Prime Minister Rishi Sunak appointed Petitgas as his chief business adviser, and the former financier has been pushing to tackle the gridlock that’s left projects waiting endlessly for a connection, an issue he sees as one of the biggest problems for industry.
But there are no easy solutions to tackle the years-long queue to get on the grid or the drawn-out planning process for building clean power generation, with the energy transition stalled by supply delays compounding the problem. And sluggish progress in expanding and improving the electricity network is preventing the construction of new housing developments and offices, as well as slowing the transition to greener power.
That transition has already taken a knock after Sunak last week controversially watered down some of the UK’s climate ambitions, citing in part the cost to consumers. He also acknowledged the issues surrounding the grid and promised the “most transformative plans” in response, drawing on lessons from Europe’s power crisis where applicable. Those are due to be unveiled within weeks.
Shortly after his appointment, Petitgas offered reassurances to business leaders at a meeting in Downing Street that solutions were being worked on, according to people familiar with the matter. But there’s a lack of confidence across business that enough will be done.
Cost is a big factor in the expansion of the electricity grid, and some argue a state-owned generation model could ease bills over time. Improving the onshore network alone could require investment of between £100 billion and £240 billion ($122-$293 billion) by 2050, according to a government analysis last year.
With network expansion funded through power bills, that’s a big ask, particularly with Sunak trailing in polls ahead of an election expected next year.
“It’s very difficult for politicians to say more money should be on bills,” said Emma Pinchbeck, chief executive of Energy UK, a trade body. “So you get to a situation where no one wants to pay for the infrastructure investment until it’s really sticky, and that’s where we’ve got to with the grid.”
There are huge competitive and economic implications if the UK falls further behind. With US President Joe Biden spending an estimated $370 billion on climate measures through his Inflation Reduction Act, and China already a world leader in electric vehicles, Britain’s grid inaction is holding it back in the global race to decarbonize, said Jess Ralston, an analyst at the Energy and Climate Intelligence Unit think tank.
“The UK is dithering and delaying, and not making any strategic decisions,” she said. “You can see companies just saying ‘I’m going to the US, or I’m going to China’.”
In a statement, the government said it’s a “priority to speed up the time taken to connect new power generators and power consumers to the grid.” It added that it’s taking “significant steps to accelerate grid infrastructure,” including support for new Channel interconnectors announced this year.
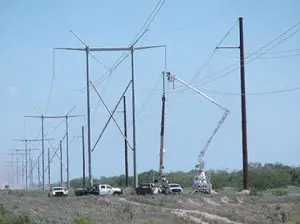
The government expects demand for electricity to double by 2035 and that will mean more generation that needs to be linked up to the network by cables and pylons. Local grids will also have to expand to accommodate more connection points for electric vehicles and homes, and invest in large-scale energy storage capacity to balance supply.
But so far, the rapid rise in renewable energy investment has not been accompanied by matching spend on the power network, according to BloombergNEF, a pattern seen in Germany’s grid expansion woes as well.
“The pace and scale of what we now have to deliver is significantly different from the last few decades,” said Carl Trowell, president of UK strategic infrastructure at National Grid. “It’s a national endeavor.”
In June, Electricity Networks Commissioner Nick Winser sent the government recommendations for how to accelerate construction of more transmission infrastructure. He said efforts to decarbonize the power sector will be “wasted if we cannot get the power to homes and businesses.”
“We need a seriously stronger sense of urgency,” said Kevin O’Donovan, country manager for Statkraft UK, which is holding off investment in four wind farms and two solar projects due to grid connection delays.
In addition to cost, the other major stumbling block is planning. Politicians in the governing Conservative Party are wary of angering voters with new infrastructure in rural areas that typically vote Tory. Across the country, “Not In My Back Yard” campaigners – NIMBYs — pose a major challenge to projects.
Petitgas, 62, retired from Morgan Stanley last year after nearly 30 years at the bank, where he led its international division from London. The issues over connections and planning have been repeatedly pointed out to Petitgas by investors and trade groups over a series of meetings this year, according to people familiar with the matter, requesting anonymity discussing private talks.
Yet with a general election looming and the issue plagued by political headaches, many are skeptical that Sunak can find the solutions needed.
One business chief said Downing Street considers the issue too tricky and expensive to tackle in the short-term. Others are concerned that while Petitgas has license from Sunak, he doesn’t have influence across the relevant departments to get grids to the top of the agenda.
Wind Farms
Multiple parts of the UK’s climate plans are under pressure. Earlier this month, an auction for contracts to build new wind farms received zero bids from developers, even as wind leads the power mix in many regions, marking yet another green setback.
The UK is already behind on its target of having 50 gigawatts of offshore wind built by 2030, up from 14 GW today. The challenge is accelerating development without railroading local communities.
Within Sunak’s Conservative Party, some lawmakers are pushing back on new infrastructure in their local areas. A group including Environment Secretary Therese Coffey and former Home Secretary Priti Patel is campaigning against building new pylons across a stretch of eastern England.
According to Adam Bell, director of policy at consultancy Stonehaven, backbench pressure means Sunak is unlikely to take major action on the grid in the near term. He doesn’t see the prime minister accepting Winser’s recommendations, least of all accelerating planning decisions.
“Over the last year, Sunak has favored party management over things that will benefit the country,” Bell said.
Related News