Cause of transformer fire unknown

By Toronto Star


Protective Relay Training - Basic

Our customized live online or in‑person group training can be delivered to your staff at your location.

  • Live Online
  • 12 hours Instructor-led
  • Group Training Available
Regular Price:
$699
Coupon Price:
$599
Reserve Your Seat Today
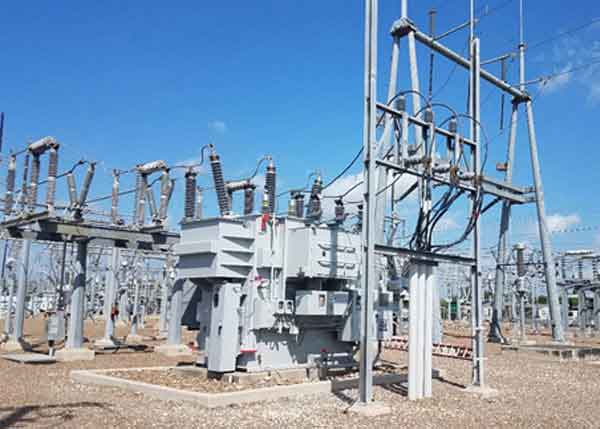
Toronto firefighters remain on scene near Highway 401 and Dixon Rd. days after a four-alarm blaze broke out at the Richview Transformer Station.

Toronto Fire has been on scene since the fire began March 18 with firefighters continuing to apply water on the hot spots that remain.

It took nearly four hours and 80 firefighters to get the blaze under control.

“The way the transformers were constructed there were pieces of wood, covered in oil between sections of copper and metal within the transformers” said a Toronto Fire spokesperson.

“The transformers will continue to smoulder for a while but exactly how long we don’t know.”

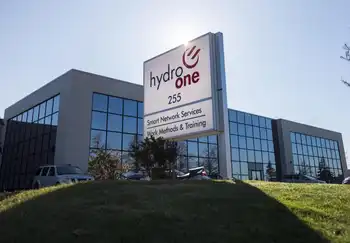
Richview Transformer Station is one of the largest Hydro One stations in Toronto with eight transformers on its site. Two of them went up in flames just before 5 p.m. that day.

A cause has yet to be determined.

Related News

Climate change: Greenhouse gas concentrations again break records

Rising Greenhouse Gas Concentrations drive climate change, with CO2, methane, and nitrous oxide surging; WMO data show higher radiative forcing, elevated pre-industrial baselines, and persistent atmospheric concentrations despite Paris Agreement emissions pledges.


Key Points

Increasing atmospheric CO2, methane, and nitrous oxide levels that raise radiative forcing and drive warming.

✅ WMO data show CO2 at 407.8 ppm in 2018, above decade average

✅ Methane and nitrous oxide surged, elevating total radiative forcing

✅ Concentrations differ from emissions; sinks absorb about half


The World Meteorological Organization (WMO) says the increase in CO2 was just above the average rise recorded over the last decade.

Levels of other warming gases, such as methane and nitrous oxide, have also surged by above average amounts.

Since 1990 there's been an increase of 43% in the warming effect on the climate of long lived greenhouse gases.

The WMO report looks at concentrations of warming gases in the atmosphere rather than just emissions.

The difference between the two is that emissions refer to the amount of gases that go up into the atmosphere from the use of fossil fuels, such as burning coal for coal-fired electricity generation and from deforestation.

Concentrations are what's left in the air after a complex series of interactions between the atmosphere, the oceans, the forests and the land. About a quarter of all carbon emissions are absorbed by the seas, and a similar amount by land and trees, while technologies like carbon capture are being explored to remove CO2.

Using data from monitoring stations in the Arctic and all over the world, researchers say that in 2018 concentrations of CO2 reached 407.8 parts per million (ppm), up from 405.5ppm a year previously.

This increase was above the average for the last 10 years and is 147% of the "pre-industrial" level in 1750.

The WMO also records concentrations of other warming gases, including methane and nitrous oxide, and some countries have reported declines in certain potent gases, as noted in US greenhouse gas controls reports, though global levels remain elevated. About 40% of the methane emitted into the air comes from natural sources, such as wetlands, with 60% from human activities, including cattle farming, rice cultivation and landfill dumps.

Methane is now at 259% of the pre-industrial level and the increase seen over the past year was higher than both the previous annual rate and the average over the past 10 years.

Nitrous oxide is emitted from natural and human sources, including from the oceans and from fertiliser-use in farming. According to the WMO, it is now at 123% of the levels that existed in 1750.

Last year's increase in concentrations of the gas, which can also harm the ozone layer, was bigger than the previous 12 months and higher than the average of the past decade.

What concerns scientists is the overall warming impact of all these increasing concentrations. Known as total radiative forcing, this effect has increased by 43% since 1990, and is not showing any indication of stopping.

There is no sign of a slowdown, let alone a decline, in greenhouse gases concentration in the atmosphere despite all the commitments under the Paris agreement on climate change and the ongoing global energy transition efforts," said WMO Secretary-General Petteri Taalas.

"We need to translate the commitments into action and increase the level of ambition for the sake of the future welfare of mankind," he added.

"It is worth recalling that the last time the Earth experienced a comparable concentration of CO2 was three to five million years ago. Back then, the temperature was 2-3C warmer, sea level was 10-20m higher than now," said Mr Taalas.

The UN Environment Programme will report shortly on the gap between what actions countries are taking to cut carbon, for example where Australia's emissions rose 2% recently, and what needs to be done to keep under the temperature targets agreed in the Paris climate pact.

Preliminary findings from this study, published during the UN Secretary General's special climate summit last September, indicated that emissions continued to rise during 2018, although global emissions flatlined in 2019 according to the IEA.

Both reports will help inform delegates from almost 200 countries who will meet in Madrid next week for COP25, following COP24 in Katowice the previous year, the annual round of international climate talks.


Related News

View more

PG&E restoring power after intentional shut-offs affect 20,500 customers

PG&E power restoration continues across Butte and Yuba counties after PSPS shut-offs from high winds and dry weather, with crews patrolling overhead lines, repairing damage, and reopening community resource centers near Lake Berryessa.


Key Points

PG&E power restoration safely re-energizes lines after PSPS, using inspections and repairs to restore service.

✅ Crews patrolled 800 miles of overhead lines for hazards

✅ Repairs followed wind damage; gradual re-energization

✅ Resource centers offered water, outlets, air conditioning


Pacific Gas and Electric Co. field crews have begun restoring power to approximately 20,500 customers in Butte and Yuba counties after the utility shut off electricity to reduce wildfire risk because of gusty winds and dry weather conditions.

More than half of the affected customers had electricity again as of 1:47 p.m. Sunday, according to PG&E, and by 4 p.m. all of Yuba County power had been restored.

The utility also cut electricity for about 1,600 customers in parts of Napa, Solano and Yolo counties, primarily in the Lake Berryessa area, in a PSPS event separate from statewide grid conservation alerts that can trigger rolling blackouts. Power to those areas was switched off at 6:15 a.m. Saturday but was restored by the evening.

As the danger subsided Sunday, utility workers, as part of PG&E's local response planning for winter storms, worked throughout Butte and Yuba counties to re-energize power lines. The shut-offs affected areas including eastern Chico, Oroville and fire-ravaged Paradise.

Technicians checked lines for damage or fire hazards, like vegetation that could interfere with live wires, Pasion said, as part of broader pandemic grid preparedness that informed utility protocols.

PG&E “patrolled approximately 800 miles of overhead power lines,” the company said in a statement. “Crews found instances of damage to de-energized equipment caused by the extreme weather event and are making necessary repairs.”

While the shut-offs inconvenienced businesses and homeowners, they also highlighted energy inequality across impacted neighborhoods, and some called 911 with emergencies and confusion.

A half hour into the shut-off Saturday night, Butte County sheriff’s dispatchers received a call from a person requesting a welfare check on an individual whose care required electricity, according to department call logs. Two calls overnight from the Magalia area requested medical assistance because residents had oxygen concerns for medically sensitive spouses.

One woman requested an ambulance because her “husband was running out of oxygen,” according to the logs.

Around 4:11 a.m. Sunday, a resident of Hidden Valley Mobile Home Park in Oroville called about a tree falling into a trailer, causing a power line to fall, but noted that the electricity was off.

In a comparable storm-related outage, Sudbury Hydro crews worked to reconnect service after severe weather in Ontario.

And there were multiple calls asking for information about the shut-off, including one caller around midnight who was “demanding PG&E turn his power back on.”

The calls led the Butte County Sheriff’s Office to tweet a reminder Sunday afternoon that 911 is reserved for emergencies and requests for information about the power shutdown should be done through PG&E.

The utility opened a community resource center at Harrison Stadium in Oroville (Butte County) on Sunday morning to provide restrooms, bottled water, power outlets and air conditioning to residents. About 40 people showed up at the center in the first few hours, officials said.

“It’s a small but steady stream,” Pasion said.

Power was being restored to parts of Oroville as of 11 a.m. Sunday.

PG&E officials said it could take up to 48 hours for power to be restored in some areas.

For perspective, during severe storms in Ontario, Hydro One crews restored power to more than 277,000 customers within days.


Related News

View more

Coronavirus could stall a third of new U.S. utility solar this year: report

U.S. Utility-Scale Solar Delays driven by the coronavirus pandemic threaten construction timelines, supply chains, and financing, with interconnection and commissioning setbacks, module sourcing risks in Southeast Asia, and tax credit deadline pressures impacting project delivery.


Key Points

Setbacks to large U.S. solar builds from COVID-19 impacting construction, supply, financing, and permitting.

✅ Construction, interconnection, commissioning site visits delayed

✅ Supply chain risks for modules from Southeast Asia

✅ Tax credit deadline extensions sought by developers


About 5 gigawatts (GW) of big U.S. solar energy projects, enough to power nearly 1 million homes, could suffer delays this year if construction is halted for months due to the coronavirus pandemic, as the Covid-19 crisis hits renewables across the sector, according to a report published on Wednesday.

The forecast, a worst-case scenario laid out in an analysis by energy research firm Wood Mackenzie, would amount to about a third of the utility-scale solar capacity expected to be installed in the United States this year, even as US solar and wind growth continues under favorable plans.

The report comes two weeks after the head of the top U.S. solar trade group called the coronavirus pandemic (as solar jobs decline nationwide) "a crisis here" for the industry. Solar and wind companies are pleading with Congress to extend deadlines for projects to qualify for sunsetting federal tax credits.

Even the firm’s best-case scenario would result in substantial delays, mirroring concerns that wind investments at risk across the industry. With up to four weeks of disruption, the outbreak will push out 2 GW of projects, or enough to power about 380,000 homes. Before factoring in the impact of the coronavirus, Wood Mackenzie had forecast 14.7 GW of utility-scale solar projects would be installed this year.

In its report, the firm said the projects are unlikely to be canceled outright. Rather, they will be pushed into the second half of 2020 or 2021. The analysis assumes that virus-related disruptions subside by the end of the third quarter.

Mid-stage projects that still have to secure financing and receive supplies are at the highest risk, Wood Mackenzie analyst Colin Smith said in an interview, adding that it was too soon to know whether the pandemic would end up altering long-term electricity demand and therefore utility procurement plans, where policy shifts such as an ITC extension could reshape priorities.

Currently, restricted travel is the most likely cause of project delays, the report said. Developers expect delays in physical site visits for interconnection and commissioning, and workers have had difficulty reaching remote construction sites.

For earlier-stage projects, municipal offices that process permits are closed and in-person meetings between developers and landowners or local officials have slowed down.

Most solar construction is proceeding despite stay at home orders in many states because it is considered critical infrastructure, and long-term proposals like a tenfold increase in solar could reshape the outlook, the report said, adding that “that could change with time.”

Risks to supplies of solar modules include potential manufacturing shutdowns in key producing nations in Southeast Asia such as Malaysia, Vietnam and Thailand. Thus far, solar module production has been identified as an essential business and has been allowed to continue.


Related News

View more

Canada's nationwide climate success — electricity

Canada Clean Electricity leads decarbonization, slashing power-sector emissions through coal phase-out, renewables like hydro, wind, and solar, and nuclear. Provinces cut carbon intensity, enabling electrification of transport and buildings toward net-zero goals.


Key Points

Canada Clean Electricity is the shift to low-emission power by phasing out coal and scaling renewables and nuclear.

✅ 38% cut in electricity emissions since 2005; 84% fossil-free power.

✅ Provinces lead coal phase-out; carbon intensity plummets.

✅ Enables EVs, heat pumps, and building electrification.


It's our country’s one big climate success so far.

"All across Canada, electricity generation has been getting much cleaner. It's our country’s one big climate success so far,"

To illustrate how quickly electric power is being cleaned up, what's still left to do, and the benefits it brings, I've dug into Canada's latest emissions inventory and created a series of charts below.


The sector that could

Climate pollution by Canadian economic sector, 2005 to 2017My first chart shows how Canada's economic sectors have changed their climate pollution since 2005.

While most sectors have increased their pollution or made little progress in the climate fight, our electricity sector has shined.

As the green line shows, Canadians have eliminated an impressive 38 per cent of the climate pollution from electricity generation in just over a decade.

To put these shifts into context, I've shown Canada's 2020 climate target on the chart as a gray star. This target was set by the Harper government as part of the global Copenhagen Accord. Specifically, Canada pledged to cut our climate pollution 17 per cent below 2005 levels under evolving Canadian climate policy frameworks of the time.

As you can see, the electricity sector is the only one to have done that so far. And it didn’t just hit the target — it cut more than twice as much.

Change in Canada's electricity generation, 2005 to 2017My next chart shows how the electricity mix changed. The big climate pollution cuts came primarily from reductions in coal burning, highlighting the broader implications of decarbonizing Canada's electricity grid for fuel choices.

The decline in coal-fired power was replaced (and then some) by increases in renewable electricity and other zero-emissions sources — hydro, wind, solar and nuclear.

As a result, Canada's overall electricity generation is now 84 per cent fossil free.


Every province making progress

A primary reason why electricity emissions fell so quickly is because every province worked to clean up Canada's electricity together.

Change in Canadian provincial electricity carbon intensity, 2005 to 2017

My next chart illustrates this rare example of Canada-wide climate progress. It shows how quickly the carbon-intensity of electricity generation has declined in different provinces.

(Note: carbon-intensity is the amount of climate pollution emitted per kilowatt-hour of electricity generated: gCO2e/kWh).

Ontario clearly led the way with an amazing 92 per cent reduction in climate pollution per kWh in just twelve years. Most of that came from ending the burning of coal in their power plants. But a big chunk also came from cutting in half the amount of natural gas they burn for electricity.

Manitoba, Quebec and B.C. also made huge improvements.

Even Alberta and Saskatchewan, which were otherwise busy increasing their overall climate pollution, made progress in cleaning up their electricity.

These real-world examples show that rapid and substantial climate progress can happen in Canada when a broad-spectrum of political parties and provinces decide to act.

Most Canadians now have superclean electricity

As a result of this rapid cleanup, most Canadians now have access to superclean energy.

Canadian provincial electricity carbon intensity in 2017


Who has it? And how clean is it?

The biggest climate story here is the superclean electricity generated by the four provinces shown on the left side — Quebec, Manitoba, B.C. and Ontario. Eighty per cent of Canadians live in these provinces and have access to this climate-safe energy source.

Those living in Alberta and Saskatchewan, however, still have fairly dirty electricity — as shown in orange on the right — and options like bridging the electricity gap between Alberta and B.C. could accelerate progress in the West.

A lot more cleanup must happen here before the families and businesses in these provinces have a climate-safe energy supply.


What's left to do?

Canada's electricity sector has two big climate tasks remaining: finishing the cleanup of existing power and generating even more clean energy to replace fossil fuels like the gasoline and natural gas used by vehicles, factories and other buildings.


Finishing the clean up

Climate pollution from Canadian provincial electricity 2005 and 2017

As we saw above, more than a third of the climate pollution from electricity has already been eliminated. That leaves nearly two-thirds still to clean up.

Back in 2005, Canada's total electricity emissions were 125 million tonnes (MtCO2).

Over the next twelve years, emissions fell by more than a third (-46 MtCO2). Ontario did most of the work by cutting 33 MtCO2. Alberta, New Brunswick and Nova Scotia made the next biggest cuts of around 4 MtCO2 each.

Now nearly eighty million tonnes of climate pollution remain.

As you can see, nearly all of that now comes from Alberta and Saskatchewan. As a result, continuing Canada's climate progress in the power sector now requires big cuts in the electricity emissions from these two provinces.


Generating more clean electricity

The second big climate task remaining for Canada's electricity is to generate more clean electricity to replace the fossil fuels burned in other sectors. My next chart lets you see how big a task this is.


Clean electricity generation by Canadian province, 2017

It shows how much climate-safe electricity is currently generated in major provinces. This includes zero-emissions renewables (blue bars) and nuclear power (pale blue).

Quebec tops the list with 191 terawatt-hours (TWh) per year. While impressive, it only accounts for around half of the energy Quebecers use. The other half still comes from climate-damaging fossil fuels and to replace those, Quebec will need to build out more clean energy.

The good news here is that electricity is more efficient for most tasks, so fossil fuels can be replaced with significantly less electric energy. In addition, other efficiency and reduction measures can further reduce the amount of new electricity needed.

Newfoundland and Labrador is in the best situation. They are the only province that already generates more climate-safe electricity than they would need to replace all the fossil fuels they burn. They currently export most of that clean electricity.

At the other extreme are Alberta and Saskatchewan. These provinces currently produce very little climate-safe energy. For example, Alberta's 7 TWh of climate-safe electricity is only enough to cover 1 per cent of the energy used in the province.

All told, Canadians currently burn fossil fuels for three-quarters of the energy we use. To preserve a safe-and-sane climate, most provinces will soon need lots more clean electricity in the race to net-zero to replace the fossil fuels we burn.

How soon will they need it?

According to the most recent report from the International Panel on Climate Change (IPCC), avoiding a full-blown climate crisis will require humanity to cut emissions by 45 per cent over the next decade.


Using electricity to clean up other sectors

Finally, let's look at how electricity can help clean up two of Canada’s other high-emission sectors — transportation and buildings.


Cleaning up transportation

Transportation is now the second biggest climate polluting sector in Canada (after the oil and gas industry). So, it’s a top priority to reduce the amount of gasoline we use.

Canadian provincial electricity carbon intensity in 2017, plus gasoline equivalent

Switching to electric vehicles (EVs) can reduce transportation emissions by a little, or a lot. It depends on how clean the electricity supply is.

To make it easy to compare gasoline to each province's electricity I've added a new grey-striped zone at the top of the carbon-intensity chart.

This new zone shows that burning gasoline in cars and trucks has a carbon-intensity equivalent to more than 1,000 gCO2e/kWh. (If you are interested in the details of this and other data points, see the geeky endnotes.)

The good news is that every province's electricity is now much cleaner than gasoline as a transportation fuel.

In fact, most Canadians have electricity that is at least 95 per cent less climate polluting than gasoline. Electrifying vehicles in these provinces virtually eliminates those transportation emissions.

Even in Alberta, which has the dirtiest electricity, it is 20 per cent cleaner than gasoline. That's a help, for sure. But it also means that Albertans must electrify many more vehicles to achieve the same emissions reductions as regions with cleaner electricity.

In addition to reducing climate pollution, switching transportation to electricity brings other big benefits:

It reduces air pollution in cities — a major health hazard.

It cuts the energy required for transportation by 75 per cent — because electric motors are so much more efficient.

It reduces fuel costs up to 80 per cent — saving tens of thousands of dollars.

And for gasoline-importing provinces, using local electricity keeps billions of fuel dollars inside their provincial economy.

As an extra bonus, it makes it hard for companies to manipulate the price or for outsiders to "turn off the taps.”


Cleaning up buildings

Canada's third biggest source of climate pollution is the buildings sector.

Burning natural gas for heating is the primary cause. So, reducing the amount of fossil gas burned in buildings is another top climate requirement.

Canadian provincial electricity carbon intensity in 2017, plus gasoline and nat gas heating equivalent

Heating with electricity is a common alternative. However, it's not always less climate polluting. It depends on how clean the electricity is.

To compare these two heating sources, look at the lower grey-striped zone I've added to the chart.

It shows that heating with natural gas has a carbon-intensity of 200 to 300 gCO2 per kWh of heat delivered. High-efficiency gas furnaces are at the lower end of this range.

As you can see, for most Canadians, electric heat is now the much cleaner choice — nearly eliminating emissions from buildings. But in Alberta and Saskatchewan, electricity is still too dirty to replace natural gas heat.

The climate benefits of electric heat can be improved further by using the newer high-efficiency air-source heat pump technologies like mini-splits. These can heat using one half to one third of the electricity of standard electric baseboard heaters. That means it is possible to use electricity that is a bit dirtier than natural gas and still deliver cleaner heating. As a bonus, heat pumps can free up a lot of existing electricity supply when used to replace existing electric baseboards.


Electrify everything

You’ve probably heard people say that to fight climate breakdown, we need to “electrify everything.” Of course, the electricity itself needs to be clean and what we’ve seen is that Canada is making important progress on that front. The electricity industry, and the politicians that prodded them, all deserve kudos for slashing emissions at more than twice the rate of any other sector.

We still need to finish the cleanup job, but we also need to turn our sights to the even bigger task ahead: requiring that everything fossil fuelled — every building, every factory, every vehicle — switches to clean Canadian power.


Related News

View more

Saudis set to 'boost wind by over 6GW'

Saudi Arabia Wind Power Market set to lead the Middle East, driven by Vision 2030 renewables goals, REPDO tenders, and PIF backing, adding 6.2GW wind capacity by 2028 alongside solar PV diversification.


Key Points

It is the emerging national segment leading Middle East wind growth, targeting 6.2GW by 2028 under Vision 2030 policies.

✅ Adds 6.2GW, 46% of regional wind capacity by 2028

✅ REPDO tenders and PIF funding underpin pipeline

✅ Targets: 16GW wind, 40GW solar under Vision 2030


Saudi Arabia will become a regional heavyweight in the Middle East's wind power market adding over 6GW in the next 10 years, according to new research by Wood Mackenzie Power & Renewables.

The report – 'Middle East Wind Power Market Outlook, 2019-2028’ – said developers will build 6.2GW of wind capacity in the country or 46% of the region’s total wind capacity additions between 2019 and 2028.

Wood Mackenzie Power & Renewables senior analyst Sohaib Malik said: “The integration of renewables in Vision 2030’s objectives underlines strong political commitment within Saudi Arabia.

“The level of Saudi ambition for wind and solar PV varies significantly, despite the cost parity between both technologies during the first round of tenders in 2018.”

Saudi Arabia has set a 16GW target for wind by 2030 and 40GW for solar, plans to solicit 60 GW of clean energy over the next decade, Wood Mackenzie added.

“Moving forward, the Renewable Energy Project Development Office will award 850MW of wind capacity in 2019, which is expected to be commissioned in 2021-2022, and increase the local content requirement in future tendering rounds,” Malik said.

However, Saudi Arabia will fall short of its current 2030 renewables target, despite growth projections and regional leadership, the report said.

Some 70% of the renewables capacity target is to be supported by the Public Investment Fund (PIF), the Saudi sovereign wealth fund, while the remaining capacity is to be awarded through REPDO.

“A central concern is the PIF’s lack of track record in the renewables sector and its limited in-house sectoral expertise,” said Malik

“REPDO, on the other hand, completed two renewables request for proposals after pre-developing the sites,” he said.

PIF is estimated to have $230bn of assets – targeted to reach $2 trillion under Vision 2030 – driven by investments in a variety of sectors ranging from electric vehicles to public infrastructure, Wood Mackenzie said.

“There is little doubt about the fund’s financial muscle, however, its past investment strategy focused on established firms in traditional industries,” Malik added.

“Aspirations to develop a value chain for wind and PV technologies locally is a different ball game and requires the PIF to acquire new capabilities for effective oversight of these ventures,” he said.

The report noted that regional volatility is expected to remain, with strong positive growth, driven by Jordan and Iran in 2018 expected to reverse in 2019, and policy shifts, as in Canada’s scaled-back projections, can influence outcomes.

Post-2020 Wood Mackenzie Power & Renewables sees regional demand returning to steady growth as global renewables set more records elsewhere.

“In 2018, developers added 185MW and 63MW of wind capacity in Jordan and Iran, respectively, compared to 53MW of capacity across the entire region in 2017, following a record year for renewables in 2016,” said Malik.

“The completion of the 89MW Al Fujeij and the 86MW Al Rajef projects in 2018 indicates that Jordan has 375MW of the region’s operational 675MW wind capacity.

“Iran followed with 278MW of installed capacity at the end of 2018. A slowdown in 2019 is expected, as project development activity softens in Iran.

“Additionally, delays in awarding the 400MW Dumat Al Jandal project in Saudi Arabia will limit annual capacity additions to 184MW.”

He added that a maturing project pipeline in the region supports the 2020-2021 outlook, even as wind power grew despite Covid-19 globally.

“Saudi Arabian demand serves as the foundation for regional demand. Regional demand diversification is also occurring, with Lebanon set to add 200-400MW to its existing permitted capacity pipeline of 202MW in 2019,” he said

“These developments pave the way for the addition of 2GW of wind capacity between 2019 and 2021.”

Wood Mackenzie Power & Renewables added that the outlook for solar in the region is “much more positive” than wind.

“Compared to only 6GW of wind power capacity, developers will add 53GW of PV capacity through 2024,” said Malik.

He added: “Solar PV, supported by trends such as China’s rapid PV growth in 2016, has become a natural choice for many countries in the region, which is endowed with world class solar energy resources.

“The increased focus on solar energy is demonstrated by ambitious PV targets across the region.”


Related News

View more

New England's solar growth is creating tension over who pays for grid upgrades

New England Solar Interconnection Costs highlight distributed generation strains, transmission charges, distribution upgrades, and DAF fees as National Grid maps hosting capacity, driving queue delays and FERC disputes in Rhode Island and Massachusetts.


Key Points

Rising upfront grid upgrade and DAF charges for distributed solar in RI and MA, including some transmission costs.

✅ Upfront grid upgrades shifted to project developers

✅ DAF and transmission charges increase per MW costs

✅ Queue delays tied to hosting capacity and cluster studies


Solar developers in Rhode Island and Massachusetts say soaring charges to interconnect with the electric grid are threatening the viability of projects. 

As more large-scale solar projects line up for connections, developers are being charged upfront for the full cost of the infrastructure upgrades required, a long-common practice that they say is now becoming untenable amid debates over a new solar customer charge in Nova Scotia. 

“It is a huge issue that reflects an under-invested grid that is not ready for the volume of distributed generation that we’re seeing and that we need, particularly solar,” said Jeremy McDiarmid, vice president for policy and government affairs at the Northeast Clean Energy Council, a nonprofit business organization. 

Connecting solar and wind systems to the grid often requires upgrades to the distribution system to prevent problems, such as voltage fluctuations and reliability risks highlighted by Australian distributors in their networks. Costs can vary considerably from place to place, depending on the amount of distributed generation coming online and the level of capacity planning by regulators, said David Feldman, a senior financial analyst at the National Renewable Energy Laboratory.

“Certainly the Northeast often has more distribution challenges than much of the rest of the country just because it’s more populous and often the infrastructure is older,” he said. “But it’s not unique to the Northeast — in the Midwest, for example, there’s a significant amount of wind projects in the queues and significant delays.”

In Rhode Island and Massachusetts, where strong incentive programs are driving solar development, the level of solar coming online is “exposing the under-investment in the distribution system that is causing these massive costs that National Grid is assigning to particular projects or particular groups of projects,” McDiarmid said. “It is going to be a limiting factor for how much clean energy we can develop and bring online.”

Frank Epps, chief executive officer at Energy Development Partners, has been developing solar projects in Rhode Island since 2010. In that time, he said, interconnection charges on his projects have grown from about $80,000-$120,000 per megawatt to more than $400,000 per megawatt. He attributed the increase to a lack of investment in the distribution network by National Grid over the last decade.

He and other developers say the utility is now adding further to their costs by passing along not just the cost of improving the distribution system — the equivalent of the city street of the grid that brings power directly to customers — but also costs for modifying the transmission system — the interstate highway that moves bulk power over long distances to substations. 

Solar developers who are only requesting to hook into the distribution system, and not applying for transmission service, say they should not be charged for those additional upgrades under state interconnection rules unless they are properly authorized under the federal law that governs the transmission system. 

A Rhode Island solar and wind developer filed a complaint with the Federal Energy Regulatory Commission in February over transmission system improvement charges for its four proposed solar projects. Green Development said National Grid subsidiaries Narragansett Electric and New England Power Company want to charge the company more than $500,000 a year in operating and maintenance expenses assessed as so-called direct assignment facility charges. 

“This amount nearly doubles the interconnection costs associated with the projects,” which total 38.4 megawatts in North Smithfield, the company says in its complaint. “Crucially, these charges are linked to recovering costs associated with providing transmission service — even though no such transmission service is being provided to Green Development.”

But Ted Kresse, a spokesperson for National Grid, said the direct assignment facility, or DAF, construct has been in place for decades and has been applied to any customer affecting the need for transmission upgrades.

“It is the result of the high penetration and continued high volume of distributed generation interconnections that has recently prompted the need for transmission upgrades, and subsequently the pass-through of the associated DAF charges,” he said. 

Several complaints before the Rhode Island Public Utilities Commission object to these DAF and other transmission charges.

One petition for dispute resolution concerns four solar projects totaling 40 MW being developed by Energy Development Partners in a former gravel pit in North Kingstown. Brown University has agreed to purchase the power. 

The developer signed interconnection service agreements with Narragansett Electric in 2019 requiring payment of $21.6 million for costs associated with connecting the projects at a new Wickford Junction substation. Last summer, Narragansett sought to replace those agreements with new ones that reclassified a portion of the costs as transmission-level costs, through New England Power, National Grid’s transmission subsidiary.

That shift would result in additional operational and maintenance charges of $835,000 per year for the estimated 35-year life of the projects, the complaint says.

“This came as a complete shock to us,” Epps said. “We’re not just paying for the maintenance of a new substation. We are paying a share of the total cost that the system owner has to own and operate the transmission system. So all of the sudden, it makes it even tougher for distributed energy resources to be viable.”

In its response to the petition, National Grid argues that the charges are justified because the solar projects will require transmission-level upgrades at the new substation. The company argues that the developer should be responsible for the costs rather than ratepayers, “who are already supporting renewable energy development through their electric rates.”

Seth Handy, one of the lawyers representing Green Development in the FERC complaint, argues that putting transmission system costs on distribution assets is unfair because the distributed resources are “actually reducing the need to move electricity long distances. We’ve been fighting these fights a long time over the underestimating of the value of distributed energy in reducing system costs.”

Handy is also representing the Episcopal Diocese of Rhode Island before the state Supreme Court in its appeal of an April 2020 public utilities commission order upholding similar charges for a proposed 2.2-megawatt solar project at the diocese’s conference center and camp in Glocester. 

Todd Bianco, principal policy associate at the utilities commission, said neither he nor the chairperson can comment on the pending dockets contesting these charges. But he noted that some of these issues are under discussion in another docket examining National Grid’s standards for connecting distributed generation. Among the proposals being considered is the appointment of an independent ombudsperson to resolve interconnection disputes. 

Separately, legislation pending before the Rhode Island General Assembly would remove responsibility for administering the interconnection of renewable energy from utilities, and put it under the authority of the Rhode Island Infrastructure Bank, a financing agency.

Handy, who recently testified in support of the bill, said he believes National Grid has too many conflicting interests to administer interconnecting charges in a timely, transparent and fair fashion, and pointed to utility moves such as changes to solar compensation in other states as examples. In particular, he noted the company’s interests in expanding natural gas infrastructure. 

“There are all kinds of economic interests that they have that conflict with our state policy to provide lower-cost renewable energy and more secure energy solutions,” Handy said.

In testimony submitted to the House Committee on Corporations opposing the legislation, National Grid said such powers are well beyond the purpose and scope of the infrastructure bank. And it cited figures showing Rhode Island is third in the country for the most installed solar per square mile (behind New Jersey and Massachusetts).

Nadav Enbar, program manager at the Electric Power Research Institute, a nonprofit research organization for the utility industry, said interconnection delays and higher costs are becoming more common due to “the incredible uptake” in distributed renewable energy, particularly solar.

That’s impacting hosting capacity, the room available to connect all resources to a circuit without causing adverse harm to reliability and safety. 

“As hosting capacity is being reduced, it’s causing an increasing number of situations where utilities need to study their systems to guarantee interconnection without compromising their systems,” he said. “And that is the reason why you’re starting to see some delays, and it has translated into some greater costs because of the need for upgrades to infrastructure.”

The cost depends on the age or absence of infrastructure, projected load growth, the number of renewable energy projects in the queue, and other factors, he said. As utilities come under increasing pressure to meet state renewable goals, and as some states pilot incentives like a distributed energy rebate in Illinois to drive utility innovation, some (including National Grid) are beginning to provide hosting capacity maps that provide detailed information to developers and policymakers about the amount of distributed energy that can be accommodated at various locations on the grid, he said. 

In addition, the coming availability of high-tech “smart inverters” should help ease some of these problems because they provide the grid with more flexibility when it comes to connecting and communicating with distributed energy resources, Enbar said. 

In Massachusetts, the Department of Public Utilities has opened a docket to explore ways to better plan for and share the cost of upgrading distribution infrastructure to accommodate solar and other renewable energy sources as part of a grid overhaul for renewables nationwide. National Grid has been conducting “cluster studies” there that attempt to analyze the transmission impacts of a group of solar projects and the corresponding interconnection cost to each developer.

Kresse, of National Grid, said the company favors cost-sharing methodologies under consideration that would “provide a pathway to spread cost over the total enabled capacity from the upgrade, as opposed to spreading the cost over only those customers in the queue today.” 

Solar developers want regulators to take an even broader approach that factors in how the deployment of renewables and the resulting infrastructure upgrades benefit not just the interconnecting generator, but all customers. 

“Right now, if your project is the one that causes a multimillion-dollar upgrade, you are assigned that cost even though that upgrade is going to benefit a lot of other projects, as well as make the grid stronger,” said McDiarmid, of the clean energy council. “What we’re asking for is a way of allocating those costs among a variety of developers, as well as to the grid itself, meaning ratepayers. There’s a societal benefit to increasing the modernization of the grid, and improving the resilience of the grid.”

In the meantime, BlueHub Capital, a Boston-based solar developer focused on serving affordable housing developments, recently learned from National Grid that, as a part of one of the area studies, it will be required to pay $5.8 million in transmission and distribution upgrades to interconnect a 2-megawatt solar-plus-storage project that leverages cheaper batteries to enhance resilience, approved for a brownfield site in Gardner, Massachusetts. 

According to testimony submitted to the department, the sum is supposed to be paid within the next year, even though the project will have to wait to be interconnected until April 2027, when a new transmission line is completed. In addition, BlueHub will be responsible for DAF charges totaling $3.4 million over the 20-year life of the project. 

“We’re being asked to pay a fortune to provide solar that the state wants,” said DeWitt Jones, BlueHub’s president. “It’s so expensive that the upgrades are driving everyone out of the interconnection queue. The costs stay the same, but they fall on fewer projects. We need a process of grid design and modernization to guide this.”


Related News

View more

Sign Up for Electricity Forum’s Newsletter

Stay informed with our FREE Newsletter — get the latest news, breakthrough technologies, and expert insights, delivered straight to your inbox.

Electricity Today T&D Magazine Subscribe for FREE

Stay informed with the latest T&D policies and technologies.
  • Timely insights from industry experts
  • Practical solutions T&D engineers
  • Free access to every issue

Download the 2025 Electrical Training Catalog

Explore 50+ live, expert-led electrical training courses –

  • Interactive
  • Flexible
  • CEU-cerified