France urges world review of nuclear

By Reuters


Electrical Testing & Commissioning of Power Systems

Our customized live online or in‑person group training can be delivered to your staff at your location.

  • Live Online
  • 12 hours Instructor-led
  • Group Training Available
Regular Price:
$599
Coupon Price:
$499
Reserve Your Seat Today
French President Nicolas Sarkozy called for the creation of new global nuclear regulations by the end of 2011 during a first visit by a foreign leader to Japan since the earthquake and tsunami that triggered its atomic disaster.

Group of 20 chairman Sarkozy said France wanted to host a meeting of the bloc's nuclear officials in May to fix new norms in the wake of the crisis at Japan's Fukushima Daiichi plant.

"We must address this anomaly that there are no international safety norms for nuclear matters," he said.

The world's worst atomic crisis since Chernobyl in 1986 is proving hard to contain and has forced an international rethink on the benefits and safety of nuclear power.

UN body the International Atomic Energy Agency IAEA sets standards and recommendations, but they are not legally binding and safety is primarily the responsibility of member states.

Japanese Prime Minister Naoto Kan backed the French proposal for a global nuclear review. "In order to avoid recurrence of such an accident, it is our duty to accurately share with the world our experience," Kan said at a joint news conference.

The nuclear drama at the Fukushima Daiichi plant has piled on the agony for Japan after the quake and tsunami left nearly 28,000 people dead or missing and caused damage that may top $300 billion.

First data on the economic impact of the March 11 disaster showed manufacturing suffered its biggest drop on record this month as factories shut and supply chains were disrupted, especially in the car and technology sectors for which Japan is renowned.

France, the world's most nuclear-dependent country, is taking a lead in assisting Japan.

"Dear Japanese friends, know that in this appalling catastrophe, the world is watching and admiring you," Sarkozy said during his visit to Tokyo.

As well as his show of solidarity by his personal presence, Paris has flown in experts from state-owned nuclear reactor maker Areva.

"Consider me your employee," Areva Chief Executive Anne Lauvergeon told Japanese officials.

The United States and Germany have weighed in too, offering robots to help repair the damaged nuclear plant.

In an alarming development in Switzerland, a parcel bomb exploded in the offices of the national nuclear lobby, injuring two female employees. It was not known who sent it.

Switzerland has frozen he approvals process for three new nuclear stations pending a safety review after Japan's disaster.

Related News

N.S. abandons Atlantic Loop, will increase wind and solar energy projects

Nova Scotia Clean Power Plan 2030 pivots from the Atlantic Loop, scaling wind and solar, leveraging Muskrat Falls via the Maritime Link, adding battery storage and transmission upgrades to decarbonize grid and retire coal.


Key Points

Nova Scotia's 2030 roadmap to replace coal with wind, solar, hydro imports, storage, and grid upgrades.

✅ 1,000 MW onshore wind to supply 50% by 2030

✅ Battery storage sites and New Brunswick transmission upgrades

✅ Continued Muskrat Falls imports via Maritime Link


Nova Scotia is abandoning the proposed Atlantic Loop in its plan to decarbonize its electrical grid by 2030 amid broader discussions about independent grid planning nationwide, Natural Resources and Renewables Minister Tory Rushton has announced.

The province unveiled its clean power plan calling for 30 per cent more wind power and five per cent more solar energy in the Nova Scotia power grid over the coming years. Nova Scotia's plan relies on continued imports of hydroelectricity from the Muskrat Falls project in Labrador via the Emera-owned Maritime Link.

Right now Nova Scotia generates 60 per cent of its electricity by burning fossil fuels, mostly coal, and some increased use of biomass has also factored into the mix. Nova Scotia Power must close its coal plants by 2030 when 80 per cent of electricity must come from renewable sources in order reduce greenhouse gas emissions causing climate changes.

Critics have urged reducing biomass use in electricity generation across the province.

The clean power plan calls for an additional 1,000 megawatts of onshore wind by 2030 which would then generate 50 per cent of the the province's electricity, while also advancing tidal energy in the Bay of Fundy as a complementary source.    

"We're taking the things already know and can capitalize on while we build them here in Nova Scotia," said Rushton, "More importantly, we're doing it at a lower rate so the ratepayers of Nova Scotia aren't going to bear the brunt of a piece of equipment that's designed and built and staying in Quebec."

The province says it can meet its green energy targets without importing Quebec hydro through the Atlantic loop. It would have brought hydroelectric power from Quebec into New Brunswick and Nova Scotia via upgraded transmission links. But the government said the cost is prohibitive, jumping to $9 billion from nearly $3 billion three years ago with no guarantee of a secure supply of power from Quebec.

"The loop is not viable for 2030. It is not necessary to achieve our goal," said David Miller, the provincial clean energy director. 

Miller said the cost of $250 to $300 per megawatt hour was five times higher than domestic wind supply.

Some of the provincial plan includes three new battery storage sites and expanding the transmission link with New Brunswick. Both were Nova Scotia Power projects paused by the company after the Houston government imposed a cap on the utility's rate increased in the fall of 2022.

The province said building the 345-kilovolt transmission line between Truro, N.S., and Salisbury, N.B., and an extension to the Point Lepreau Nuclear Generating Station, as well as aligning with NB Power deals for Quebec electricity underway, would enable greater access to energy markets.

Miller says Nova Scotia Power has revived both.

Nova Scotia Power did not comment on the new plan, but Rushton spoke for the company.

"All indications I've had is Nova Scotia Power is on board for what is taking place here today," he said.


Related News

View more

Cost of US nuclear generation at ten-year low

US Nuclear Generating Costs 2017 show USD33.50/MWh for nuclear energy, the lowest since 2008, as capital expenditures, fuel costs, and operating costs declined after license renewals and uprates, supporting a reliable, low-carbon grid.


Key Points

The 2017 US nuclear average was USD33.50/MWh, lowest since 2008, driven by reduced capital, fuel, and operating costs.

✅ Average cost USD33.50/MWh, lowest since 2008

✅ Capital, fuel, O&M costs fell sharply since 2012 peak

✅ License renewals, uprates, market reforms shape competitiveness


Average total generating costs for nuclear energy in 2017 in the USA were at their lowest since 2008, according to a study released by the Nuclear Energy Institute (NEI), amid a continuing nuclear decline debate in other regions.

The report, Nuclear Costs in Context, found that in 2017 the average total generating cost - which includes capital, fuel and operating costs - for nuclear energy was USD33.50 per megawatt-hour (MWh), even as interest in next-generation nuclear designs grows among stakeholders. This is 3.3% lower than in 2016 and more than 19% below 2012's peak. The reduction in costs since 2012 is due to a 40.8% reduction in capital expenditures, a 17.2% reduction in fuel costs and an 8.7% reduction in operating costs, the organisation said.

The year-on-year decline in capital costs over the past five years reflects the completion by most plants of efforts to prepare for operation beyond their initial 40-year licence. A few major items - a series of vessel head replacements; steam generator replacements and other upgrades as companies prepared for continued operation, and power uprates to increase output from existing plants - caused capital investment to increase to a peak in 2012. "As a result of these investments, 86 of the [USA's] 99 operating reactors in 2017 have received 20-year licence renewals and 92 of the operating reactors have been approved for uprates that have added over 7900 megawatts of electricity capacity. Capital spending on uprates and items necessary for operation beyond 40 years has moderated as most plants are completing these efforts," it says.

Since 2013, seven US nuclear reactors have shut down permanently, with the Three Mile Island debate highlighting wider policy questions, and another 12 have announced their permanent shutdown. The early closure for economic reasons of reliable nuclear plants with high capacity factors and relatively low generating costs will have long-term economic consequences, the report warns: replacement generating capacity, when needed, will produce more costly electricity, fewer jobs that will pay less, and, for net-zero emissions objectives, more pollution, it says.

NEI Vice President of Policy Development and Public Affairs John Kotek said the "hardworking men and women of the nuclear industry" had done an "amazing job" reducing costs through the institute's Delivering the Nuclear Promise campaign and other initiatives, in line with IAEA low-carbon lessons from the pandemic. "As we continue to face economic headwinds in markets which do not properly compensate nuclear plants, the industry has been doing its part to reduce costs to remain competitive," he said.

"Some things are in urgent need of change if we are to keep the nation's nuclear plants running and enjoy their contribution to a reliable, resilient and low-carbon grid. Namely, we need to put in place market reforms that fairly compensate nuclear similar to those already in place in New York, Illinois and other states," Kotek added.

Cost information in the study was collected by the Electric Utility Cost Group with prior years converted to 2017 dollars for accurate historical comparison.


Related News

View more

Energy prices trigger EU inflation, poor worst hit

EU Energy Price Surge is driving up electricity and gas costs, inflation, and cost of living across the EU, prompting tax cuts, price caps, subsidies, and household support measures in France, Italy, Spain, and Germany.


Key Points

A surge in EU gas and electricity costs driving inflation and prompting government subsidies, tax cuts, and price caps.

✅ Low-income EU households now spend 50-70 percent more on energy.

✅ Governments deploy tax cuts, price caps, and direct subsidies.

✅ Gas-dependent power markets drive electricity price spikes.


Higher energy prices, including for natural gas, are pushing up electricity prices and the cost of living for households across the EU, prompting governments to cut taxes and provide financial support to the tune of several billion euros.

In the United Kingdom, households are bracing for high winter energy bills this season.

A series of reports published by Cambridge Econometrics in October and November 2022 found that households in EU countries are spending much more on energy than in 2020 and that governments are spending billions of euros to help consumers pay bills and cut taxes.

In France, for example, the poorest households now spend roughly one-third more on energy than in 2020. Between August 2020 and August 2022, household energy prices increased by 37 percent, while overall inflation increased by 9.2 percent.

“We estimate that the increase in household energy prices make an average French household €410 worse off in 2022 compared to 2020, mostly due to higher gas prices,” said the report.

In response to rising energy prices, the French government has adopted price caps and support measures forecast to cost over €71 billion, equivalent to 2.9 percent of French GDP, according to the U.K.-based consultancy.

In Italy, fossil fuels alone were responsible for roughly 30 percent of the country’s annual rate of inflation during spring 2022, according to Cambridge Econometrics. Unlike in other European countries, retail electricity prices have outpaced other energy prices in Italy and were 112 percent higher in July 2022 than in August 2020, the report found. Over the same time period, retail petrol prices were up 14 percent, diesel up 22 percent, and natural gas up 42 percent.

We estimate that households in the lowest-income quintile now spend about 50 percent more on energy than in 2020.

“We estimate that before government support, an average Italian household will be spending around €1,400 more on energy and fuel bills this year than in 2020,” the report said. “Low-income households are worse affected by the increasing energy prices: we estimate that households in the lowest-income quintile now spend about 50 percent more on energy than in 2020.”

Electricity production in Italy is dominated by natural gas, which has also led to a spike in wholesale electricity prices. In 2010, natural gas accounted for 50 percent of all electricity production. The share of natural gas fell to 33 percent in 2014, but then rose again, reaching 48 percent in 2021, and 56 percent in the first half of 2022, according to the report, as gas filled the gap of record low hydro power production in 2022.

In Spain, where electricity prices have seen extreme spikes, low-income households are now spending an estimated 70% more on energy than in 2020, according to Cambridge Econometrics.


Low-income squeeze
In Spain, low-income households are now spending an estimated 70% more on energy than in 2020, according to Cambridge Econometrics. It noted that the Spanish government has intervened heavily in energy markets by cutting taxes, introducing cash transfers for households, and capping the price of natural gas for power generators. The latter has led to lower electricity prices than in many other EU countries.

These support measures are forecast to cost the Spanish government over €35 billion, equivalent to nearly 3 percent of Spain’s GDP. Yet consumers will still feel the burden of higher costs of living, and rolling back electricity prices may prove difficult in the near term.

In March, electricity prices alone were responsible for 45 percent of year-on-year inflation in Spain but prices have since fallen as a result of government intervention, Cambridge Econometrics said. Between May and July, fossil fuels prices accounted for 19-25 percent of the overall inflation rate, and electricity prices for 16 percent.


Support measures
Rising inflation is also a real challenge in Germany, Europe’s largest economy, where German power prices have surged this year, adding pressure. Also there, higher gas prices are to blame.

“We estimate that the increase in energy prices currently make an average household €735 worse off in 2022 compared to 2020, mostly due to higher gas prices,” Cambridge Econometrics said, in a report focused on Germany.

The German government has introduced a number of support measures in order to help households, businesses and industry to pay energy bills, amid rising heating and electricity costs for consumers, including price caps that are expected to take effect in March next year. Moreover, households’ energy bills for December this year will be paid by the state. According to the report, these interventions will mitigate the impact of higher prices “to some extent”, but the aid measures are forecast to cost the government nearly 5 percent of GDP.


Fossil-fuel effect
In addition to gas, higher coal prices have also pushed up inflation in some countries, and U.S. electricity prices have reached multi-decade highs as inflation endures.

In Poland, which is heavily dependent on coal for electricity generation, fossil fuels accounted for roughly 40 percent of Poland’s overall year-on-year inflation rate in June 2022, which stood at over 14 percent, the consultancy said.

The price of household coal, which is widely used in heating Polish homes, increased by 157 percent between August 2021 and August 2022.

Higher energy prices in Poland are partly due to Polish and EU sanctions against Russian gas and coal. Other drivers are the weakening of the Polish zloty against the U.S. dollar and the euro, and the uptick in global demand after COVID-19 lockdowns, said Cambridge Econometrics.

Electricity prices have risen at a much slower pace than energy for transport and heating, with an annualized increase of 5.1 percent.


Related News

View more

Wind Leading Power

UK Wind Power Surpasses Gas as offshore wind and solar drive record electricity generation, National Grid milestones, and net zero progress, despite grid capacity bottlenecks, onshore planning reforms, demand from heat pumps and transport electrification.


Key Points

A milestone where wind turbines generated more UK electricity than gas, advancing progress toward a net zero grid.

✅ Offshore wind delivered the majority of UK wind generation

✅ Grid connection delays stall billions in green projects

✅ Planning reforms may restart onshore wind development


Wind turbines have generated more electricity than gas, as wind becomes the main source for the first time in the UK.

In the first three months of this year a third of the country's electricity came from wind farms, as the UK set a wind generation record that underscored the trend, research from Imperial College London has shown.

National Grid has also confirmed that April saw a record period of solar energy generation, and wind and solar outproduced nuclear in earlier milestones.

By 2035 the UK aims for all of its electricity to have net zero emissions, after a 2019 stall in low-carbon generation highlighted the challenge.

"There are still many hurdles to reaching a completely fossil fuel-free grid, but wind out-supplying gas for the first time is a genuine milestone event," said Iain Staffell, energy researcher at Imperial College and lead author of the report.

The research was commissioned by Drax Electrical Insights, which is funded by Drax energy company.

The majority of the UK's wind power has come from offshore wind farms, and the country leads the G20 for wind's electricity share according to recent analyses. Installing new onshore wind turbines has effectively been banned since 2015 in England.

Under current planning rules, companies can only apply to build onshore wind turbines on land specifically identified for development in the land-use plans drawn up by local councils. Prime Minister Rishi Sunak agreed in December to relax these planning restrictions to speed up development.

Scientists say switching to renewable power is crucial to curb the impacts of climate change, which are already being felt, including in the UK, which last year recorded its hottest year since records began.

Solar and wind have seen significant growth in the UK, with wind surpassing coal in 2016 as a milestone. In the first quarter of 2023, 42% of the UK's electricity came from renewable energy, with 33% coming from fossil fuels like gas and coal.

But BBC research revealed on Thursday that billions of pounds' worth of green energy projects are stuck on hold due to delays with getting connections to the grid, as peak power prices also climbed amid system pressures.

Some new solar and wind sites are waiting up to 10 to 15 years to be connected because of a lack of capacity in the electricity system.

And electricity only accounts for 18% of the UK's total power needs. There are many demands for energy which electricity is not meeting, such as heating our homes, manufacturing and transport.

Currently the majority of UK homes use gas for their heating - the government is seeking to move households away from gas boilers and on to heat pumps which use electricity.


Related News

View more

During this Pandemic, Save Money - How To Better Understand Your Electricity Bill

Commercial Electric Tariffs explain utility rate structures, peak demand charges, kWh vs kW pricing, time-of-use periods, voltage, delivery, capacity ratchets, and riders, guiding facility managers in tariff analysis for accurate energy savings.


Key Points

Commercial electric tariffs define utility pricing for energy, demand, delivery, time-of-use periods, riders, and ratchet charges.

✅ Separate kWh charges from kW peak demand fees.

✅ Verify time-of-use windows and demand interval length.

✅ Review riders, capacity ratchets, and minimum demand clauses.


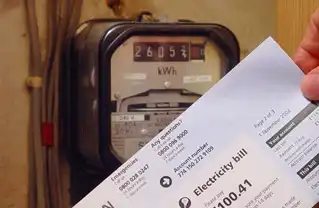
Especially during these tough economic times, as major changes to electric bills are debated in some states, facility executives who don’t understand how their power is priced have been disappointed when their energy projects failed to produce expected dollar savings. Here’s how not to be one of them.

Your electric rate is spelled out in a document called a “tariff” that can be downloaded from your utility’s web page. A tariff should clearly spell out the costs for each component that is part of your rate, reflecting cost allocation practices in your region. Don’t be surprised to learn that it contains a bunch of them. Unlike residential electric rates, commercial electric bills are not based solely on the quantity of kilowatt-hours (kWh) consumed in a billing period (in the United States, that’s a month). Instead, different rates may apply to how your power is supplied, how it is delivered via electricity delivery charges, when it was consumed, its voltage, how fast it was used (in kW), and other factors.

If a tariff’s lingo and word structure are too opaque, spend some time with a utility account rep to translate it. Many state utility commissions also have customer advocates that may assist as they explore new utility rate designs that affect customers. Alternatively, for a fee, facility managers can privately chat with an energy consultant.

Common mistakes

Many facility managers try to estimate savings based on an averaged electric rate, i.e., annual electric spend divided by annual kWh. However, in markets where electricity demand is flat, such a number may obscure the fastest rising cost component: monthly peak demand charges, measured in dollars per kW (or kilo-volt-amperes, kVA).

This charge is like a monthly speeding ticket, based solely on the highest speed you drove during that time. In some areas, peak demand charges now account for 30 to 60 percent of a facility’s annual electric spend. When projecting energy cost savings, failing to separately account for kW peak demand and kWh consumption may result in erroneous results, and a lot of questions from the C-suite.

How peak demand charges are calculated varies among utilities. Some base it on the highest average speed of use across one hour in a month, while others may use the highest average speed during a 15- or 30-minute period. Others may average several of the highest speeds within a defined time period (for example, 8 a.m. to 6 p.m. on weekdays). It is whatever your tariff says it is.

Because some power-consuming (or producing) devices, including those tied to smart home electricity networks, vary in their operation or abilities, they may save money on a few — but not all — of those rate components. If an equipment vendor calculates savings from its product by using an average electric rate, take pause. Tell the vendor to return after the proposal has been redone using tariff-based numbers.

When a vendor is the only person calculating potential savings from using a product, there’s also a built-in conflict of interest: The person profiting from an equipment sale should not also be the one calculating its expected financial return. Before signing any energy project contracts, it’s essential that someone independent of the deal reviews projected savings. That person (typically an energy or engineering consultant) should be quite familiar with your facility’s electric tariff, including any special provisions, riders, discounts, etc., that may pertain. When this doesn’t happen, savings often don’t occur as planned. 

For example, some utilities add another form of demand charge, based on the highest kW in a year. It has various names: capacity, contract demand, or the generic term “ratchet charge.” Some utilities also have a minimum ratchet charge which may be based on a percent of a facility’s annual kW peak. It ensures collection of sufficient utility revenue to cover the cost of installed transmission and distribution even when a customer significantly cuts its peak demand.


Related News

View more

Wind Denmark - Danish electricity generation sets a new green record

Denmark 2019 electricity CO2 intensity shows record-low emissions as renewable energy surges, wind power dominates, offshore wind expands, and coal phase-out accelerates Denmark's energy transition and grid decarbonization, driven by higher CO2 prices and flexibility.


Key Points

It is 135 g CO2/kWh, a record low enabled by wind power growth, offshore wind, and a sharp coal decline.

✅ Average emissions fell to 135 g CO2/kWh, the lowest on record

✅ Wind and solar supplied 49.9% of national electricity use

✅ Coal consumption dropped 46% as CO2 allowance prices rose


Danish electricity producers set a new green record in 2019, when an average produced kilowatt-hour emitted 135 gr CO2 / kWh.

It is the lowest CO2 emission ever measured in Denmark and about one-seventh of what the electricity producers emitted in 1990.

Never has a kilowatt-hour produced emitted as little CO2 as it did in 2019. And that's according to Energinet's recently published annual Environmental Report on Danish electricity generation and cogeneration, two primary causes.

One reason is that more green power has been produced because the Horns Rev 3 offshore wind farm, which can produce electricity for 425,000 households, was commissioned in 2019. The other is that Danish coal consumption fell by 46 percent from 2018 to 2019, as coal phase-out plans gathered pace across the sector. the dramatic decline in coal consumption is partly due a significant increase in the price of CO2 quotas, and thus also the price of CO2 emissions.

'Historically, 135 gr CO2 / kWh is a really, really low figure, showing the impressive green travel that the Danish electricity system has been on. In 1990, a kilowatt-hour produced emitted over 1000 grams of CO2, ie about seven times as much as today, 'says Hanne Storm Edlefsen, area manager in Energinet Power Systems Responsibility.

Wind energy is the dominant form of electricity generation in Denmark, a pattern the UK wind beat coal in 2016 when shifting away from fossil fuels.

17.1 TWh. Danish wind turbines and solar cells generated so much electricity in 2019, corresponding to 49.9 per cent. of Danish electricity consumption, reflecting broader EU wind and solar growth trends as well. An increase of 15 per cent. The wind turbines alone produced 16 TWh, which is not only a new green record, but also puts a thick line that wind energy is by far the most dominant form of electricity generation in Denmark.

'Thanks to our large wind resources, turbines are by far the largest supplier of renewable energy in Denmark, and this will be for many years to come. The large price drop in new wind energy in recent years - for both onshore and offshore winds - will ensure that wind energy will drive a large part of the growth in renewable energy in the coming years, as new wind generation records are set in markets like the UK, 'says Soren Klinge, electricity market manager at Wind Denmark.

Conversely, total electricity generation from fossil and bio-based fuels decreased by 26 PJ (petajoule ed.), Corresponding to 34 per cent. from 2018 to 2019, mirroring renewables overtaking coal in Germany. Nevertheless, net electricity generation was just under 30 TWh both years.

'It is worth noting that while fossil fuels are being phased out, Denmark maintains its annual net production of electricity. The green, so to speak, replaces the black. It once again underpins that green conversion, high security of supply and an affordable electricity price can go hand in hand, 'says Hanne Storm Edlefsen.

Danish power system is ready for a green future

Including trade in electricity with neighboring countries, 1 kWh in a Danish outlet generates 145 gr CO2 / kWh.

'There has been a very significant development in the Danish electricity system in recent years, where the electricity system can now be operated solely on the renewable energy. It is a remarkable development, also from an international perspective where low-carbon progress stalled in the UK in 2019, that one would not have thought possible for just a few years ago, 'he says.

More than expected have phased out coal

The electricity from the Danish sockets will be greener , predicts Energinet's environmental report , which expects CO2 intensity in the coming years. This is explained by an expectation of increased electrification of energy consumption, together with a continued expansion with wind and solar.

'Wind energy is the cornerstone of the green transition. With the commissioning of the Kriegers Flak offshore wind farm and several major onshore wind turbine projects within the next few years, we can well expect that only the wind's share of electricity consumption will exceed 50 per cent hopefully as early as 2021,' concludes Soren Klinge.


Related News

View more

Sign Up for Electricity Forum’s Newsletter

Stay informed with our FREE Newsletter — get the latest news, breakthrough technologies, and expert insights, delivered straight to your inbox.

Electricity Today T&D Magazine Subscribe for FREE

Stay informed with the latest T&D policies and technologies.
  • Timely insights from industry experts
  • Practical solutions T&D engineers
  • Free access to every issue

Live Online & In-person Group Training

Advantages To Instructor-Led Training – Instructor-Led Course, Customized Training, Multiple Locations, Economical, CEU Credits, Course Discounts.

Request For Quotation

Whether you would prefer Live Online or In-Person instruction, our electrical training courses can be tailored to meet your company's specific requirements and delivered to your employees in one location or at various locations.