Radiation found in Tokyo tap water

By Toronto Star


Electrical Testing & Commissioning of Power Systems

Our customized live online or in‑person group training can be delivered to your staff at your location.

  • Live Online
  • 12 hours Instructor-led
  • Group Training Available
Regular Price:
$599
Coupon Price:
$499
Reserve Your Seat Today
A spike in radiation levels in Tokyo tap water spurred new fears about food safety as rising black smoke forced another evacuation of workers trying to stabilize Japan's radiation-leaking nuclear plant.

Radiation has seeped into vegetables, raw milk, the water supply and seawater since a magnitude-9 quake and killer tsunami crippled the Fukushima Daiichi power plant. Broccoli was added to a list of tainted vegetables, and U.S. officials announced a block on Japanese dairy and other produce from the region.

The crisis is emerging as the world's most expensive natural disaster on record, likely to cost up to $309 billion, according to a new government estimate. The death toll continued to rise, with more than 9,400 bodies counted and more than 14,700 people listed as missing.

Concerns about food safety spread to Tokyo after officials said tap water showed elevated levels: 210 becquerels per litre of iodine-131 — more than twice the recommended limit of 100 becquerels per litre for infants. The recommended limit for adults is 300 becquerels.

“It is really scary. It is like a vicious negative spiral from the nuclear disaster,” said Etsuko Nomura, a mother of two young children ages 2 and 5. “We have contaminated milk and vegetables, and now tap water in Tokyo, and I'm wondering what's next.”

Infants are particularly vulnerable to radioactive iodine, which can cause thyroid cancer, experts say. The limits refer to sustained consumption rates, and officials urged calm, saying parents should stop giving the tap water to babies, but that it was no worry if the infants already had consumed small amounts.

They said the levels posed no immediate health risk for older children or adults.

“Even if you drink this water for one year, it will not affect people's health,” Chief Cabinet Secretary Yukio Edano said.

Tokyo residents shouldn't worry, said Dr. Lim Sang-moo, director of nuclear medicine at the Korea Cancer Center Hospital in Seoul.

Parents might want to be more cautious if they have a choice. “Nobody wants to drink radioactive water,” he said. But “it's not a medical problem but a psychosocial problem: The stress that people get from the radioactivity is more dangerous than the radioactivity itself.”

Experts also say iodine-131 dissipates quickly in the air, with half of it disappearing every eight days.

Richard Wakeford, a public health radiologist at the University of Manchester in Britain, blamed the spike in radiation on a shift in winds from the nuclear plant toward Tokyo. He predicted lower levels in coming days once the wind shifts back to normal patterns.

“I imagine that bottled water is now quite popular in Tokyo,” he said.

Convenience stores around Tokyo began selling out of water soon after the news broke. At one downtown supermarket, clerk Toru Kikutaka said water purchases were limited to two, two-litre bottles per person, but the store still sold out almost immediately.

“I've never seen anything like this,” he said.

The latest reported food data showed sharp increases in radioactivity levels in a range of vegetables. In an area about 40 kilometres northwest of the plant, levels for one locally grown leafy green called kukitachina measured 82 times the government's limit for radioactive cesium and 11 times the limit for iodine.

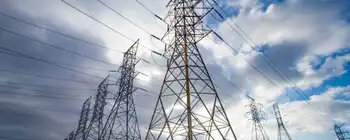
The unsettling new development affecting Japan's largest city, home to some 13 million in the city centre, came as nuclear officials struggled to stabilize the hobbled reactor 220 kilometres to the north.

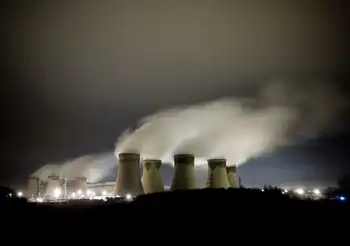
The quake and tsunami that struck off the east coast March 11 knocked out the plant's crucial cooling systems.

Explosions and fires followed in four of the plant's six reactors, leaking radioactive steam into the air. Progress in cooling down the facility has been intermittent, disrupted by rises in radiation, elevated pressure in reactors and overheated storage pools.

The plant operator had restored circuitry to bring power to all six units and turned on lights at Unit 3 for the first time since the disaster — a significant step toward restarting the cooling system.

It had hoped to restore power to cooling pumps at the unit within days, but experts warned the work included the risk of sparking fires as electricity is restored through equipment potentially damaged in the tsunami.

Tokyo Electric Power Co. manager Teruaki Kobayashi said the pump for Unit 3 had been tested and it was working. But officials weren't sure when they would be able to turn the power on to the pump.

In a new setback, black smoke billowed from Unit 3, prompting another evacuation of workers from the plant during the afternoon, Tokyo Electric officials said. They added that there had been no corresponding spike in radiation at the plant.

“We don't know the reason” for the smoke, said Hidehiko Nishiyama of the Nuclear and Industrial Safety Agency.

Nuclear agency official Kenji Kawasaki said workers would not be allowed to return to the plant until March 24, as it was too difficult to tell at night whether all the smoke had cleared.

As a precaution, officials have evacuated residents living within 20 kilometres of the plant and advised those up to 30 kilometres away to stay indoors to minimize exposure.

And for the first time, Edano suggested that those downwind of the plant, even if just outside the zone, should stay indoors with the windows shut tight.

Survivors, meanwhile, buried the dead from the disaster in makeshift coffins, resorting to wrapping some bodies in blue tarps.

In Higashimatsushima, about 320 kilometres northeast of Tokyo, soldiers lowered bare plywood coffins into the ground, saluting each casket, as families watched from a distance. Two young girls wept inconsolably, their father hugging them tight.

“I hope their spirits will rest in peace here at this temporary place,” said mourner Katsuko Oguni, 42.

Hundreds of thousands remained homeless, squeezed into temporary shelters without heat, warm food or medicine and no idea what to call home after the colossal wave swallowed up cities and towns along the coast.

Related News

Electricity users in Newfoundland have started paying for Muskrat Falls

Muskrat Falls rate mitigation offsets Newfoundland Power's rate stabilization decrease as NL Hydro begins cost recovery; Public Utilities Board approval enables collections while Labrador-Island Link nears commissioning, stabilizing electricity rates despite megaproject delays, overruns.


Key Points

Muskrat Falls rate mitigation is NL Hydro's cost recovery via power rates to stabilize bills as commissioning nears.

✅ Offsets 6.4% decrease with a 6.1% rate increase

✅ About 6% now funds NL Hydro's rate mitigation

✅ Collections begin as Labrador-Island Link nears commissioning


With their July electricity bill, Newfoundland Power customers have begun paying for Muskrat Falls, though a lump-sum credit was also announced to offset costs and bills haven't significantly increased — yet.

In a July newsletter, Newfoundland Power said electricity bills were set to decrease by 6.4 per cent as part of the annual rate stabilization adjustment, which reflects the cost of electricity generation.

Instead, that decrease has been offset by a 6.1 increase in electricity rates so Newfoundland and Labrador Hydro can begin recovering the cost of Muskrat Falls, with a $5.2-billion federal package also underpinning the project, the $13-billion hydroelectric megaproject that is billions over budget and years behind schedule.

That means for residential customers, electricity rates will decrease to 12.346 cents per kilowatt, though the basic customer charge will go up slightly from $15.81 to $15.83. According to an N.L. Hydro spokesperson, about six per cent of electricity bills will now go toward what it calls a "rate mitigation fund." 

N.L. Hydro claims victory in Muskrat Falls arbitration dispute with Astaldi
Software troubles blamed for $260M Muskrat Falls cost increase, with N.L. power rates stable for now
The spokesperson said N.L. Hydro is expecting the rate increase to result in $43 million this year, according to a recent financial update from the energy corporation — a tiny fraction of the project's cost. 

N.L. Hydro asked the Public Utilities Board to approve the rate increase, a process similar to Nova Scotia's recent 14% approval by its regulator, in May. In a letter, Energy, Industry and Technology Minister Andrew Parsons supported the increase, though he asked N.L. Hydro to keep electricity rates "as close to current levels as possible. 

Province modifies order in council
Muskrat Falls is not yet fully online — largely due to software problems with the Labrador-Island Link transmission line — and an order in council dictated that ratepayers on the island of Newfoundland would not begin paying for the project until the project was fully commissioned. 

The provincial government modified that order in council so N.L. Hydro can begin collecting costs associated with Muskrat Falls once the project is "nearing" commissioning.

In June, N.L. Hydro said the project was expected to finally be completed by the end of the year.

In an interview with CBC News, Progressive Conservative interim leader David Brazil said the decision to begin recovering the cost of Muskrat Falls from consumers should have been delayed.

"There was an opportunity here for people to get some reprieve when it came to their electricity bills and this administration chose not to do that, not to help the people while they're struggling," he said.

In a statement, Parsons said reducing the rate was not an option, and would have resulted in increased borrowing costs for Muskrat Falls.

"Reducing the rate for one year to have it increase significantly the following year is not consistent with rate mitigation and also places an increased financial burden on taxpayers one year from now," Parsons said.

Decision 'reasonable': Consumer advocate
Brazil said his party didn't know the payments from Muskrat Falls would start in July, and criticized the government for not being more transparent.

A person wearing a blue shirt and black blazer stands outside on a lawn.
N.L. consumer advocate Dennis Browne says it makes sense to begin recouping the cost of Muskrat Falls. (Garrett Barry/CBC)
Newfoundland and Labrador consumer advocate Dennis Browne said the decision to begin collecting costs from consumers was "reasonable."

"We're into a financial hole due to Muskrat Falls, and what has happened is in order to stabilize rates, we have gone into rate stabilization efforts," he said.

In February, the provincial and federal governments signed a complex agreement to shield ratepayers aimed at softening the worst of the financial impact from Muskrat Falls. Browne noted even with the agreement, the provincial government will have to pay hundreds of millions in order to stabilize electricity rates.

"Muskrat Falls would cost us $0.23 a kilowatt, and that is out of the range of affordability for most people, and that's why we're into rate mitigation," he said. "This was part of a rate mitigation effort, and I accepted it as part of that."


Related News

View more

Which of the cleaner states imports dirty electricity?

Hourly Electricity Emissions Tracking maps grid balancing areas, embodied emissions, and imports/exports, revealing carbon intensity shifts across PJM, ERCOT, and California ISO, and clarifying renewable energy versus coal impacts on health and climate.


Key Points

An hourly method tracing generation, flows, and embodied emissions to quantify carbon intensity across US balancing areas.

✅ Hourly traces of imports/exports and generation mix

✅ Consumption-based carbon intensity by balancing area

✅ Policy insights for renewables, coal, health costs


In the United States, electricity generation accounts for nearly 30% of our carbon emissions. Some states have responded to that by setting aggressive renewable energy standards; others are hoping to see coal propped up even as its economics get worse. Complicating matters further is the fact that many regional grids are integrated, and as America goes electric the stakes grow, meaning power generated in one location may be exported and used in a different state entirely.

Tracking these electricity exports is critical for understanding how to lower our national carbon emissions. In addition, power from a dirty source like coal has health and environment impacts where it's produced, and the costs of these aren't always paid by the parties using the electricity. Unfortunately, getting reliable figures on how electricity is produced and where it's used is challenging, even for consumers trying to find where their electricity comes from in the first place, leaving some of the best estimates with a time resolution of only a month.

Now, three Stanford researchers—Jacques A. de Chalendar, John Taggart, and Sally M. Benson—have greatly improved on that standard, and they have managed to track power generation and use on an hourly basis. The researchers found that, of the 66 grid balancing areas within the United States, only three have carbon emissions equivalent to our national average, and they have found that imports and exports of electricity have both seasonal and daily changes. de Chalendar et al. discovered that the net results can be substantial, with imported electricity increasing California's emissions/power by 20%.

Hour by hour
To figure out the US energy trading landscape, the researchers obtained 2016 data for grid features called balancing areas. The continental US has 66 of these, providing much better spatial resolution on the data than the larger grid subdivisions. This doesn't cover everything—several balancing areas in Canada and Mexico are tied in to the US grid—and some of these balancing areas are much larger than others. The PJM grid, serving Pennsylvania, New Jersey, and Maryland, for example, is more than twice as large as Texas' ERCOT, in a state that produces and consumes the most electricity in the US.

Despite these limitations, it's possible to get hourly figures on how much electricity was generated, what was used to produce it, and whether it was used locally or exported to another balancing area. Information on the generating sources allowed the researchers to attach an emissions figure to each unit of electricity produced. Coal, for example, produces double the emissions of natural gas, which in turn produces more than an order of magnitude more carbon dioxide than the manufacturing of solar, wind, or hydro facilities. These figures were turned into what the authors call "embodied emissions" that can be traced to where they're eventually used.

Similar figures were also generated for sulfur dioxide and nitrogen oxides. Released by the burning of fossil fuels, these can both influence the global climate and produce local health problems.

Huge variation
The results were striking. "The consumption-based carbon intensity of electricity varies by almost an order of magnitude across the different regions in the US electricity system," the authors conclude. The low is the Bonneville Power grid region, which is largely supplied by hydropower; it has typical emissions below 100kg of carbon dioxide per megawatt-hour. The highest emissions come in the Ohio Valley Electric region, where emissions clear 900kg/MW-hr. Only three regional grids match the overall grid emissions intensity, although that includes the very large PJM (where capacity auction payouts recently fell), ERCOT, and Southern Co balancing areas.

Most of the low-emissions power that's exported comes from the Pacific Northwest's abundant hydropower, while the Rocky Mountains area exports electricity with the highest associated emissions. That leads to some striking asymmetries. Local generation in the hydro-rich Idaho Power Company has embodied emissions of only 71kg/MW-hr, while its imports, coming primarily from Rocky Mountain states, have a carbon content of 625kg/MW-hr.

The reliance on hydropower also makes the asymmetry seasonal. Local generation is highest in the spring as snow melts, but imports become a larger source outside this time of year. As solar and wind can also have pronounced seasonal shifts, similar changes will likely be seen as these become larger contributors to many of these regional grids. Similar things occur daily, as both demand and solar production (and, to a lesser extent, wind) have distinct daily profiles.

The Golden State
California's CISO provides another instructive case. Imports represent less than 30% of its total electric use in 2016, yet California electricity imports provided 40% of its embodied emissions. Some of these, however, come internally from California, provided by the Los Angeles Department of Water and Power. The state itself, however, has only had limited tracking of imported emissions, lumping many of its sources as "other," and has been exporting its energy policies to Western states in ways that shape regional markets.

Overall, the 2016 inventory provides a narrow picture of the US grid, as plenty of trends are rapidly changing our country's emissions profile, including the rise of renewables and the widespread adoption of efficiency measures and other utility trends in 2017 that continue to evolve. The method developed here can, however, allow for annual updates, providing us with a much better picture of trends. That could be quite valuable to track things like how the rapid rise in solar power is altering the daily production of clean power.

More significantly, it provides a basis for more informed policymaking. States that wish to promote low-emissions power can use the information here to either alter the source of their imports or to encourage the sites where they're produced to adopt more renewable power. And those states that are exporting electricity produced primarily through fossil fuels could ensure that the locations where the power is used pay a price that includes the health costs of its production.


Related News

View more

Coronavirus puts electric carmakers on alert over lithium supplies

Western Lithium Supply Localization is accelerating as EV battery makers diversify from China, boosting lithium hydroxide sourcing in North America and Europe, amid Covid-19 disruptions and rising prices, with geothermal brines and local processing.


Key Points

An industry shift to source lithium and processing near EV hubs, reducing China reliance and supply chain risk.

✅ EV makers seek North American and European lithium hydroxide

✅ Prices rise amid Covid-19 and logistics constraints

✅ New extraction: geothermal and oilfield brine projects


The global outbreak of coronavirus will accelerate efforts by western carmakers to localise supplies of lithium for electric car batteries, according to US producer Livent.

The industry was keen to diversify away from China, which produces the bulk of the world’s lithium, a critical material for lithium-ion batteries, said Paul Graves, Livent’s chief executive.

“It’s a conversation that’s starting to happen that was not happening even six months ago,” especially in the US, the former Goldman Sachs banker added.

China produced about 79 per cent of the lithium hydroxide used in electric car batteries last year, according to consultancy CRU, a supply chain that has been disrupted by the virus outbreak and EV shortages in some markets.

Prices for lithium hydroxide rose 3.1 per cent last month, their first increase since May 2018, according to Benchmark Mineral Intelligence, due to the impact of the Covid-19 bug.

Chinese lithium producer Ganfeng Lithium, which supplies major carmakers from Tesla to Volkswagen, said it had raised prices by less than 10 per cent, due to higher production costs and logistical difficulties.

“We can get lithium from lots of places . . . is that really something we’re prepared to rely upon?” Mr Graves said. “People are going to relook at supply chains, including battery recycling initiatives that enhance resilience, and relook at their integrity . . . and they’re going to say is there something we need to do to change our supply chains to make them more shockproof?”

General Motors last week said it was looking to source battery minerals such as lithium and nickel from North America for its new range of electric cars that will use cells made in Ohio by South Korea’s LG Chem.

“Some of these critical minerals could be challenging to obtain; it’s not just cobalt you need to be concerned about but also battery-grade nickel and lithium as well,” said Andy Oury, a lead engineer for batteries at GM. “We’re doing all of this with an eye to sourcing as much of the raw material from North America as possible.”

However, George Heppel, an analyst at CRU, warned it would be difficult to compete with China on costs. “China is always going to be the most competitive place to buy battery raw materials. That’s not likely to change anytime soon,” he said.

Livent, which extracts lithium from brines in northern Argentina, is looking at extracting the mineral from geothermal resources in the US and also wants to build a processing plant in Europe.

The Philadelphia-based company is also working with Canadian start-up E3 Metals to extract lithium from brines in Alberta's oil and gasfields for new projects in Canada.

“We’ll look at doing more in the US and more in Europe,” said Mr Graves, underscoring evolving Canada-U.S. collaboration across EV supply chains.


Related News

View more

Bomb Cyclone Leaves Half a Million Without Power in Western Washington

Western Washington Bomb Cyclone unleashed gale-force winds, torrential rain, and coastal flooding, causing massive power outages from Seattle to Tacoma; storm surge, downed trees, and blocked roads hindered emergency response and infrastructure repairs.


Key Points

A rapidly deepening storm with severe winds, rain, flooding, and major power outages across Western Washington.

✅ Rapid barometric pressure drop intensified the system

✅ Gale-force winds downed trees and power lines

✅ Coastal flooding and storm surge disrupted transport


A powerful "bomb cyclone" recently hit Western Washington, causing widespread destruction across the region. The intense storm left more than half a million residents without power, similar to B.C. bomb cyclone outages seen to the north, with outages affecting communities from Seattle to Olympia. This weather phenomenon, marked by a rapid drop in atmospheric pressure, unleashed severe wind gusts, heavy rain, and flooding, causing significant disruption to daily life.

The bomb cyclone, which is a rapidly intensifying storm, typically features a sharp drop in barometric pressure over a short period of time. This creates extreme weather conditions, including gale-force winds, torrential rain, and coastal flooding, as seen during California storm impacts earlier in the season. In Western Washington, the storm struck just as the region was beginning to prepare for the winter season, catching many off guard with its strength and unpredictability.

The storm's impact was immediately felt as high winds downed trees, power lines, and other infrastructure. By the time the worst of the storm had passed, utility companies had reported widespread power outages, with more than 500,000 customers losing electricity. The outages were particularly severe in areas like Seattle, Tacoma, and the surrounding communities. Crews worked tirelessly in difficult conditions to restore power, but many residents faced extended outages, underscoring US grid climate vulnerabilities that complicate recovery efforts, with some lasting for days due to the scope of the damage.

The power outages were accompanied by heavy rainfall, leading to localized flooding. Roads were inundated, making it difficult for first responders and repair crews to reach affected areas. Emergency services were stretched thin as they dealt with downed trees, blocked roads, and flooded neighborhoods. In some areas, floodwaters reached homes, forcing people to evacuate. In addition, several schools were closed, and public transportation services were temporarily halted, leaving commuters stranded and businesses unable to operate.

As the storm moved inland, its effects continued to be felt. Western Washington’s coastal regions were hammered by high waves and storm surges, further exacerbating the damage. The combination of wind and rain also led to hazardous driving conditions, prompting authorities to advise people to stay off the roads unless absolutely necessary.

While power companies worked around the clock to restore electricity, informed by grid resilience strategies that could help utilities prepare for future events, challenges persisted. Fallen trees and debris blocked access to repair sites, and the sheer number of outages made it difficult for crews to restore power quickly. Some customers were left in the dark for days, forced to rely on generators, candles, and other makeshift solutions. The storm's intensity left a trail of destruction, requiring significant resources to address the damages and rebuild critical infrastructure.

In addition to the immediate impacts on power and transportation, the bomb cyclone raised important concerns about climate change and the increasing frequency of extreme weather events. Experts note that storms like these are becoming more common, with rapid intensification leading to more severe consequences and compounding pressures such as extreme-heat electricity costs for households. As the planet warms, scientists predict that such weather systems will continue to grow in strength, posing greater challenges to cities and regions that are not always prepared for such extreme events.

In the aftermath of the storm, local governments and utility companies faced the daunting task of not only restoring services but also assessing the broader impact of the storm on communities. Many areas, especially those hit hardest by flooding and power outages, will require substantial recovery efforts. The devastation of the bomb cyclone highlighted the vulnerability of infrastructure in the face of rapidly changing weather patterns and water availability, as seen in BC Hydro drought adaptations nearby, and reinforced the need for greater resilience in the face of future storms.

The storm's impact on the Pacific Northwest is a reminder of the power of nature and the importance of preparedness. As Western Washington recovers, there is a renewed focus on strengthening infrastructure, including expanded renewable electricity to diversify supply, improving emergency response systems, and ensuring that communities are better equipped to handle the challenges posed by increasingly severe weather events. For now, residents remain hopeful that the worst is behind them and are working together to rebuild and prepare for whatever future storms may bring.

The bomb cyclone has left an indelible mark on Western Washington, but it also serves as a call to action for better preparedness, more robust infrastructure, and a greater focus on combating climate change to mitigate the impact of such extreme weather in the future.


Related News

View more

UK breaks coal free energy record again but renewables still need more support

UK Coal-Free Grid Streak highlights record hours without coal, as renewable energy, wind and solar boost electricity generation, cutting CO2 emissions, reducing fossil fuel reliance, and accelerating grid decarbonization amid volatile gas markets.


Key Points

It is the UKs longest coal-free power run, driven by renewables, signaling decarbonization and reduced gas reliance.

✅ Record-breaking hours of electricity with zero coal generation

✅ Enabled by wind, solar, and growing offshore wind capacity

✅ Highlights need to cut gas use and expand renewable investment


Today is the fourth the UK has entered with not a watt of electricity generated by coal.

It’s the longest such streak since the 1880s and comes only days after the last modern era coal-free power record of 55 hours was set.

That represents good news for those of us who have children and would rather like there to be a planet for them to live on when we’re gone.

Coal generated power is dirty power, and not just through the carbon that gets pumped into the atmosphere when it burns.

The fact that the UK is increasingly able to call upon cleaner alternatives for its requirements, to the extent that records are being regularly broken and coal's share has fallen to record lows, is a welcome development.

The trouble is one of those alternatives is gas, and while it is better than coal it still throws off CO2, among other pollutants. The UK’s use of it, for electricity generation and most of its heating, comes with the added disadvantage of leaving it in hock to volatile international markets and producers that aren’t always friendly.

It was only last month, with the country in the middle of a cold snap, that the Grid was issuing a deficit warning (its first in eight years).

As I wrote at the time, we need to burn less of the stuff as low-carbon progress stalled in 2019 shows, too.

As such, Greenpeace’s call for more investment in renewable energy technology and generation, including solar, onshore wind and offshore wind, which is making an increasing contribution as wind beat coal in 2016 demonstrated, was well made.

Those who complain about onshore wind farms, particularly when they are built in windy places that are pretty, seem willfully blind to the pollution caused by gas.

The need to be listened to less. So do those, like British Gas owner Centrica, that bellyache about green taxes.

It bears repeating that fossil fuels are subsidised still more. It’s just that the subsidies are typically hidden.

A report issued last year by a coalition of environmental organisations found the UK provided $972m (£695m) of annual financing for fossil fuels on average between 2013 and 2015, compared with $172m for renewable energy.

But while they come up with wildly varying amounts as a result of wildly varying approaches, the OECD, the IMF and the International Energy Agency have all quantified substantial subsidies for fossils fuels. Their annual estimates have ranged from $160bn to $5.3tn (yes you read that rate and the number was the IMF’s) globally.

So by all means celebrate coal free days, and a full week without coal power as milestones. But we need more of them more quickly and we need more renewable energy to pick up the slack. As such, the philosophy and approach of government needs to change.


Related News

View more

Ontario's electricity operator kept quiet about phantom demand that cost customers millions

IESO Fictitious Demand Error inflated HOEP in the Ontario electricity market, after embedded generation was mis-modeled; the OEB says double-counted load lifted wholesale prices and shifted costs via the Global Adjustment.


Key Points

An IESO modeling flaw that double-counted load, inflating HOEP and charges in Ontario's wholesale market.

✅ Double-counted unmetered load from embedded generation

✅ Inflated HOEP; shifted costs via Global Adjustment

✅ OEB flagged transparency; exporters paid more


For almost a year, the operator of Ontario’s electricity system erroneously counted enough phantom demand to power a small city, causing prices to spike and hundreds of millions of dollars in extra charges to consumers, according to the provincial energy regulator.

The Independent Electricity System Operator (IESO) also failed to tell anyone about the error once it noticed and fixed it.

The error likely added between $450 million and $560 million to hourly rates and other charges before it was fixed in April 2017, according to a report released this month by the Ontario Energy Board’s Market Surveillance Panel.

It did this by adding as much as 220 MW of “fictitious demand” to the market starting in May 2016, when the IESO started paying consumers who reduced their demand for power during peak periods. This involved the integration of small-scale embedded generation (largely made up of solar) into its wholesale model for the first time.

The mistake assumed maximum consumption at such sites without meters, and double-counted that consumption.

The OEB said the mistake particularly hurt exporters and some end-users, who did not benefit from a related reduction of a global adjustment rate applicable to other customers.

“The most direct impact of the increase in HOEP (Hourly Ontario Energy Price) was felt by Ontario consumers and exporters of electricity, who paid an artificially high HOEP, to the benefit of generators and importers,” the OEB said.

The mix-up did not result in an equivalent increase in total system costs, because changes to the HOEP are offset by inverse changes to a electricity cost allocation mechanism such as the Global Adjustment rate, the OEB noted.


A chart from the OEB's report shows the time of day when fictitious demand was added to the system, and its influence on hourly rates.

Peak time spikes
The OEB said that the fictitious demand “regularly inflated” the hourly price of energy and other costs calculated as a direct function of it.

For almost a year, Ontario's electricity system operator @IESO_Tweets erroneously counted enough phantom demand to power a small city, causing price spikes and hundreds of millions in charges to consumers, @OntEnergyBoard says. @5thEstate reports.

It estimated the average increase to the HOEP was as much as $4.50/MWh, but that price spikes, compounded by scheduled OEB rate changes, would have been much higher during busier times, such as the mid-morning and early evening.

“In times of tight supply, the addition of fictitious demand often had a dramatic inflationary impact on the HOEP,” the report said.

That meant on one summer evening in 2016 the hourly rate jumped to $1,619/MWh, it said, which was the fourth highest in the history of the Ontario wholesale electricity market.

“Additional demand is met by scheduling increasingly expensive supply, thus increasing the market price. In instances where supply is tight and the supply stack is steep, small increases in demand can cause significant increases in the market price.

The OEB questioned why, as of September this year, the IESO had failed to notify its customers or the broader public, amid a broader auditor-regulator dispute that drew political attention, about the mistake and its effect on prices.

“It's time for greater transparency on where electricity costs are really coming from,” said Sarah Buchanan, clean energy program manager at Environmental Defence.

“Ontario will be making big decisions in the coming years about whether to keep our electricity grid clean, or burn more fossil fuels to keep the lights on,” she added. “These decisions need to be informed by the best possible evidence, and that can't happen if critical information is hidden.”

In a response to the OEB report on Monday, the IESO said its own initial analysis found that the error likely pushed wholesale electricity payments up by $225 million. That calculation assumed that the higher prices would have changed consumer behaviour, while upcoming electricity auctions were cited as a way to lower costs, it said.

In response to questions, a spokesperson said residential and small commercial consumers would have saved $11 million in electricity costs over the 11-month period, even as a typical bill increase loomed province-wide, while larger consumers would have paid an extra $14 million.

That is because residential and small commercial customers pay some costs via time-of-use rates, including a temporary recovery rate framework, the IESO said, while larger customers pay them in a way that reflects their share of overall electricity use during the five highest demand hours of the year.

The IESO said it could not compensate those that had paid too much, given the complexity of the system, and that the modelling error did not have a significant impact on ratepayers.

While acknowledging the effects of the mistake would vary among its customers, the IESO said the net market impact was less than $10 million, amid ongoing legislation to lower electricity rates in Ontario.

It said it would improve testing of its processes prior to deployment and agreed to publicly disclose errors that significantly affect the wholesale market in the future.


Related News

View more

Sign Up for Electricity Forum’s Newsletter

Stay informed with our FREE Newsletter — get the latest news, breakthrough technologies, and expert insights, delivered straight to your inbox.

Electricity Today T&D Magazine Subscribe for FREE

Stay informed with the latest T&D policies and technologies.
  • Timely insights from industry experts
  • Practical solutions T&D engineers
  • Free access to every issue

Live Online & In-person Group Training

Advantages To Instructor-Led Training – Instructor-Led Course, Customized Training, Multiple Locations, Economical, CEU Credits, Course Discounts.

Request For Quotation

Whether you would prefer Live Online or In-Person instruction, our electrical training courses can be tailored to meet your company's specific requirements and delivered to your employees in one location or at various locations.