U.S. Natural Gas Power Demand is surging for electricity generation amid summer heat, with ERCOT, Texas grid reserves tight, EIA reporting coal and nuclear retirements, renewables intermittency, and pipeline expansions supporting combined-cycle capacity and prices.
Key Points
It is rising use of natural gas for power, driven by summer heat, plant retirements, and new combined-cycle capacity.
✅ ERCOT reserve margin 9%, below 14% target in Texas
✅ Gas share of U.S. power near 40-43% this summer
✅ Coal and nuclear retirements shift capacity to combined cycle
As the hot months linger, it will be natural gas that is leaned on most to supply the electricity that we need to run our air conditioning loads on the grid and keep us cool.
And this is surely a great and important thing: "Heat causes most weather-related deaths, National Weather Service says."
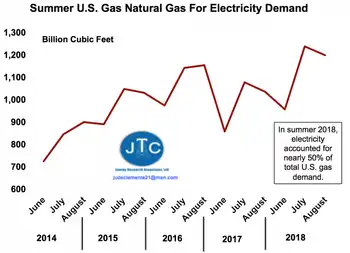
Generally, U.S. gas demand for power in summer is 35-40% higher than what it was five years ago, with so much more coming (see Figure).
The good news is regions across the country are expected to have plenty of reserves to keep up with power demand.
The only exception is ERCOT, covering 90% of the electric load in Texas, where a 9% reserve margin is expected, below the desired 14%.
Last summer, however, ERCOT’s reserve margin also was below the desired level, yet the grid operator maintained system reliability with no load curtailments.
Simply put, other states are very lucky that Texas has been able to maintain gas at 50% of its generation, despite being more than justified to drastically increase that.
At about 1,600 Bcf per year, the flatness of gas for power demand in Texas since 2000 has been truly remarkable, especially since Lone Star State production is up 50% since then.
Increasingly, other U.S. states (and even countries) are wanting to import huge amounts of gas from Texas, a state that yields over 25% of all U.S. output.
Yet if Texas justifiably ever wants to utilize more of its own gas, others would be significantly impacted.
At ~480 TWh per year, if Texas was a country, it would be 9th globally for power use, even ahead of Brazil, a fast growing economy with 212 million people, and France, a developed economy with 68 million people.
In the near-term, this explains why a sweltering prolonged heat wave in July in Texas, with a hot Houston summer setting new electricity records, is the critical factor that could push up still very low gas prices.
But for California, our second highest gas using state, above-average snowpack should provide a stronger hydropower for this summer season relative to 2018.
Combined, Texas and California consume about 25% of U.S. gas, with Texas' use double that of California.
Across the U.S., gas could supply a record 40-43% of U.S. electricity this summer even as the EIA expects solar and wind to be larger sources of generation across the mix
Our gas used for power has increased 35-40% over the past five years, and January power generation also jumped on the year, highlighting broad momentum.
Our gas used for power has increased 35-40% over the past five years. DATA SOURCE: EIA; JTC
Indeed, U.S. natural gas for electricity has continued to soar, even as overall electricity consumption has trended lower in some years, at nearly 10,700 Bcf last year, a 16% rise from 2017 and easily the highest ever.
Gas is expected to supply 37% of U.S. power this year, even as coal-fired generation saw a brief uptick in 2021 in EIA data, versus 27% just five years ago (see Figure).
Capacity wise, gas is sure to continue to surge its share 45% share of the U.S. power system.
"More than 60% of electric generating capacity installed in 2018 was fueled by natural gas."
We know that natural gas will continue to be the go-to power source: coal and nuclear plants are retiring, and while growing, wind and solar are too intermittent, geography limited, and transmission short to compensate like natural gas can.
"U.S. coal power capacity has fallen by a third since 2010," and last year "16 gigawatts (16,000 MW) of U.S. coal-fired power plants retired."
This year, some 2,000 MW of coal was retired in February alone, with 7,420 MW expected to be closed in 2019.
Ditto for nuclear.
Nuclear retirements this year include Pilgrim, Massachusetts’s only nuclear plant, and Three Mile Island in Pennsylvania.
This will take a combined ~1,600 MW of nuclear capacity offline.
Another 2,500 MW and 4,300 MW of nuclear are expected to be leaving the U.S. power system in 2020 and 2021, respectively.
As more nuclear plants close, EIA projects that net electricity generation from U.S. nuclear power reactors will fall by 17% by 2025.
From 2019-2025 alone, EIA expects U.S. coal capacity to plummet nearly 25% to 176,000 MW, with nuclear falling 15% to 83,000 MW.
In contrast, new combined cycle gas plants will grow capacity almost 30% to around 310,000 MW.
Lower and lower projected commodity prices for gas encourage this immense gas build-out, not to mention non-stop increases in efficiency for gas-based units.
Remember that these are official U.S. Department of Energy estimates, not coming from the industry itself.
In other words, our Department of Energy concludes that gas is the future.
Our hotter and hotter summers are therefore more and more becoming: "summers for natural gas"
Ultimately, this shows why the anti-pipeline movement is so dangerous.
"Affordable Energy Coalition Highlights Ripple Effect of Natural Gas Moratorium."
In April, President Trump signed two executive orders to promote energy infrastructure by directing federal agencies to remove bottlenecks for gas transport into the Northeast in particular, where New England oil-fired generation has spiked, and to streamline federal reviews of border-crossing pipelines and other infrastructure.
Builders, however, are not relying on outside help: all they know is that more U.S. gas demand is a constant, so more infrastructure is mandatory.
They are moving forward diligently: for example, there are now some 27 pipelines worth $33 billion already in the works in Appalachia.
Related News