Space solar power promises wireless energy from orbital solar satellites via microwave or laser power beaming, using photovoltaics and rectennas. NRL and AFRL advances hint at 24-7 renewable power delivery to Earth and airborne drones.
Key Points
Space solar power beams orbital solar energy to Earth via microwaves or lasers, enabling continuous wireless electricity.
✅ Harvests sunlight in orbit and transmits via microwaves or lasers
✅ Provides 24-7 renewable power, independent of weather or night
✅ Enables wireless power for remote sites, grids, and drones
Earlier this year, a small group of spectators gathered in David Taylor Model Basin, the Navy’s cavernous indoor wave pool in Maryland, to watch something they couldn’t see. At each end of the facility there was a 13-foot pole with a small cube perched on top. A powerful infrared laser beam shot out of one of the cubes, striking an array of photovoltaic cells inside the opposite cube. To the naked eye, however, it looked like a whole lot of nothing. The only evidence that anything was happening came from a small coffee maker nearby, which was churning out “laser lattes” using only the power generated by the system as ambitions for cheap abundant electricity gain momentum worldwide.
The laser setup managed to transmit 400 watts of power—enough for several small household appliances—through hundreds of meters of air without moving any mass. The Naval Research Lab, which ran the project, hopes to use the system to send power to drones during flight. But NRL electronics engineer Paul Jaffe has his sights set on an even more ambitious problem: beaming solar power to Earth from space. For decades the idea had been reserved for The Future, but a series of technological breakthroughs and a massive new government research program suggest that faraway day may have finally arrived as interest in space-based solar broadens across industry and government.
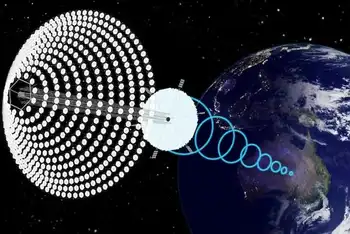
Since the idea for space solar power first cropped up in Isaac Asimov’s science fiction in the early 1940s, scientists and engineers have floated dozens of proposals to bring the concept to life, including inflatable solar arrays and robotic self-assembly. But the basic idea is always the same: A giant satellite in orbit harvests energy from the sun and converts it to microwaves or lasers for transmission to Earth, where it is converted into electricity. The sun never sets in space, so a space solar power system could supply renewable power to anywhere on the planet, day or night, as recent tests show we can generate electricity from the night sky as well, rain or shine.
Like fusion energy, space-based solar power seemed doomed to become a technology that was always 30 years away. Technical problems kept cropping up, cost estimates remained stratospheric, and as solar cells became cheaper and more efficient, and storage improved with cheap batteries, the case for space-based solar seemed to be shrinking.
That didn’t stop government research agencies from trying. In 1975, after partnering with the Department of Energy on a series of space solar power feasibility studies, NASA beamed 30 kilowatts of power over a mile using a giant microwave dish. Beamed energy is a crucial aspect of space solar power, but this test remains the most powerful demonstration of the technology to date. “The fact that it’s been almost 45 years since NASA’s demonstration, and it remains the high-water mark, speaks for itself,” Jaffe says. “Space solar wasn’t a national imperative, and so a lot of this technology didn’t meaningfully progress.”
John Mankins, a former physicist at NASA and director of Solar Space Technologies, witnessed how government bureaucracy killed space solar power development firsthand. In the late 1990s, Mankins authored a report for NASA that concluded it was again time to take space solar power seriously and led a project to do design studies on a satellite system. Despite some promising results, the agency ended up abandoning it.
In 2005, Mankins left NASA to work as a consultant, but he couldn’t shake the idea of space solar power. He did some modest space solar power experiments himself and even got a grant from NASA’s Innovative Advanced Concepts program in 2011. The result was SPS-ALPHA, which Mankins called “the first practical solar power satellite.” The idea, says Mankins, was “to build a large solar-powered satellite out of thousands of small pieces.” His modular design brought the cost of hardware down significantly, at least in principle.
Jaffe, who was just starting to work on hardware for space solar power at the Naval Research Lab, got excited about Mankins’ concept. At the time he was developing a “sandwich module” consisting of a small solar panel on one side and a microwave transmitter on the other. His electronic sandwich demonstrated all the elements of an actual space solar power system and, perhaps most important, it was modular. It could work beautifully with something like Mankins' concept, he figured. All they were missing was the financial support to bring the idea from the laboratory into space.
Jaffe invited Mankins to join a small team of researchers entering a Defense Department competition, in which they were planning to pitch a space solar power concept based on SPS-ALPHA. In 2016, the team presented the idea to top Defense officials and ended up winning four out of the seven award categories. Both Jaffe and Mankins described it as a crucial moment for reviving the US government’s interest in space solar power.
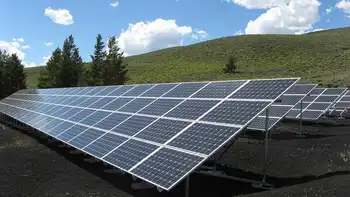
They might be right. In October, the Air Force Research Lab announced a $100 million program to develop hardware for a solar power satellite. It’s an important first step toward the first demonstration of space solar power in orbit, and Mankins says it could help solve what he sees as space solar power’s biggest problem: public perception. The technology has always seemed like a pie-in-the-sky idea, and the cost of setting up a solar array on Earth is plummeting, as proposals like a tenfold U.S. solar expansion signal rapid growth; but space solar power has unique benefits, chief among them the availability of solar energy around the clock regardless of the weather or time of day.
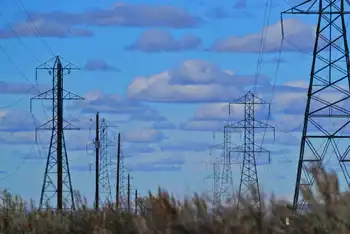
It can also provide renewable energy to remote locations, such as forward operating bases for the military, which has deployed its first floating solar array to bolster resilience. And at a time when wildfires have forced the utility PG&E to kill power for thousands of California residents on multiple occasions, having a way to provide renewable energy through the clouds and smoke doesn’t seem like such a bad idea. (Ironically enough, PG&E entered a first-of-its-kind agreement to buy space solar power from a company called Solaren back in 2009; the system was supposed to start operating in 2016 but never came to fruition.)
“If space solar power does work, it is hard to overstate what the geopolitical implications would be,” Jaffe says. “With GPS, we sort of take it for granted that no matter where we are on this planet, we can get precise navigation information. If the same thing could be done for energy, especially as peer-to-peer energy sharing matures, it would be revolutionary.”
Indeed, there seems to be an emerging race to become the first to harness this technology. Earlier this year China announced its intention to become the first country to build a solar power station in space, and for more than a decade Japan has considered the development of a space solar power station to be a national priority. Now that the US military has joined in with a $100 million hardware development program, it may only be a matter of time before there’s a solar farm in the solar system.
Related News