Electric Field-Induced Glass Softening reveals a Joule heating anomaly in silicate glass, where anode-side nanoscale alkali depletion drives ionic conduction, localized thermal runaway, melting, and evaporation, challenging homogeneity assumptions and refining materials processing models.
Key Points
An effect where electric fields lower glass softening temperature via nanoscale ionic migration and structural change.
✅ Anode-side alkali depletion creates extreme, localized heating
✅ Thermal runaway melts glass near the anode despite uniform bulk
✅ Findings refine Joule heating models and enable new glass processing
A team of scientists working with electrical currents and silicate glass have been left gobsmacked after the glass appeared to defy a basic physical law, in a field that also explores electricity-from-air devices for novel energy harvesting.
If you pass an electrical current through a material, the way that current generates heat can be described by Joule's first law. It's been observed time and time again, with the temperature always evenly distributed when the material is homogeneous (or uniform).
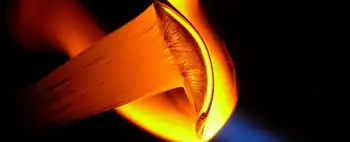
But not in this recent experiment. A section - and only a section - of silicate glass became so hot that it melted, and even evaporated. Moreover, it did so at a much lower temperature than the boiling point of the material.
The boiling point of pure silicate glass is 2,230 degrees Celsius (4,046 degrees Fahrenheit). The hottest temperature the researchers recorded in a homogeneous piece of silicate glass during the experiment was 1,868.7 degrees Celsius.
Say whaaaat.
"The calculations did not add up to explain what we were seeing as simply standard Joule heating," said engineer and materials scientist Himanshu Jain of Lehigh University.
"Even under very moderate conditions, we observed fumes of glass that would require thousands of degrees higher temperature than Joule's law could predict!"
Jain and his colleagues from materials science company Corning Incorporated were investigating a phenomenon they had described in a previous paper. In 2015, they reported that an electric field could reduce the temperature at which glass softens, by as much as a few hundred degrees, a line of inquiry that parallels work on low-cost heat-to-electricity materials in energy research. They called this "electric field-induced softening."
It was certainly a peculiar phenomenon, so they set up another experiment. They put pieces of glass in a furnace, and applied 100 to 200 volts in the form of both alternating and direct currents.
Next, a thin wisp of vapour emanated from the spot where the anode conveying the current contacted the glass.
"In our experiments, the glass became more than a thousand degrees Celsius hotter near the positive side than in the rest of the glass, which was very surprising considering that the glass was totally homogeneous to begin with," Jain said.
This seems to fly in the face of Joule's first law, so the team investigated more closely - and found that the glass wasn't remaining as homogeneous as it started out. The electric field changed the chemistry and the structure of the glass on nanoscale, in just a small section close to the anode.
This region heats faster than the rest of the glass, to the point of becoming a thermal runaway - where an increase in temperature further increases temperature in a blistering feedback loop.
As it turned out, that spot of structural change and dramatic heat resulted in a small area of glass reaching melting point while the rest of the material remained solid.
"Unlike electronically conducting metals and semiconductors, with time the heating of ionically conducting glass becomes extremely inhomogeneous with the formation of a nanoscale alkali-depletion region, such that the glass melts near the anode, even evaporates, while remaining solid elsewhere," the researchers wrote in their paper.
In other words, the material wasn't homogeneous any more, which means the glass heating experiment doesn't exactly change how we apply Joule's first law.
But it's an exciting result, since until now we didn't know a material could actually lose its homogeneity with the application of an electrical current, with possible implications for thin-film heat harvesters in electronics. (The thing is, no one had tried electrically heating glass to these extreme temperatures before.)
So the physical laws of the Universe are still okay, as a piece of glass hasn't broken them. But Joule's first law may need a bit of tweaking to take this effect into account, a reminder that unconventional energy concepts like nighttime solar cells also challenge our intuitions.
And, of course, it's another piece of understanding that could help us in other ways too, including advances in thermoelectric materials that turn waste heat into electricity.
"Besides demonstrating the need to qualify Joule's law," Jain said, "the results are critical to developing new technology for the fabrication and manufacturing of glass and ceramic materials."
The research has been published in Scientific Reports.
Related News