Iran-Iraq Power Grid Deals reinforce electricity and natural gas ties, upgrading transmission in Karbala and Najaf, repairing transformers, easing sanctions bottlenecks, and weighing GCC interconnection to diversify supply and reduce distribution losses across Iraq.
Key Points
Agreements to rehabilitate Iraq's grid, cut losses, and secure power via Iranian gas, electricity, and upgrades.
✅ Reduce distribution losses in Karbala and Najaf
✅ Repair and replace damaged distribution transformers
✅ Coordinate payments to TAVANIR amid US sanctions
Iran and Iraq have finalized two deals to rehabilitate and develop the power grid of Iraq, while Iran is upgrading thermal plants to combined cycle at home to save energy, IRNA cited the Iranian Energy Minister Reza Ardakanian.
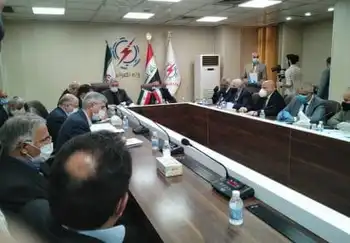
Ardakanian met his Iraqi counterpart Majid Mahdi Hantoush in Tehran on Tuesday evening for talks on further energy cooperation on the sidelines of Prime Minister Mustafa al-Kadhimi’s trip to the Islamic Republic on his first foreign visit.
“It was decided that the contracts related to reducing losses on the electricity distribution network in the provinces of Karbala and Najaf, as well as the contract for repairing Iraq’s distribution transformers would be finalized and signed,” the Iranian minister said.
Iraq relies on Iran for natural gas that generates as much as 45 percent of its electricity, with Iran supplying 40% of Iraq’s power according to sector reports. Iran transmits another 1,200 MW directly, and has regional power hub plans as well, making itself an indispensable energy source for its Arab neighbor, but the United States is trying to pry Baghdad away from Tehran’s orbit.
The US has been enlisting its companies and allies such as Saudi Arabia to replace Iran as Iraq’s source of energy.
Iran’s money from exports of gas and electricity has accumulated in bank accounts in Iraq, because US sanctions are preventing Tehran from repatriating it.
In January, an official said the sanctions were giving Iran a run for five billion dollars, “sedimenting” at the Central Bank of Iraq, because Tehran could not access it.
Ardakanian said the issue was brought up in the discussions on Tuesday and it was agreed that “the payment of part of TAVANIR (Iran Power Generation and Transmission Company)’s claims will start from the end of July”.
The US administration is pushing for a deal between Washington, Baghdad and six Persian Gulf states to connect Iraq’s nationwide power grid to that of the Persian Gulf Cooperation Council, while Uzbekistan looks to export power to Afghanistan as regional linkages expand.
The US State Department said in a statement last Thursday that the six countries that make up the (Persian) Gulf Cooperation Council Interconnection Authority (GCCIA) — Saudi Arabia, Kuwait, Bahrain, Qatar, Oman and the UAE — had affirmed their shared support for the project to supply electricity to Iraq.
Iraq needs more than 23,000 MW of electricity to meet its domestic demand, and is exploring nuclear power plans to tackle shortages, but years of war following the 2003 US invasion have left its power infrastructure in tatters and a deficit of some 7,000 MW.
In the past, officials in Baghdad have said there is no easy substitute to imports from Iran because it will take years to adequately build up Iraq’s energy infrastructure, and meeting summer electricity needs remains a persistent challenge.
They have said American demand acknowledges neither Iraq’s energy needs nor the complex relations between Baghdad and Tehran.
In addition to natural gas and electricity, Iraq imports a wide range of goods from Iran including food, agricultural products, home appliances, and air conditioners.
On Tuesday, the Iraqi prime minister said during a joint news conference with Iranian President Hassan Rouhani that the purpose of his trip to Tehran was to strengthen historical ties between the two countries, especially in light of the challenges they faced as a result of the coronavirus outbreak and the fall of oil prices.
“In the face of such challenges, we need coordination between the two countries in a way that serves the interests of Iran and Iraq.”
Both Iran and Iraq, Kadhimi said, suffer from economic problems, adding the two countries need comprehensive and inclusive cooperation to overcome them.
Kadhimi said Iran-Iraq relations are not merely due to the geographical location of the two countries and their 1,450-km border, adding the ties are based on religion and culture and rooted in history.
“I am reiterating to my brothers in the Islamic Republic of Iran that the Iraqi nation is eager to have excellent relations with the Islamic Republic of Iran based on the principle of non-interference in the internal affairs of the two countries.”
Kadhimi said Iran and Iraq fought against terrorism and Takfiri groups together, and the Islamic Republic of Iran was one of the first countries to stand by Iraq.
“We will not forget this. That is why Iraq has stood with Iran to help it overcome economic challenges and turned to a big market for trade with Iran,” he said.
“We seek stability in Iraq and our philosophy and view of Iran is that we consider Iran a stable, strong, prosperous and progressive country, and this fact is in the interest of Iraq and the territorial integrity of the region,” he added.
According to Kadhimi, the two sides discussed implementing agreements between them, including connecting their railway through Khorramshahr in Iran and Basra in Iraq, adding he was very confident the agreements would be implemented soon.
Iraq’s delegation included the ministers of foreign affairs, finance, health, and planning, as well as Kadhimi’s national security adviser, some of whom also met their Iranian counterparts.
Last year, Iran’s exports to Iraq amounted to nearly $9 billion, IRNA reported. It said the two nations will discuss increasing that amount to $20 billion.
“The two governments’ will is to expand bilateral trade to $20 billion,” Rouhani said after an hour-long meeting with the Iraqi prime minister.
Related News