Ukraine Winter Energy Crisis highlights blackouts, damaged grid, and resilient solutions: solar panels, generators, wood stoves, district heating, batteries, and energy efficiency campaigns backed by EU and US aid to support communities through harsh winters.
Key Points
A wartime surge of blackouts driving resilient, off-grid and efficiency solutions to keep heat and power flowing.
✅ Solar panels, batteries, and generators stabilize essential loads
✅ Wood stoves and district heating maintain winter warmth
✅ Efficiency upgrades and aid bolster grid resilience
As winter sets in across Ukraine, the country faces not only the bitter cold but also the ongoing energy crisis exacerbated by Russia’s invasion. Over the past year, Ukraine has experienced widespread blackouts due to targeted strikes on its power infrastructure. With the harsh winter conditions ahead, Ukrainians are finding innovative ways to adapt to these energy challenges and to keep the lights on this winter despite shortages. From relying on alternative power sources to implementing energy-saving measures, the Ukrainian population is demonstrating resilience in the face of adversity.
The Energy Crisis in Ukraine
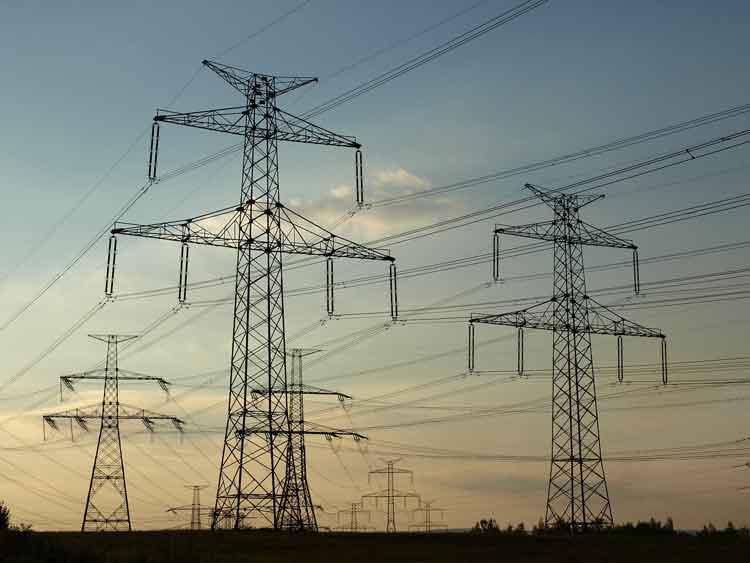
Since the onset of the war in February 2022, Ukraine’s energy infrastructure has become a prime target for Russian missile strikes. Power plants, electrical grids, and transmission lines have all been hit, causing significant damage to the nation’s energy systems, as Ukraine fights to keep the lights on amid repeated attacks. As a result, millions of Ukrainians have faced regular power outages, especially in the winter months when energy demand surges due to heating needs.
The situation has been compounded by the difficulty of repairing damaged infrastructure while the war continues. Many areas, particularly in eastern and southern Ukraine, still suffer from limited access to electricity, heating, and water, with strikes in western Ukraine occasionally causing further disruptions. With no end in sight to the conflict, the Ukrainian government and its citizens are being forced to think outside the box to ensure they can survive the harsh winter months.
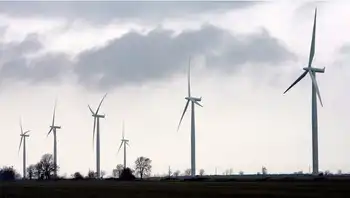
Alternative Energy Sources: Solar Power and Generators
In response to these energy shortages, many Ukrainians are turning to alternative energy sources, particularly solar power and generators. Solar energy, which has been growing in popularity over the past decade, is seen as a promising solution. Solar panels can be installed on homes, schools, and businesses, providing a renewable source of electricity. During the day, the sun provides much-needed energy to power lights, appliances, and even heating systems in homes. While solar power may not fully replace the energy lost during blackouts, it can significantly reduce dependency on the grid, and recent electricity reserve updates suggest fewer planned outages if attacks abate.
To make solar power more accessible, many local and international organizations are providing solar panels and batteries to Ukrainians. These efforts have been critical, especially in rural areas where access to the national grid may be sporadic or unreliable. Additionally, solar-powered streetlights and community energy hubs are being set up in various cities to provide essential services during prolonged outages.
Generators, too, have become a vital tool for many households. Portable generators allow people to maintain some level of comfort during blackouts, powering essential appliances like refrigerators, stoves, and even small heaters. While generators are not a permanent solution, they offer a crucial lifeline when the grid is down for extended periods.
Wood and Coal Stoves: A Return to the Past
In addition to modern energy solutions, many Ukrainians are returning to more traditional sources of energy, such as wood and coal stoves. These methods of heating, while old-fashioned, are still widely available and effective. With gas shortages affecting the country and electricity supplies often unreliable, wood and coal stoves have become an essential part of daily life for many households.
Firewood is being sourced locally, and many Ukrainians are collecting and stockpiling it in preparation for the colder months. While this reliance on solid fuels presents environmental concerns, it remains one of the most feasible options for families living in rural areas or in homes without access to reliable electricity.
Moreover, some urban areas have seen a revival of district heating systems, where heat is generated centrally and distributed throughout a network of buildings. This system, although not without its challenges, is helping to provide warmth to thousands of people in larger cities like Kyiv and Lviv.
Energy Conservation and Efficiency
Beyond alternative energy sources, many Ukrainians are taking measures to reduce their energy consumption. Energy conservation has become a key strategy in dealing with blackouts, as individuals and families aim to minimize their reliance on the national grid. Simple steps like using energy-efficient appliances, sealing windows and doors to prevent heat loss, and limiting the use of electric heating have all become commonplace.
The Ukrainian government, in collaboration with international partners, has also launched campaigns to encourage energy-saving behaviors. These include public information campaigns on how to reduce energy consumption and initiatives to improve the insulation of homes and buildings. By promoting energy efficiency, Ukraine is not only making the most of its limited resources but also preparing for long-term sustainability.
The Role of the International Community
The international community has played a crucial role in helping Ukraine navigate the energy crisis. Several countries and organizations have provided funding, technology, and expertise to assist Ukraine in repairing its power infrastructure and implementing alternative energy solutions. For example, the United States and the European Union have supplied Ukraine with generators, solar panels, and other renewable energy technologies, though U.S. support for grid restoration has recently ended in some areas of assistance. This support has been vital in ensuring that Ukrainians can meet their energy needs despite the ongoing conflict.
In addition, humanitarian organizations have been working to provide emergency relief, including distributing winter clothing, heaters, and fuel to the most vulnerable populations, and Ukraine helped Spain amid blackouts earlier this year, underscoring reciprocal resilience. The global response has been a testament to the solidarity that exists for Ukraine in its time of need.
As winter arrives, Ukrainians are finding creative and resourceful ways to deal with the ongoing energy crisis caused by the war, reflecting the notion that electricity is civilization on the front lines. While the situation remains difficult, the country's reliance on alternative energy sources, traditional heating methods, and energy conservation measures demonstrates a remarkable level of resilience. With continued support from the international community and a commitment to innovation, Ukraine is determined to overcome the challenges of blackouts and ensure that its people can survive the harsh winter months ahead.
Related News