Carbon Nanotube Solvent Electricity enables wire-free electrochemistry as organic solvents like acetonitrile pull electrons, powering alcohol oxidation and packed bed reactors, energy harvesting, and micro- and nanoscale robots via redox-driven current.
Key Points
Solvent-driven electron extraction from carbon nanotube particles generates current for electrochemistry.
✅ 0.7 V per particle via solvent-induced electron flow
✅ Packed bed reactors drive alcohol oxidation without wires
✅ Scalable for micro- and nanoscale robots; energy harvesting
MIT engineers have discovered a new way of generating electricity, alongside advances in renewable power at night that broaden what's possible, using tiny carbon particles that can create a current simply by interacting with liquid surrounding them.
The liquid, an organic solvent, draws electrons out of the particles, generating a current, unlike devices based on a cheap thermoelectric material that rely on heat, that could be used to drive chemical reactions or to power micro- or nanoscale robots, the researchers say.
"This mechanism is new, and this way of generating energy is completely new," says Michael Strano, the Carbon P. Dubbs Professor of Chemical Engineering at MIT. "This technology is intriguing because all you have to do is flow a solvent through a bed of these particles. This allows you to do electrochemistry, but with no wires."
In a new study describing this phenomenon, the researchers showed that they could use this electric current to drive a reaction known as alcohol oxidation—an organic chemical reaction that is important in the chemical industry.
Strano is the senior author of the paper, which appears today in Nature Communications. The lead authors of the study are MIT graduate student Albert Tianxiang Liu and former MIT researcher Yuichiro Kunai. Other authors include former graduate student Anton Cottrill, postdocs Amir Kaplan and Hyunah Kim, graduate student Ge Zhang, and recent MIT graduates Rafid Mollah and Yannick Eatmon.
Unique properties
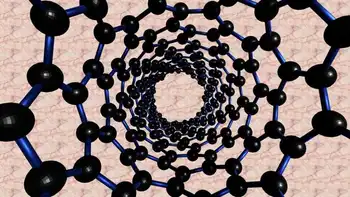
The new discovery grew out of Strano's research on carbon nanotubes—hollow tubes made of a lattice of carbon atoms, which have unique electrical properties. In 2010, Strano demonstrated, for the first time, that carbon nanotubes can generate "thermopower waves." When a carbon nanotube is coated with layer of fuel, moving pulses of heat, or thermopower waves, travel along the tube, creating an electrical current that exemplifies turning thermal energy into electricity in nanoscale systems.
That work led Strano and his students to uncover a related feature of carbon nanotubes. They found that when part of a nanotube is coated with a Teflon-like polymer, it creates an asymmetry, distinct from conventional thermoelectric materials approaches, that makes it possible for electrons to flow from the coated to the uncoated part of the tube, generating an electrical current. Those electrons can be drawn out by submerging the particles in a solvent that is hungry for electrons.
To harness this special capability, the researchers created electricity-generating particles by grinding up carbon nanotubes and forming them into a sheet of paper-like material. One side of each sheet was coated with a Teflon-like polymer, and the researchers then cut out small particles, which can be any shape or size. For this study, they made particles that were 250 microns by 250 microns.
When these particles are submerged in an organic solvent such as acetonitrile, the solvent adheres to the uncoated surface of the particles and begins pulling electrons out of them.
"The solvent takes electrons away, and the system tries to equilibrate by moving electrons," Strano says. "There's no sophisticated battery chemistry inside. It's just a particle and you put it into solvent and it starts generating an electric field."
Particle power
The current version of the particles can generate about 0.7 volts of electricity per particle. In this study, the researchers also showed that they can form arrays of hundreds of particles in a small test tube. This "packed bed" reactor, unlike thin-film waste-heat harvesters for electronics, generates enough energy to power a chemical reaction called an alcohol oxidation, in which an alcohol is converted to an aldehyde or a ketone. Usually, this reaction is not performed using electrochemistry because it would require too much external current.
"Because the packed bed reactor is compact, it has more flexibility in terms of applications than a large electrochemical reactor," Zhang says. "The particles can be made very small, and they don't require any external wires in order to drive the electrochemical reaction."
In future work, Strano hopes to use this kind of energy generation to build polymers using only carbon dioxide as a starting material. In a related project, he has already created polymers that can regenerate themselves using carbon dioxide as a building material, in a process powered by solar energy and informed by devices that generate electricity at night as a complement. This work is inspired by carbon fixation, the set of chemical reactions that plants use to build sugars from carbon dioxide, using energy from the sun.
In the longer term, this approach could also be used to power micro- or nanoscale robots. Strano's lab has already begun building robots at that scale, which could one day be used as diagnostic or environmental sensors. The idea of being able to scavenge energy from the environment, including approaches that produce electricity 'out of thin air' in ambient conditions, to power these kinds of robots is appealing, he says.
"It means you don't have to put the energy storage on board," he says. "What we like about this mechanism is that you can take the energy, at least in part, from the environment."
Related News