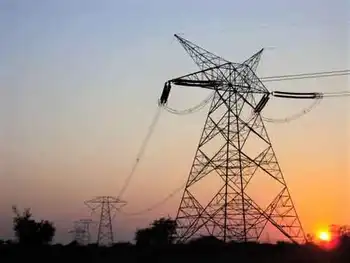
While Gov. Jennifer Granholm is in California hawking Michigan's capabilities as a center of new energy technology, seven new coal-fueled power plants are formally proposed or under serious discussion in Michigan.
A coalition of environmental groups said that's too many and the state needs to halt what they say is dirty, old-fashioned fossil-fuel technology.
"These will keep Michigan locked in the energy dark ages and saddle our state with outmoded technology and high costs," said Anne Woiwode, director of the Michigan chapter of the Sierra Club. Michigan already has 19 coal plants. No coal plants have been built in the state in nearly 20 years, and in that time, many manufacturing plants have closed and the state has lost population.
"The question is whether we even have a need for these plants," Woiwode said.
The Public Service Commission said last year that by 2012, Michigan will need at most two new 500-megawatt plants, which could be coal, nuclear or some other type.
However, Michigan economist David Littmann has said more recent forecasts mean that over he next five years, the state's energy needs could decline, not grow. Four of the proposed plants would produce a combined 2,160 megawatts. DTE Energy has said it wants to build a second large nuclear plant near its existing Fermi plant.
Nationwide, there is a rush to build coal-fired plants, with companies trying to win approval for new plants before expected federal rules kick in that restrict carbon dioxide emissions, said Abby Rubley, field director of Environment Michigan.
At least 150 coal-fired plants are proposed nationwide. Clean Energy Now, made up of several statewide groups, said it plans an aggressive campaign to stop the onslaught of new plants. The group will ask residents to contact legislators to put a moratorium on new coal plants and to pass legislation requiring more renewable energy and more energy efficiency. That alone could meet increased needs for electricity, Woiwode said.
Renewable energy sources - such as wind, water and solar power - supply only 3% of the state's electricity needs. Various groups are pushing for a 20% renewable energy standard for electricity companies by 2020 and for more stringent energy efficiency requirements.
Coal provides about 60% of the state's electricity needs, according to a 2006 U.S. Department of Energy report. Most of the rest comes from nuclear power and natural gas. Michigan's coal plants use pulverized coal, which is burned in a combustion chamber at utility plants.
Private companies, rather than utilities, proposing to build coal plants is new, Rubley said. Under state laws, only utility-owned plants have to get approval for new coal plants from the PSC.
The privately owned plants, which sell the electricity they generate, need only air-quality and, in some cases, water permits from the state.
Some of the companies proposing plants say they would used coal gasification, which doesn't directly burn the coal, instead breaking down the coal molecules. It is cleaner than traditional coal-burning plants, but that doesn't make it clean, Rubley said.
ITER Nuclear Fusion advances tokamak magnetic confinement, heating deuterium-tritium plasma with superconducting magnets, targeting net energy gain, tritium breeding, and steam-turbine power, while complementing laser inertial confinement milestones for grid-scale electricity and 2025 startup goals.
Key Points
ITER Nuclear Fusion is a tokamak project confining D-T plasma with magnets to achieve net energy gain and clean power.
✅ Tokamak magnetic confinement with high-temp superconducting coils
✅ Deuterium-tritium fuel cycle with on-site tritium breeding
✅ Targets net energy gain and grid-scale, low-carbon electricity
It sounds like the stuff of dreams: a virtually limitless source of energy that doesn’t produce greenhouse gases or radioactive waste. That’s the promise of nuclear fusion, often described as the holy grail of clean energy by proponents, which for decades has been nothing more than a fantasy due to insurmountable technical challenges. But things are heating up in what has turned into a race to create what amounts to an artificial sun here on Earth, one that can provide power for our kettles, cars and light bulbs.
Today’s nuclear power plants create electricity through nuclear fission, in which atoms are split, with next-gen nuclear power exploring smaller, cheaper, safer designs that remain distinct from fusion. Nuclear fusion however, involves combining atomic nuclei to release energy. It’s the same reaction that’s taking place at the Sun’s core. But overcoming the natural repulsion between atomic nuclei and maintaining the right conditions for fusion to occur isn’t straightforward. And doing so in a way that produces more energy than the reaction consumes has been beyond the grasp of the finest minds in physics for decades.
But perhaps not for much longer. Some major technical challenges have been overcome in the past few years and governments around the world have been pouring money into fusion power research as part of a broader green industrial revolution under way in several regions. There are also over 20 private ventures in the UK, US, Europe, China and Australia vying to be the first to make fusion energy production a reality.
“People are saying, ‘If it really is the ultimate solution, let’s find out whether it works or not,’” says Dr Tim Luce, head of science and operation at the International Thermonuclear Experimental Reactor (ITER), being built in southeast France. ITER is the biggest throw of the fusion dice yet.
Its $22bn (£15.9bn) build cost is being met by the governments of two-thirds of the world’s population, including the EU, the US, China and Russia, at a time when Europe is losing nuclear power and needs energy, and when it’s fired up in 2025 it’ll be the world’s largest fusion reactor. If it works, ITER will transform fusion power from being the stuff of dreams into a viable energy source.
Constructing a nuclear fusion reactor ITER will be a tokamak reactor – thought to be the best hope for fusion power. Inside a tokamak, a gas, often a hydrogen isotope called deuterium, is subjected to intense heat and pressure, forcing electrons out of the atoms. This creates a plasma – a superheated, ionised gas – that has to be contained by intense magnetic fields.
The containment is vital, as no material on Earth could withstand the intense heat (100,000,000°C and above) that the plasma has to reach so that fusion can begin. It’s close to 10 times the heat at the Sun’s core, and temperatures like that are needed in a tokamak because the gravitational pressure within the Sun can’t be recreated.
When atomic nuclei do start to fuse, vast amounts of energy are released. While the experimental reactors currently in operation release that energy as heat, in a fusion reactor power plant, the heat would be used to produce steam that would drive turbines to generate electricity, even as some envision nuclear beyond electricity for industrial heat and fuels.
Tokamaks aren’t the only fusion reactors being tried. Another type of reactor uses lasers to heat and compress a hydrogen fuel to initiate fusion. In August 2021, one such device at the National Ignition Facility, at the Lawrence Livermore National Laboratory in California, generated 1.35 megajoules of energy. This record-breaking figure brings fusion power a step closer to net energy gain, but most hopes are still pinned on tokamak reactors rather than lasers.
In June 2021, China’s Experimental Advanced Superconducting Tokamak (EAST) reactor maintained a plasma for 101 seconds at 120,000,000°C. Before that, the record was 20 seconds. Ultimately, a fusion reactor would need to sustain the plasma indefinitely – or at least for eight-hour ‘pulses’ during periods of peak electricity demand.
A real game-changer for tokamaks has been the magnets used to produce the magnetic field. “We know how to make magnets that generate a very high magnetic field from copper or other kinds of metal, but you would pay a fortune for the electricity. It wouldn’t be a net energy gain from the plant,” says Luce.
One route for nuclear fusion is to use atoms of deuterium and tritium, both isotopes of hydrogen. They fuse under incredible heat and pressure, and the resulting products release energy as heat
The solution is to use high-temperature, superconducting magnets made from superconducting wire, or ‘tape’, that has no electrical resistance. These magnets can create intense magnetic fields and don’t lose energy as heat.
“High temperature superconductivity has been known about for 35 years. But the manufacturing capability to make tape in the lengths that would be required to make a reasonable fusion coil has just recently been developed,” says Luce. One of ITER’s magnets, the central solenoid, will produce a field of 13 tesla – 280,000 times Earth’s magnetic field.
The inner walls of ITER’s vacuum vessel, where the fusion will occur, will be lined with beryllium, a metal that won’t contaminate the plasma much if they touch. At the bottom is the divertor that will keep the temperature inside the reactor under control.
“The heat load on the divertor can be as large as in a rocket nozzle,” says Luce. “Rocket nozzles work because you can get into orbit within minutes and in space it’s really cold.” In a fusion reactor, a divertor would need to withstand this heat indefinitely and at ITER they’ll be testing one made out of tungsten.
Meanwhile, in the US, the National Spherical Torus Experiment – Upgrade (NSTX-U) fusion reactor will be fired up in the autumn of 2022, while efforts in advanced fission such as a mini-reactor design are also progressing. One of its priorities will be to see whether lining the reactor with lithium helps to keep the plasma stable.
Choosing a fuel Instead of just using deuterium as the fusion fuel, ITER will use deuterium mixed with tritium, another hydrogen isotope. The deuterium-tritium blend offers the best chance of getting significantly more power out than is put in. Proponents of fusion power say one reason the technology is safe is that the fuel needs to be constantly fed into the reactor to keep fusion happening, making a runaway reaction impossible.
Deuterium can be extracted from seawater, so there’s a virtually limitless supply of it. But only 20kg of tritium are thought to exist worldwide, so fusion power plants will have to produce it (ITER will develop technology to ‘breed’ tritium). While some radioactive waste will be produced in a fusion plant, it’ll have a lifetime of around 100 years, rather than the thousands of years from fission.
At the time of writing in September, researchers at the Joint European Torus (JET) fusion reactor in Oxfordshire were due to start their deuterium-tritium fusion reactions. “JET will help ITER prepare a choice of machine parameters to optimise the fusion power,” says Dr Joelle Mailloux, one of the scientific programme leaders at JET. These parameters will include finding the best combination of deuterium and tritium, and establishing how the current is increased in the magnets before fusion starts.
The groundwork laid down at JET should accelerate ITER’s efforts to accomplish net energy gain. ITER will produce ‘first plasma’ in December 2025 and be cranked up to full power over the following decade. Its plasma temperature will reach 150,000,000°C and its target is to produce 500 megawatts of fusion power for every 50 megawatts of input heating power.
“If ITER is successful, it’ll eliminate most, if not all, doubts about the science and liberate money for technology development,” says Luce. That technology development will be demonstration fusion power plants that actually produce electricity, where advanced reactors can build on decades of expertise. “ITER is opening the door and saying, yeah, this works – the science is there.”
Twin States Clean Energy Link connects New England to Hydro-Quebec via a 1,200 MW transmission line, DOE-backed capacity, underground segments, existing corridors, boosting renewable energy reliability across Vermont and New Hampshire with cross-border grid flexibility.
Key Points
DOE-backed 1,200 MW line linking Hydro-Quebec to New England, adding clean capacity with underground routes.
✅ 1,200 MW cross-border capacity for the New England grid
✅ Uses existing corridors; underground in VT and northern NH
✅ DOE capacity contract lowers risk and spurs investment
A proposal to build a new transmission line to connect New England with Canadian hydropower is one step closer to reality.
The U.S. Department of Energy announced Monday that it has selected the Twin States Clean Energy Link as one of three transmission projects that will be part of its $1.3 billion cross-border transmission initiative to add capacity to the grid.
WBUR is a nonprofit news organization. Our coverage relies on your financial support. If you value articles like the one you're reading right now, give today.
Twin States is a proposal from National Grid, a utility company that serves Massachusetts, New York, and Rhode Island, and also owns transmission in England and Wales as the region advances projects like the Scotland-to-England subsea link that expand renewable flows, and the non-profit Citizens Energy Corporation.
The transmission line would connect New England with power from Hydro-Quebec, moving into the United States from Canada in Northern Vermont and crossing into New Hampshire near Dalton. It would run through parts of Grafton, Merrimack, and Hillsborough counties, routing through a substation in Dunbarton and ending at a proposed new substation in Londonderry. (Here's a map of the Twin States proposal.)
The federal funding will allow the U.S. Department of Energy to purchase capacity on the planned transmission line, which officials say reduces the risk for other investors and can help encourage others to purchase capacity.
The project has gotten support from local officials in Vermont and New Hampshire, but there are still hurdles to cross. The contract negotiation process is beginning, National Grid said, and the proposal still needs approvals from regulators before construction could begin.
First Nations communities in Canada have opposed transmission lines connecting Hydro-Quebec with New England in the past, and the company has faced scrutiny from environmental groups.
What would Twin States look like? Transmission projects, like the failed Northern Pass proposal, have been controversial in New England, though the Great Northern Transmission Line progressed in Minnesota.
But Reihaneh Irani-Famili, vice president of capital delivery, project management and construction at National Grid, said this one is different because the developers listened to community concerns before planning the project.
“They did not want new corridors of infrastructure, so we made sure that we're using existing right of way,” she said. “They did not want the visual impact and some of the newer corridors of infrastructure, we're making sure we're undergrounding portions of the line.”
In Vermont and northern New Hampshire, the transmission lines would be buried underground along state roads. South of Littleton, they would be located within existing transmission corridors.
The developers say the lines could provide 1,200 megawatts of transmission capacity. The project would have the ability to carry electricity from hydro facilities in Quebec to New England, and would also be able to bring electricity from New England into Quebec, a step toward broader macrogrid connectivity across regions.
“Those hydro dams become giant green batteries for the region, and they hold that water until we need the electrons,” Irani-Famili said. “So if you think about our energy system not as one that sees borders, but one that sees resources, this is connecting the Quebec resources to the New England resources and helping all of us get into that cleaner energy future with a lot less build than we otherwise would have.”
Irani-Famili says the transmission line could help facilitate more clean energy resources like offshore wind coming online. In a report released last week by New Hampshire’s Department of Energy, authors said importing Canadian hydropower could be one of the most cost-effective ways to move away from fossil fuels on the electric grid.
National Grid estimates the project will help save energy customers $8.3 billion in its first 12 years. The developers are constructing a $260 million “community benefits plan” that would take some profits from the transmission line and give that money back to communities that host the transmission lines and environmental justice communities in New England.
France 2025–2035 Energy Roadmap accelerates carbon neutrality via renewables expansion, energy efficiency, EV adoption, heat pumps, hydrogen, CCS, nuclear buildout, and wind and solar targets, cutting fossil fuels and emissions across transport, housing, industry.
Key Points
A national plan to cut fossil use and emissions, boost renewables, and scale efficiency and clean technologies.
✅ Cuts fossil share to 30% by 2035 with efficiency gains
✅ Scales solar PV and wind; revives nuclear with EPR 2
✅ Electrifies transport and industry with EVs, hydrogen, CCS
Paris is on the verge of finalising its energy roadmap for the period 2025–2035, with an imminent decree expected to be published by the end of the first quarter of 2025. This roadmap is part of France's broader strategy to achieve carbon neutrality by 2050, aligning with wider moves toward clean electricity regulations in other jurisdictions.
Key Objectives of the Roadmap
The energy roadmap outlines ambitious targets for reducing greenhouse gas emissions across various sectors, including transport, housing, food, and energy. The primary goals are:
Reducing Fossil Fuel Dependency: Building on the EU's plan to dump Russian energy, the share of fossil fuels in final energy consumption is to fall from 60% in 2022 to 42% in 2030 and 30% in 2035.
Enhancing Energy Efficiency: A target of a 28.6% reduction in energy consumption between 2012 and 2030 is set, focusing on conservation and energy efficiency measures.
Expanding Decarbonised Energy Production: The roadmap aims to accelerate the development of renewable energies and the revival.
Sector-Specific Targets
Transport: The government aims to cut emissions by 31, focusing on the growth of electric vehicles, increasing public transport, and expanding charging infrastructure.
Housing: Emissions from buildings are to be reduced by 44%, with plans to replace 75% of oil-fired and install 1 million heat pumps.
Agriculture and Food: The roadmap includes measures to reduce emissions from agriculture by 9%, promoting organic farming and reducing the use of nitrogen fertilizers.
Industry: A 37% reduction in emissions is targeted through the use of electricity, biomass, hydrogen, and CO₂ capture and storage technologies informed by energy technology pathways outlined in ETP 2017.
Renewable Energy Targets
The roadmap sets ambitious targets for renewable energy production that align with Europe's ongoing electricity market reform efforts:
Photovoltaic Power: A sixfold increase in photovoltaic power between 2022
Offshore Wind Power: Reaching 18 gigawatts up from 0.6 GW
Onshore Wind Power: Doubling capacity from 21 GW to 45 GW over the same period.
Nuclear Power: The commissioning of the evolutionary power and the construction of six EPR 2 reactors, underpinned by France's deal on electricity prices with EDF to support long-term investment, with the potential for eight more.
Implementation and Governance
The final version of the roadmap will be adopted by decree, alongside a proposed electricity pricing scheme to address EU concerns, rather than being enshrined in law as required by the Energy Code. The government had previously abandoned the energy-climate planning. The decree is expected to be published at the end of the Multiannual Energy Program (PPE) and in the second half of the third National Low-Carbon Strategy (SNBC).
Paris's finalisation of its energy roadmap for 2025–2035 marks a significant step towards achieving carbon neutrality by 2050. The ambitious targets set across various sectors reflect a comprehensive approach to reducing greenhouse gas emissions and transitioning to a more sustainable energy system amid the ongoing EU electricity reform debate shaping market rules. The imminent decree will provide the legal framework necessary to implement these plans and drive the necessary changes across the country.
Ukraine Winter Energy Strategy strengthens the power grid through infrastructure repairs, electricity imports, renewable integration, nuclear output, and conservation to ensure reliable heating, blackout mitigation, and grid resilience with international aid, generators, and transmission lines.
Key Points
A wartime plan to stabilize Ukraine's grid via repairs, imports, renewables, and nuclear to deliver reliable electricity.
✅ Repairs, imports, and demand management stabilize the grid.
✅ Renewables and nuclear reduce outage risks in winter.
✅ International aid supplies transformers, generators, expertise.
As Ukraine braces for the winter months, the question of how the country will keep the lights on has become a pressing concern, as the country fights to keep the lights on amid ongoing strikes. The ongoing war with Russia has severely disrupted Ukraine's energy infrastructure, leading to widespread damage to power plants, transmission lines, and other critical energy facilities. Despite these challenges, Ukraine has been working tirelessly to maintain its energy supply during the cold winter months, which are essential not only for heating but also for the functioning of homes, businesses, hospitals, and schools. Here's a closer look at the steps Ukraine is taking to keep the lights on this winter and ensure that its people have access to reliable electricity.
1. Repairing Damaged Infrastructure
One of the most immediate concerns for Ukraine's energy sector is the extensive damage inflicted on its power infrastructure by Russian missile and drone attacks. Since the war began in 2022, Ukraine has faced repeated attacks targeting power plants, substations, and power lines, including strikes on western regions that caused widespread outages across communities. These attacks have left parts of the country with intermittent or no electricity, and repairing the damage has been a monumental task.
However, Ukraine has made significant progress in restoring its energy infrastructure. Government agencies and energy companies have been working around the clock to repair power plants and transmission networks. Teams of technicians and engineers have been deployed to restore power to areas that have been hardest hit by Russian attacks, often under difficult and dangerous conditions. While some areas may continue to face outages, efforts to rebuild the energy grid are ongoing, with the government prioritizing critical infrastructure to ensure that hospitals, military facilities, and essential services have access to power.
2. Energy Efficiency and Conservation Measures
To cope with reduced energy availability and avoid overloading the grid, Ukrainian authorities have been encouraging energy efficiency and conservation measures. These efforts are particularly important during the winter when demand for electricity and heating is at its peak.
The government has implemented energy-saving programs, urging citizens and businesses to reduce their consumption and adopt new energy solutions that can be deployed quickly. Measures include limiting electricity use during peak hours, setting thermostats lower in homes and businesses, and encouraging the use of energy-efficient appliances. Ukrainian officials have also been promoting public awareness campaigns to educate people about the importance of energy conservation, which is crucial to avoid grid overload and ensure the distribution of power across the country.
3. Importing Energy from Abroad
To supplement domestic energy production, Ukraine has been working to secure electricity imports from neighboring countries. Ukraine has long been interconnected with energy grids in countries such as Poland, Slovakia, and Hungary, which allows it to import electricity during times of shortage. In recent months, Ukraine has ramped up efforts to strengthen these connections, ensuring that it can import electricity when domestic production is insufficient to meet demand, and in a notable instance, helped Spain during blackouts through coordinated cross-border support.
While electricity imports from neighboring countries provide a temporary solution, this is not without its challenges. The cost of importing electricity can be high, and the country’s ability to import large amounts of power depends on the availability of energy in neighboring nations; officials say there are electricity reserves and no scheduled outages if strikes do not resume. Ukraine has been actively seeking new energy partnerships and working with international organizations to secure access to electricity, including exploring the potential for importing energy from the European Union.
4. Harnessing Renewable Energy Sources
Another key part of Ukraine's strategy to keep the lights on this winter is tapping into renewable energy sources, particularly wind and solar power. While Ukraine’s energy sector has historically been dependent on fossil fuels, the country has been making strides in integrating renewable energy into its grid. Solar and wind energy are particularly useful in supplementing the national grid, especially during the winter months when demand is high.
Renewable energy sources are less vulnerable to missile strikes compared to traditional power plants, making them an attractive option for Ukraine's energy strategy. Although renewable energy currently represents a smaller portion of Ukraine’s overall energy mix, its contribution is expected to increase as the country invests more in clean energy infrastructure. In addition to reducing dependence on fossil fuels, this shift is aligned with Ukraine’s broader environmental goals and will be important for the long-term sustainability of its energy sector.
5. International Aid and Support
International support has been crucial in helping Ukraine keep the lights on during the war. Western allies, including the European Union and the United States, have provided financial assistance, technical expertise, and equipment to help restore the energy infrastructure, though Washington recently ended some grid restoration support as priorities shifted. In addition to rebuilding power plants and transmission lines, Ukraine has received advanced energy technologies and materials to strengthen its energy security.
The U.S. has sent electrical transformers, backup generators, and other essential equipment to help Ukraine restore its energy grid. The European Union has also provided both financial and technical assistance, supporting Ukraine’s efforts to integrate more renewable energy into its grid and enhancing the country’s ability to import electricity from neighboring states.
6. The Role of Nuclear Energy
Ukraine’s nuclear energy plants play a critical role in the country’s electricity supply. Before the war, nuclear power accounted for around 50% of Ukraine’s total electricity generation, and for communities near the front line, electricity is civilization that depends on reliable baseload. Despite the ongoing conflict, Ukrainian nuclear plants have remained operational, though they face heightened security risks due to the proximity of active combat zones.
In the winter months, nuclear plants are expected to continue providing a significant portion of Ukraine's electricity, which is essential for meeting the country's heating and power needs. The government has made efforts to ensure the safety and security of these plants, which remain a vital part of the country's energy strategy.
Keeping the lights on in Ukraine during the winter of 2024 is no small feat, given the war-related damage to energy infrastructure, rising energy demands, and ongoing security risks. However, the Ukrainian government has taken proactive steps to address these challenges, including repairing critical infrastructure, importing energy from neighboring countries, promoting energy efficiency, and expanding renewable energy sources. International aid and the continued operation of nuclear plants also play a vital role in ensuring a reliable energy supply. While challenges remain, Ukraine’s resilience and determination to overcome its energy crisis are clear, and the country is doing everything it can to keep the lights on through this difficult winter.
Spain Electricity Prices surge to record highs as the wholesale market hits €339.84/MWh, driven by gas costs and CO2 permits, impacting PVPC regulated tariffs, free-market contracts, and household energy bills, OMIE data show.
Key Points
Rates in Spain's wholesale market that shape PVPC tariffs and free-market bills, moving with gas prices and CO2 costs.
✅ Record €339.84/MWh; peak 20:00-21:00; low 04:00-05:00 (OMIE).
✅ PVPC users and free-market contracts face higher bills.
✅ Drivers: high gas prices and rising CO2 emission rights.
Electricity in Spain's wholesale market will rise in price once more as European electricity prices continue to surge. Once again, it will set a historical record in Spain, reaching €339.84/MWh. With this figure, it is already the fifth time that the threshold of €300 has been exceeded.
This new high is a 6.32 per cent increase on today’s average price of €319.63/MWh, which is also a historic record, while Germany's power prices nearly doubled over the past year. Monday’s energy price will make it 682.65 per cent higher than the corresponding date in 2020, when the average was €43.42.
According to data published by the Iberian Energy Market Operator (OMIE), Monday’s maximum will be between the hours of 8pm and 9pm, reaching €375/MWh, a pattern echoed by markets where Electric Ireland price hikes reflect wholesale volatility. The cheapest will be from 4am to 5am, at €267.99.
The prices of the ‘pool’ have a direct effect on the regulated tariff – PVPC – to which almost 11 million consumers in the country are connected, and serve as a reference for the other 17 million who have contracted their supply in the free market, where rolling back prices is proving difficult across Europe.
These spiraling prices in recent months, which have fueled EU energy inflation, are being blamed on high gas prices in the markets, and carbon dioxide (CO2) emission rights, both of which reached record highs this year.
According to an analysis by Facua-Consumidores en Acción, if the same rates were maintained for the rest of the month, the last invoice of the year would reach €134.45 for the average user. That would be 94.1 per cent above the €69.28 for December 2020, while U.S. residential electricity bills rose about 5% in 2022 after inflation adjustments.
The average user’s bill so far this year has increased by 15.1 per cent compared to 2018, as US electricity prices posted their largest jump in 41 years. Thus, compared to the €77.18 of three years ago, the average monthly bill now reaches €90.87 euros. However, the Government continues to insist that this year households will end up paying the same as in 2018.
As Ruben Sanchez, the general secretary of Facua commented, “The electricity bill for December would have to be negative for President Sanchez, and Minister Ribera, to fulfill their promise that this year consumers will pay the same as in 2018 once the CPI has been discounted”.
Australia Electricity Supply Shortfall highlights AEMO's warning of reduced reserves as coal retirements outpace capacity, risking load shedding. Calls for 1GW strategic reserves and investment in renewables, storage, and dispatchable power in Victoria.
Key Points
It is AEMO's forecast of reduced reserves, higher outage risk, and a need for 1GW strategic backup capacity.
✅ AEMO urges 1GW strategic reserves in Victoria and South Australia
✅ Investment needed: renewables, storage, grid and reliability services
Australia’s electricity operator has warned of threats to electricity supply including a shortfall in generation and reduced power reserves on the horizon.
The Australian Energy Market Operator (AEMO) has called for further investment in the country’s energy portfolio as retiring coal plants are replaced by intermittent renewables poised to eclipse coal, leaving the grid with less back-up capacity.
AEMO has said this increases the chances of supply interruption and load shedding.
It added the federal government should target 1GW of strategic reserves in the states most at risk – Victoria and South Australia, even as the Prime Minister has ruled out taxpayer-funded power plants in the current energy battle.
CEO of the Clean Energy Council, Kane Thornton, said the shortfall in generation, reflected in a short supply of electricity, was due a decade of indecisiveness and debate leading to a “policy vacuum”.
He added: “The AEMO report revealed that the new projects added to the system under the renewable energy target will help to improve reliability over the next few years.
“We need to accept that the energy system is in transition, with lessons from dispatchable power shortages in Europe, and long term policy is now essential to ensure private investment in the most efficient new energy technology and solutions.”