India Power Sector Crisis: a tangled market of underused plants, coal shortages, cross-subsidies, high transmission losses, and weak PPAs, requiring deregulation, power exchanges, and cost-reflective tariffs to fix insolvency and outages.
Key Points
India power market failure from subsidies, coal shortages, and losses, needing deregulation and reflective pricing.
✅ Deregulate to enable spot trading on power exchanges
✅ End cross-subsidies; charge cost-reflective tariffs
✅ Secure coal supply; cut T&D losses and theft
India's electricity industry is in a financial and political tangle.
Power producers sit on thousands of megawatts of underutilized plant, while consumers face frequent power cuts, both planned and unplanned.
Financially troubled generators struggle to escape insolvency proceedings. The state-owned banks that have mostly financed power utilities fear that debts of troubled utilities totaling 1.74 trillion rupees will soon go bad.
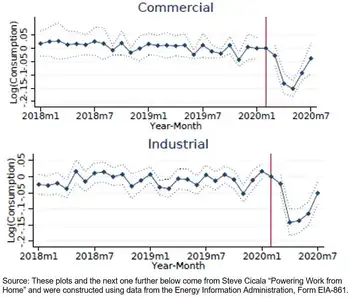
Aggressive bidding for supply contracts and slower-than-expected demand growth, including a recent demand slump in electricity use, is the root cause. The problems are compounded by difficulties in securing coal and other fuels, high transmission losses, electricity theft and cash-starved distribution companies.
But India's 36 state and union territory governments are contributing mightily to this financial and economic mess. They persist with populist cross-subsidies -- reducing charges for farmers and households at the cost of nonagricultural businesses, especially energy-intensive manufacturing sectors such as steel.
The states refuse to let go of their control over how electricity is produced, distributed and consumed. And they are adamant that true markets, with freedom for large industrial users to buy power at market-determined rates from whichever utility they want at power exchanges -- will not become a reality in India.
State politicians are driven mainly by the electoral need to appease farmers, India's most important vote bank, who have grown used to decades of nearly-free power.
New Delhi is therefore relying on short-term fixes instead of attempting to overhaul a defunct system. Users must pay the real cost of their electricity, as determined by a properly integrated national market free of state-level interference if India's power mess is to be really addressed.
As of Aug. 31, the country's total installed production capacity was 344,689 MW, underscoring its status as the third-largest electricity producer globally by output. Out of that, thermal power comprising coal, gas and diesel accounted for 64%, hydropower 13% and renewables accounted for 20%. Commercial and industrial users accounted for 55% of consumption followed by households on 25% and the remaining 20% by agriculture.
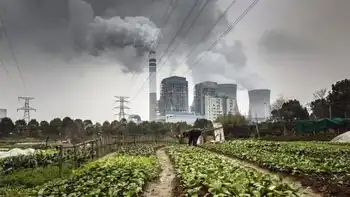
Coal-fired power generation, which contributes roughly 90% of thermal output and the bulk of the financially distressed generators, is the most troubled segment as it faces a secular decline in tariffs due to increasing competition from highly subsidized renewables (which also benefit from falling solar panel costs), coal shortages and weak demand.
The Central Electricity Act (CEA) 2003 opened the gates of the country's power sector for private players, who now account for 45% of generating capacity.
But easy credit, combined with an overconfident estimation of the risks involved, emboldened too many investors to pile in, without securing power purchase agreements (PPAs) with distribution companies.
As a result, power capacity grew at an annual compound rate of 11% compared to demand at 6% in the last decade leading to oversupply.
This does not mean that the electricity market is saturated. Merely that there are not enough paying customers. Distributors have plenty of consumers who will not or cannot pay, even though they have connections. There is huge unmet demand for power. There are 32 million Indian homes -- roughly 13% of the total -- mostly rural and poor with no access to electricity.
Moreover, consumption by those big commercial and industrial users which do not enjoy privileged rates is curbed by high prices, driven up by the cost of subsidizing others, extra charges on exchange-traded power and transmission and distribution losses (including theft) of 20-30%.
With renewables increasingly becoming cheaper, financially stressed distributors are avoiding long-term power purchase agreements, preferring spot markets. Meanwhile, coal shortages force generators to buy expensive imported coal supplies or cut output. The operating load for most private generators, which suffer particularly acute coal shortages in compared to state-owned utilities, has fallen from 84% in 2009-2010 to 55% now.
Smoothing coal supplies should be the top priority. Often coal is denied to power generators without long-term purchase contracts. Such discrimination in coal allocation prevails -- because the seller (state-run Coal India and its numerous subsidiaries) is an inefficient monopolist which cannot produce enough and rations coal supplies, favoring state-run generators over private.
To help power producers, New Delhi plans measures including auctioning power sales contracts with assured access to coal. However, even though coal and electricity shortages eased recently, such short-term fixes won't solve the problem. With electricity prices in secular decline, distributors are not seeking long-term supply contracts -- rather they are often looking for excuses to get out of existing agreements.
India needs a fundamental two-step reform. First, the market must be deregulated to allow most bulk suppliers and users to move to power trading exchanges, which currently account for just 10% of the market.
This would lead to genuine price discovery in a spot market and, in time, lead to the trading of electricity futures contracts. That would help in consumers and producers hedge their respective costs and revenues and safeguard their economic positions without any need for government intervention.
The second step to a healthy electricity industry is for consumers to pay the real cost of power. Cross-subsidization must end. That would promote optimal electricity use, innovation and environmental protection. Farmers enjoying nearly-free power create ecological problems by investing in water-guzzling crops such as rice and sugar cane.
Most industrial consumers, who do not have power supply privileges, have their businesses distorted and delayed by high prices. Lowering their costs would encourage power-intensive manufacturing to expand, and in the process, boost electricity demand and improve capacity utilization.
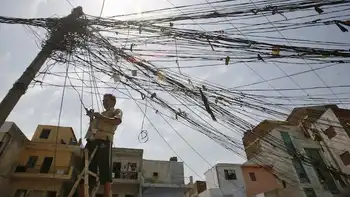
Of course, cutting theft is central to making consumers pay their way. Government officials must stop turning a blind eye to theft, especially when such transmission and distribution losses average 20%.
Politicians who want to continue subsidizing farmers or assist the poor can do so by paying cash out directly to their bank accounts, instead of wrongly relying on the power sector.
Such market-oriented reforms have long been blocked by state-level politicians, who now enjoy the influence born of operating subsidies and interfering in the sector. New Delhi must address this opposition. Narendra Modi, as a self-styled reforming prime minister, should have the courage to bite this bullet and convince state governments (starting with those ruled by his Bharatiya Janata Party) to reform. To encourage cooperation, he could offer states securing real improvements an increased share of centrally collected taxes.
Ritesh Kumar Singh is to be the chief economist of the new policy research and advocacy company Indonomics Consulting. He is former assistant director of the Finance Commission of India.
Related News