Let's use real energy numbers

By The Mercury News


High Voltage Maintenance Training Online

Our customized live online or in‑person group training can be delivered to your staff at your location.

  • Live Online
  • 12 hours Instructor-led
  • Group Training Available
Regular Price:
$599
Coupon Price:
$499
Reserve Your Seat Today
With the election over, let's use real numbers when discussing energy.

Jim Barksdale, founding CEO of Netscape, preached "you can't manage what you don't measure." I agree. But in today's concerns about energy independence or security, numbers don't seem to matter. Examples abound from this election:

1) We're sending $700 billion abroad to buy imported oil. Fact: Our net cost of imported oil this year will be about $400 billion due to the midyear price spike.

2) We're dependent on the Middle East for our oil. Fact: We import oil from 60 countries; Canada and Mexico are our first and third largest suppliers. Persian Gulf suppliers provide less than 20 percent of imports; thus, we send about $5 billion a month to the gulf.

3) We import 70 percent of our oil. Fact: Our import percentage peaked in 2005 at 60.3 percent and now runs at 56.5 percent.

4) We have 3 percent of the world's oil reserves. Fact: There's no agreement on the size of global reserves with OPEC nations playing games to get more allocation; we continue to maintain up to a 10-year "backlog" of available oil.

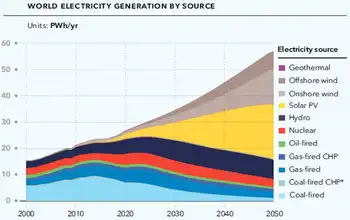
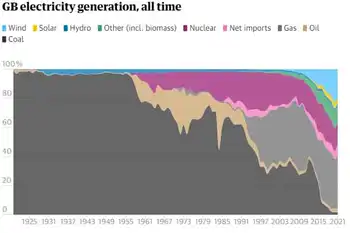
5) Turn off your lights to save imported oil. Fact: Oil plays virtually no role in electricity production, which nationally comes from coal (50 percent), nuclear power (20 percent), natural gas (18 percent), and hydro (7 percent). Wind and solar currently contribute less than 2 percent.

One commercial used words like "government is doing nothing."

Government may not have acted on many issues, but energy is not one of them.

With recent federal mandates, oil imports are actually down 10 percent since 2005 from 12.5 million barrels per day (mbpd) to an estimated 11.3 mbpd this year. Ethanol replaced 0.6 mbpd (even at $65 a barrel, that saves $14 billion a year); U.S. oil production is up 0.4 mbpd since 2005 and conservation saved 0.3-0.5 mbpd.

More important, Congress finally escaped the clutches of Rep. John Dingell, D-Mich., and allowed car and light truck fuel standards to dramatically increase after 15 years of stonewalling.

Oil serves two primary purposes in our society — 70 percent for transportation and 25 percent in manufactured products. We'll use internal combustion engines for many more decades, but increasing efficiency and using biofuels and electricity will decrease oil needs.

In manufacturing, where 300,000 commercial products from plastics to tires, to road surfaces on down to lipstick and other lubricants use oil, bio-based products hold promise.

So, bioproducts and plentiful electricity hold the key to "oil" security. We're doing well in biofuels, but we need to stick to it and keep the biofuels mandates of the 2007 mandate. Our universities and entrepreneurs are making great strides in converting biomaterials to the needs of both transportation and manufacturing.

The electricity picture is less clear. Here, in California, we may be proud of the low per capita use of electricity, but details suggest that our "progress" is due to driving electricity dependent manufacturing and the jobs that go along out of the state and even out of the country.

Electricity is essential to drive our economy; to ultimately help power our cars, trucks and, perhaps, trains; to meet our water needs through desalination. The numbers aren't encouraging. I'm as committed to renewables as anyone, but base load power that generates 24/7 is needed for industry and many residential needs. Turning nuclear and other clean base load alternatives on again makes economic as well as environmental sense.

In three years, we've reduced our demand for imported oil by 10 percent — a $40 billion a year savings. Biofuels and base load electricity will continue that progress. Let's cut out the misinformation, inform the public of the real numbers and achieve genuine energy leadership.

Related News

Philippines wants Canada's help to avoid China, U.S

Philippines-Canada Indo-Pacific Partnership strengthens ASEAN cooperation, maritime security, and South China Sea diplomacy, balancing U.S.-China rivalry through a rules-based order, trade diversification, and middle-power engagement to foster regional stability and sustainable growth.


Key Points

A strategic pact to balance U.S.-China rivalry, back ASEAN, and advance maritime security and a rules-based order

✅ Prioritizes ASEAN-led cooperation and regional diplomacy

✅ Supports maritime security and South China Sea stability

✅ Diversifies trade, infrastructure, energy, and education ties


The Philippines finds itself caught in a geopolitical tug-of-war between the United States and China, two superpowers with competing interests in the Indo-Pacific region. To navigate this complex situation, the Philippines is seeking closer ties with Canada, a middle power with a strong focus on diplomacy and regional cooperation and a deepening U.S.-Canada energy and minerals partnership that reinforces shared strategic interests.

The Philippines, like many Southeast Asian nations, desires peace and stability for continued economic growth. However, the intensifying rivalry between the U.S. and China threatens to disrupt this. Territorial disputes in the South China Sea, where China claims vast swathes of waters contested by the Philippines, are a major point of contention. The Philippines has a long-standing alliance with the U.S., whose current administration is viewed as better for Canada's energy sector by some observers, but it also has growing economic ties with China. This delicate balancing act is becoming increasingly difficult.

This is where Canada enters the picture. The Philippines sees Canada as a potential bridge between the two superpowers. Foreign Affairs Secretary Enrique Manalo emphasizes that the future of the Indo-Pacific shouldn't be dictated by "great power rivalry." Canada, with its emphasis on peaceful solutions and its strong relationships with both the U.S. and China, despite electricity exports at risk from periodic trade tensions, presents a welcome alternative.

There are several reasons why the Philippines views Canada as a natural partner. First, Canada's Indo-Pacific strategy prioritizes the Association of Southeast Asian Nations (ASEAN), a regional bloc that includes the Philippines, and reflects trade policy debates in Ottawa where Canadians support tariffs on energy and minerals. This focus on regional cooperation aligns with the Philippines' desire for a united ASEAN voice.

Second, Canada offers the Philippines opportunities for economic diversification. While China is a significant trading partner, the Philippines wants to lessen its dependence on any single power. Canada's expertise in areas like agriculture, infrastructure, education, and renewable energy aligns with the Philippines' clean energy commitment and development goals.

Third, Canada's experience in peacekeeping and maritime security can be valuable to the Philippines. The Philippines faces challenges in the South China Sea, and Canada's commitment to a rules-based international order resonates with the Philippines' desire for peaceful resolution of territorial disputes.

Canada, for its part, sees the Philippines as a strategically important partner in the Indo-Pacific. A stronger Philippines contributes to a more stable region, which aligns with Canada's own interests. Additionally, closer ties with the Philippines open doors for increased Canadian trade and investment in Southeast Asia, including in critical minerals supply chains and energy projects.

The Philippines' pursuit of a middle ground between the U.S. and China is not without its challenges. Balancing strong relationships with both powers requires careful diplomacy, even as tariff threats boost support for Canadian energy projects domestically. However, Canada's emergence as a potential partner offers the Philippines a much-needed counterweight and a path towards regional stability and economic prosperity.

By working together, Canada and the Philippines can promote peaceful solutions, strengthen regional cooperation, and ensure that the Indo-Pacific remains a place of opportunity for all nations, not just superpowers.


Related News

View more

Why electric buses haven't taken over the world—yet

Electric Buses reduce urban emissions and noise, but require charging infrastructure, grid upgrades, and depot redesigns; they offer lower operating costs and simpler maintenance, with range limits influencing routes, schedules, and on-route fast charging.


Key Points

Battery-electric buses cut emissions and noise while lowering operating and maintenance costs for transit agencies.

✅ Lower emissions, noise; improved rider experience

✅ Requires charging, grid upgrades, depot redesigns

✅ Range limits affect routes; on-route fast charging helps


In lots of ways, the electric bus feels like a technology whose time has come. Transportation is responsible for about a quarter of global emissions, and those emissions are growing faster than in any other sector. While buses are just a small slice of the worldwide vehicle fleet, they have an outsize effect on the environment. That’s partly because they’re so dirty—one Bogotá bus fleet made up just 5 percent of the city’s total vehicles, but a quarter of its CO2, 40 percent of nitrogen oxide, and more than half of all its particulate matter vehicle emissions. And because buses operate exactly where the people are concentrated, we feel the effects that much more acutely.

Enter the electric bus. Depending on the “cleanliness” of the electric grid into which they’re plugged, e-buses are much better for the environment. They’re also just straight up nicer to be around: less vibration, less noise, zero exhaust. Plus, in the long term, e-buses have lower operating costs, and related efforts like US school bus electrification are gathering pace too.

So it makes sense that global e-bus sales increased by 32 percent last year, according to a report from Bloomberg New Energy Finance, as the age of electric cars accelerates across markets worldwide. “You look across the electrification of cars, trucks—it’s buses that are leading this revolution,” says David Warren, the director of sustainable transportation at bus manufacturer New Flyer.

Today, about 17 percent of the world’s buses are electric—425,000 in total. But 99 percent of them are in China, where a national mandate promotes all sorts of electric vehicles. In North America, a few cities have bought a few electric buses, or at least run limited pilots, to test the concept out, and early deployments like Edmonton's first e-bus offer useful lessons as systems ramp up. California has even mandated that by 2029 all buses purchased by its mass transit agencies be zero-emission.

But given all the benefits of e-buses, why aren’t there more? And why aren’t they everywhere?

“We want to be responsive, we want to be innovative, we want to pilot new technologies and we’re committed to doing so as an agency,” says Becky Collins, the manager of corporate initiative at the Southeastern Pennsylvania Transportation Authority, which is currently on its second e-bus pilot program. “But if the diesel bus was a first-generation car phone, we’re verging on smartphone territory right now. It’s not as simple as just flipping a switch.”

One reason is trepidation about the actual electric vehicle. Some of the major bus manufacturers are still getting over their skis, production-wise. During early tests in places like Belo Horizonte, Brazil, e-buses had trouble getting over steep hills with full passenger loads. Albuquerque, New Mexico, canceled a 15-bus deal with the Chinese manufacturer BYD after finding equipment problems during testing. (The city also sued). Today’s buses get around 225 miles per charge, depending on topography and weather conditions, which means they have to re-up about once a day on a shorter route in a dense city. That’s an issue in a lot of places.

If you want to buy an electric bus, you need to buy into an entire electric bus system. The vehicle is just the start.

The number one thing people seem to forget about electric buses is that they need to get charged, and emerging projects such as a bus depot charging hub illustrate how infrastructure can scale. “We talk to many different organizations that get so fixated on the vehicles,” says Camron Gorguinpour, the global senior manager for the electric vehicles at the World Resources Institute, a research organization, which last month released twin reports on electric bus adoption. “The actual charging stations get lost in the mix.”

But charging stations are expensive—about $50,000 for your standard depot-based one. On-route charging stations, an appealing option for longer bus routes, can be two or three times that. And that’s not even counting construction costs. Or the cost of new land: In densely packed urban centers, movements inside bus depots can be tightly orchestrated to accommodate parking and fueling. New electric bus infrastructure means rethinking limited space, and operators can look to Toronto's TTC e-bus fleet for practical lessons on depot design. And it’s a particular pain when agencies are transitioning between diesel and electric buses. “The big issue is just maintaining two sets of fueling infrastructure,” says Hanjiro Ambrose, a doctoral student at UC Davis who studies transportation technology and policy.

“We talk to many different organizations that get so fixated on the vehicles. The actual charging stations get lost in the mix as the American EV boom gathers pace across sectors.”

Then agencies also have to get the actual electricity to their charging stations. This involves lengthy conversations with utilities about grid upgrades, rethinking how systems are wired, occasionally building new substations, and, sometimes, cutting deals on electric output, since electric truck fleets will also strain power systems in parallel. Because an entirely electrified bus fleet? It’s a lot to charge. Warren, the New Flyer executive, estimates it could take 150 megawatt-hours of electricity to keep a 300-bus depot charged up throughout the day. Your typical American household, by contrast, consumes 7 percent of that—per year. “That’s a lot of work by the utility company,” says Warren.

For cities outside of China—many of them still testing out electric buses and figuring out how they fit into their larger fleets—learning about what it takes to run one is part of the process. This, of course, takes money. It also takes time. Optimists say e-buses are more of a question of when than if. Bloomberg New Energy Finance projects that just under 60 percent of all fleet buses will be electric by 2040, compared to under 40 percent of commercial vans and 30 percent of passenger vehicles.

Which means, of course, that the work has just started. “With new technology, it always feels great when it shows up,” says Ambrose. “You really hope that first mile is beautiful, because the shine will come off. That’s always true.”


Related News

View more

Switch from fossil fuels to electricity could cost $1.4 trillion, Canadian Gas Association warns

Canada Electrification Costs: report estimates $580B-$1.4T to scale renewable energy, wind, solar, and storage capacity to 2050, shifting from natural gas toward net-zero emissions and raising average household energy spending by $1,300-$3,200 annually.


Key Points

Projected national expense to expand renewables and electrify energy systems by 2050, impacting household energy bills.

✅ $580B-$1.4T forecast for 2020-2050 energy transition

✅ 278-422 GW wind, solar, storage capacity by 2050

✅ Household costs up $1,300-$3,200 per year on average


The Canadian Gas Association says building renewable electricity capacity to replace just half of Canada's current fossil fuel-generated energy, a shift with significant policy implications for grids across provinces, could increase national costs by as much as $1.4 trillion over the next 30 years.

In a report, it contends, echoing an IEA report on net-zero, that growing electricity's contribution to Canada's energy mix from its current 19 per cent to about 60 per cent, a step critical to meeting climate pledges that policymakers emphasize, will require an expansion from 141 gigawatts today to between 278 and 422 GW of renewable wind, solar and storage capacity by 2050.

It says that will increase national energy costs by between $580 billion and $1.4 trillion between 2020 and 2050, a projection consistent with recent reports of higher electricity prices in Alberta amid policy shifts, translating into an average increase in Canadian household spending of $1,300 to $3,200 per year.

The study, prepared by consulting firm ICF for the association, assumes electrification begins in 2020 and is applied in all feasible applications by 2050, with investments in the electricity system, guided by the implications of decarbonizing the grid for reliability and cost, proceeding as existing natural gas and electric end use equipment reaches normal end of life.

Association CEO Tim Egan says the numbers are "pretty daunting" and support the integration of natural gas with electric, amid Canada's race to net-zero commitments, instead of using an electric-only option as the most cost-efficient way for Canada to reach environmental policy goals.

But Keith Stewart, senior energy strategist with Greenpeace Canada, says scientists are calling for the world to get to net-zero emissions by 2050, and Canada's net-zero by 2050 target underscores that urgency to avoid "catastrophic" levels of warming, so investing in natural gas infrastructure to then shut it down seems a "very expensive option."


Related News

View more

UK low-carbon electricity generation stalls in 2019

UK low-carbon electricity 2019 saw stalled growth as renewables rose slightly, wind expanded, nuclear output fell, coal hit record lows, and net-zero targets demand faster deployment to cut CO2 intensity below 100gCO2/kWh.


Key Points

Low-carbon sources supplied 54% of UK power in 2019, up just 1TWh; wind grew, nuclear fell, and coal dropped to 2%.

✅ Wind up 8TWh; nuclear down 9TWh amid outages

✅ Fossil fuels 43% of generation; coal at 2%

✅ Net-zero needs 15TWh per year added to 2030


The amount of electricity generated by low-carbon sources in the UK stalled in 2019, Carbon Brief analysis shows.

Low-carbon electricity output from wind, solar, nuclear, hydro and biomass rose by just 1 terawatt hour (TWh, less than 1%) in 2019. It represents the smallest annual increase in a decade, where annual growth averaged 9TWh. This growth will need to double in the 2020s to meet UK climate targets while replacing old nuclear plants as they retire.

Some 54% of UK electricity generation in 2019 came from low-carbon sources, including 37% from renewables and 20% from wind alone, underscoring wind's leading role in the power mix during key periods. A record-low 43% was from fossil fuels, with 41% from gas and just 2% from coal, also a record low. In 2010, fossil fuels generated 75% of the total.

Carbon Brief’s analysis of UK electricity generation in 2019 is based on figures from BM Reports and the Department for Business, Energy and Industrial Strategy (BEIS). See the methodology at the end for more on how the analysis was conducted.

The numbers differ from those published earlier in January by National Grid, which were for electricity supplied in Great Britain only (England, Wales and Scotland, but excluding Northern Ireland), including via imports from other countries.

Low-carbon low
In 2019, the UK became the first major economy to target net-zero greenhouse gas emissions by 2050, increasing the ambition of its legally binding Climate Change Act.

To date, the country has cut its emissions by around two-fifths since 1990, with almost all of its recent progress coming from the electricity sector.

Emissions from electricity generation have fallen rapidly in the decade since 2010 as coal power has been almost phased out and even gas output has declined. Fossil fuels have been displaced by falling demand and by renewables, such as wind, solar and biomass.

But Carbon Brief’s annual analysis of UK electricity generation shows progress stalled in 2019, with the output from low-carbon sources barely increasing compared to a year earlier.

The chart below shows low-carbon generation in each year since 2010 (grey bars) and the estimated level in 2019 (red). The pale grey bars show the estimated future output of existing low-carbon sources after old nuclear plants retire and the pale red bars show the amount of new generation needed to keep electricity sector emissions to less than 100 grammes of CO2 per kilowatt hour (gCO2/kWh), the UK’s nominal target for the sector.

 Annual electricity generation in the UK by fuel, terawatt hours, 2010-2019. Top panel: fuel by fuel. Bottom panel: cumulative total generation from all sources. Source: BEIS energy trends, BM Reports and Carbon Brief analysis. Chart by Carbon Brief using Highcharts.
As the chart shows, the UK will require significantly more low-carbon electricity over the next decade as part of meeting its legally binding climate goals.

The nominal 100gCO2/kWh target for 2030 was set in the context of the UK’s less ambitious goal of cutting emissions to 80% below 1990 levels by 2050. Now that the country is aiming to cut emissions to net-zero by 2050, that 100gCO2/kWh indicator is likely to be the bare minimum.

Even so, it would require a rapid step up in the pace of low-carbon expansion, compared to the increases seen over the past decade. On average, low-carbon generation has risen by 9TWh each year in the decade since 2010 – including a rise of just 1TWh in 2019.

Given scheduled nuclear retirements and rising demand expected by the Committee on Climate Change (CCC) – with some electrification of transport and heating – low-carbon generation would need to increase by 15TWh each year until 2030, just to meet the benchmark of 100gCO2/kWh.

For context, the 3.2 gigawatt (GW) Hinkley C new nuclear plant being built in Somerset will generate around 25TWh once completed around 2026. The world’s largest offshore windfarm, the 1.2GW Hornsea One scheme off the Yorkshire coast, will generate around 5TWh each year.

The new Conservative government is targeting 40GW of offshore wind by 2030, up from today’s figure of around 8GW. If policies are put in place to meet this goal, then it could keep power sector emissions below 100gCO2/kWh, depending on the actual performance of the windfarms built.

However, new onshore wind and solar, further new nuclear or other low-carbon generation, such as gas with carbon capture and storage (CCS), is likely to be needed if demand is higher than expected, or if the 100gCO2/kWh benchmark is too weak in the context of net-zero by 2050.

The CCC says it is “likely” to “reflect the need for more rapid deployment” of low-carbon towards net-zero emissions in its advice on the sixth UK carbon budget for 2033-2037, due in September.

Trading places
Looking more closely at UK electricity generation in 2019, Carbon Brief’s analysis shows why there was so little growth for low-carbon sources compared to the previous year.

There was another increase for wind power in 2019 (up 8TWh, 14%), with record wind generation as several large new windfarms were completed including the 1.2GW Hornsea One project in October and the 0.6GW Beatrice offshore windfarm in Q2 of 2019. But this was offset by a decline for nuclear (down 9TWh, 14%), due to ongoing outages for reactors at Hunterston in Scotland and Dungeness in Kent.

(Analysis of data held by trade organisation RenewableUK suggests some 0.6GW of onshore wind capacity also started operating in 2019, including the 0.2GW Dorenell scheme in Moray, Scotland.)

As a result of these movements, the UK’s windfarms overtook nuclear for the first time ever in 2019, becoming the country’s second-largest source of electricity generation, and earlier, wind and solar together surpassed nuclear in the UK as momentum built. This is shown in the figure below, with wind (green line, top panel) trading places with nuclear (purple) and gas (dark blue) down around 25% since 2010 but remaining the single-largest source.

 Annual electricity generation in the UK by fuel, terawatt hours, 2010-2019. Top panel: fuel by fuel. Bottom panel: cumulative total generation from all sources. Source: BEIS energy trends, BM Reports and Carbon Brief analysis. Chart by Carbon Brief using Highcharts.
The UK’s currently suspended nuclear plants are due to return to service in January and March, according to operator EDF, the French state-backed utility firm. However, as noted above, most of the UK’s nuclear fleet is set to retire during the 2020s, with only Sizewell B in Suffolk due to still be operating by 2030. Hunterston is scheduled to retire by 2023 and Dungeness by 2028.

Set against these losses, the UK has a pipeline of offshore windfarms, secured via “contracts for difference” with the government, at a series of auctions. The most recent auction, in September 2019, saw prices below £40 per megawatt hour – similar to current wholesale electricity prices.

However, the capacity contracted so far is not sufficient to meet the government’s target of 40GW by 2030, meaning further auctions – or some other policy mechanism – will be required.

Coal zero
As well as the switch between wind and nuclear, 2019 also saw coal fall below solar for the first time across a full year, echoing the 2016 moment when wind outgenerated coal across the UK, after it suffered another 60% reduction in electricity output. Just six coal plants remain in the UK, with Aberthaw B in Wales and Fiddlers Ferry in Cheshire closing in March.

Coal accounted for just 2% of UK generation in 2019, a record-low coal share since centralised electricity supplies started to operate in 1882. The fuel met 40% of UK needs as recently as 2012, but has plummeted thanks to falling demand, rising renewables, cheaper gas and higher CO2 prices.

The reduction in average coal generation hides the fact that the fuel is now often not required at all to meet the UK’s electricity needs. The chart below shows the number of days each year when coal output was zero in 2019 (red line) and the two previous years (blue).

 Cumulative number of days when UK electricity generation from renewable sources has been higher than that from fossil fuels. Source: BEIS energy trends, BM Reports and Carbon Brief analysis. Chart by Carbon Brief using Highcharts.
The 83 days in 2019 with zero coal generation amount to nearly a quarter of the year and include the record-breaking 18-day stretch without the fuel.

Great Britain has been running for a record TWO WEEKS without using coal to generate electricity – the first time this has happened since 1882.

The country’s grid has been coal-free for 45% of hours in 2019 so far.https://www.carbonbrief.org/countdown-to-2025-tracking-the-uk-coal-phase-out …

Coal generation was set for significant reductions around the world in 2019 – including a 20% reduction for the EU as a whole – according to analysis published by Carbon Brief in November.

Notably, overall UK electricity generation fell by another 9TWh in 2019 (3%), bringing the total decline to 58TWh since 2010. This is equivalent to more than twice the output from the Hinkley C scheme being built in Somerset. As Carbon Brief explained last year, falling demand has had a similar impact on electricity-sector CO2 emissions as the increase in output from renewables.

This is illustrated by the fact that the 9TWh reduction in overall generation translated into a 9TWh (6%) cut in fossil-fuel generation during 2019, with coal falling by 10TWh and gas rising marginally.

Increasingly renewable
As fossil-fuel output and overall generation have declined, the UK’s renewable sources of electricity have continued to increase. Their output has risen nearly five-fold in the past decade and their share of the UK total has increased from 7% in 2010 to 37% in 2019.

As a result, the UK’s increasingly renewable grid is seeing more minutes, hours and days during which the likes of wind, solar and biomass collectively outpace all fossil fuels put together, and on some days wind is the main source as well.

The chart below shows the number of days during each year when renewables generated more electricity than fossil fuels in 2019 (red line) and each of the previous four years (blue lines). In total, nearly two-fifths of days in 2019 crossed this threshold.

 Cumulative number of days when the UK has not generated any electricity from coal. Source: BEIS energy trends, BM Reports and Carbon Brief analysis. Chart by Carbon Brief using Highcharts.
There were also four months in 2019 when renewables generated more of the UK’s electricity than fossil fuels: March, August, September and December. The first ever such month came in September 2018 and more are certain to follow.

National Grid, which manages Great Britain’s high-voltage electricity transmission network, is aiming to be able to run the system without fossil fuels by 2025, at least for short periods. At present, it sometimes has to ask windfarm operators to switch off and gas plants to start running in order to keep the electricity grid stable.

Note that biomass accounted for 11% of UK electricity generation in 2019, nearly a third of the total from all renewables. Some two-thirds of the biomass output is from “plant biomass”, primarily wood pellets burnt at Lynemouth in Northumberland and the Drax plant in Yorkshire. The remainder was from an array of smaller sites based on landfill gas, sewage gas or anaerobic digestion.

The CCC says the UK should “move away” from large-scale biomass power plants, once existing subsidy contracts for Drax and Lynemouth expire in 2027.

Using biomass to generate electricity is not zero-carbon and in some circumstances could lead to higher emissions than from fossil fuels. Moreover, there are more valuable uses for the world’s limited supply of biomass feedstock, the CCC says, including carbon sequestration and hard-to-abate sectors with few alternatives.

Methodology
The figures in the article are from Carbon Brief analysis of data from BEIS Energy Trends chapter 5 and chapter 6, as well as from BM Reports. The figures from BM Reports are for electricity supplied to the grid in Great Britain only and are adjusted to include Northern Ireland.

In Carbon Brief’s analysis, the BM Reports numbers are also adjusted to account for electricity used by power plants on site and for generation by plants not connected to the high-voltage national grid. This includes many onshore windfarms, as well as industrial gas combined heat and power plants and those burning landfill gas, waste or sewage gas.

By design, the Carbon Brief analysis is intended to align as closely as possible to the official government figures on electricity generated in the UK, reported in BEIS Energy Trends table 5.1.

Briefly, the raw data for each fuel is in most cases adjusted with a multiplier, derived from the ratio between the reported BEIS numbers and unadjusted figures for previous quarters.

Carbon Brief’s method of analysis has been verified against published BEIS figures using “hindcasting”. This shows the estimates for total electricity generation from fossil fuels or renewables to have been within ±3% of the BEIS number in each quarter since Q4 2017. (Data before then is not sufficient to carry out the Carbon Brief analysis.)

For example, in the second quarter of 2019, a Carbon Brief hindcast estimates gas generation at 33.1TWh, whereas the published BEIS figure was 34.0TWh. Similarly, it produces an estimate of 27.4TWh for renewables, against a BEIS figure of 27.1TWh.

National Grid recently shared its own analysis for electricity in Great Britain during 2019 via its energy dashboard, which differs from Carbon Brief’s figures.


Related News

View more

Duke solar solicitation nearly 6x over-subscribed

Duke Energy Carolinas Solar RFP draws 3.9 GW of utility-scale bids, oversubscribed in DEP and DEC, below avoided cost rates, minimal battery storage, strict PPA terms, and interconnection challenges across North and South Carolina.


Key Points

Utility-scale solar procurement in DEC and DEP, evaluated against avoided cost, with few storage bids and PPA terms.

✅ 3.9 GW bids for 680 MW; DEP most oversubscribed

✅ Most projects 7-80 MWac; few include battery storage

✅ Bids must price below 20-year avoided cost estimate


Last week the independent administrator for Duke’s 680 MW solar solicitation revealed data about the projects which have bid in response to the offer, showing a massive amount of interest in the opportunity.

Overall, 18 individuals submitted bids for projects in Duke Energy Carolinas (DEC) territory and 10 in Duke Energy Progress (DEP), with a total of more than 3.9 GW of proposals – more nearly 6x the available volume. DEP was relatively more over-subscribed, with 1.2 GWac of projects vying for only 80 MW of available capacity.

This is despite a requirement that such projects come in below the estimate of Duke’s avoided cost for the next 20 years, and amid changes in solar compensation that could affect project economics. Individual projects varied in capacity from 7-80 MWac, with most coming within the upper portion of that range.

These bids will be evaluated in the spring of 2019, and as Duke Energy Renewables continues to expand its portfolio, Duke Energy Communications Manager Randy Wheeless says he expects the plants to come online in a year or two.


Lack of storage

Despite recent trends in affordable batteries, of the 78 bids that came in only four included integrated battery storage. Tyler Norris, Cypress Creek Renewables’ market lead for North Carolina, says that this reflects that the methodology used is not properly valuing storage.

“The lack of storage in these bids is a missed opportunity for the state, and it reflects a poorly designed avoided cost rate structure that improperly values storage resources, commercially unreasonable PPA provisions, and unfavorable interconnection treatment toward independent storage,” Norris told pv magazine.

“We’re hopeful that these issues will be addressed in the second RFP tranche and in the current regulatory proceedings on avoided cost and state interconnection standards and grid upgrades across the region.”


Limited volume for North Carolina?

Another curious feature of the bids is that nearly the same volume of solar has been proposed for South Carolina as North Carolina – despite this solicitation being in response to a North Carolina law and ongoing legal disputes such as a church solar case that challenged the state’s monopoly model.


Related News

View more

Cheap oil contagion is clear and present danger to Canada

Canada Oil Recession Outlook analyzes the Russia-Saudi price war, OPEC discord, COVID-19 demand shock, WTI and WCS collapse, Alberta oilsands exposure, U.S. shale stress, and GDP risks from blockades and fiscal responses.


Key Points

An outlook on how the oil price war and COVID-19 demand shock could tip Canada into recession and strain producers.

✅ WTI and WCS prices plunge on OPEC-Russia discord

✅ Alberta oilsands face break-even pressure near 30 USD WTI

✅ RBC flags global recession; GDP hit from blockades, virus


A war between Russia and Saudi Arabia for market share for oil may have been triggered by the COVID-19 pandemic in China, but the oil price crash contagion that it will spread could have impacts that last longer than the virus.

The prospects for Canada are not good.

Plunging oil prices, reduced economic activity from virus containment, and the fallout from weeks of railway blockades over the Coastal GasLink pipeline all add up to “a one-two-three punch that I think is almost inevitably going to put Canada in a position where its growth has to be negative,” said Dan McTeague, a former Liberal MP and current president of Canadians for Affordable Energy. The situation “certainly has the makings” of a recession, said Ken Peacock, chief economist for the Business Council of British Columbia.

“At a minimum, it’s going to be very disruptive and we’re going to have maybe one negative quarter,” Peacock said. “Whether there’s a second one, where it gets labeled a recession, is a different question. But it’s going to generate some turmoil and challenges over the next two quarters – there’s no doubt about that.”

RBC Economics on March 13 announced it now predicts a global recession and cut its growth projections for Canada's economy in 2020 by half a per cent.

Oil price futures plunged 30% last week, dragging stock markets and currencies, including the Canadian dollar, down with them, even as a deep freeze strained U.S. energy systems. That drop came on top of a 17% decline in February, due to falling demand for oil due to the virus.

The latest price plunge – the worst since the 1991 Gulf War – was the result of Russia and the Organization of Petroleum Exporting Countries (OPEC), led by Saudi Arabia, failing to agree on oil production cuts.

The COVID-19 outbreak in China – the world’s second-largest oil consumer – had resulted in a dramatic drop in oil demand in that country, and a sudden glut of oil, with the U.S. energy crisis affecting electricity, gas and EV markets.

OPEC has historically been able to moderate global oil prices by controlling output. But when Russia refused to co-operate with OPEC and agree to production cuts, Saudi Arabia’s state-owned company, Aramco, announced it plans to boost its oil output from 9.7 million barrels per day (bpd) to 12.3 million bpd in April.

In response to that announcement, West Texas Intermediate (WTI) prices dropped 18% to below US$34 per barrel while the Canadian Crude Index fell 24% to US$21. Western Canadian Select dropped 39% to US$15.73.

The effect on Alberta oilsands producers was severe and immediate. Cenovus Energy Inc. (TSX:CVE) saw roughly $2 billion in market cap erased on March 9, when its stock dropped by 52%, which came on top of a 12% drop March 6.

The company responded the very next day by announcing it would cut spending by 32% in 2020, suspend its oil-by-rail program and defer expansion projects.

MEG Energy Corp. (TSX:MEG), which suffered a 56% share price drop on March 9, also announced a 20% reduction in its 2020 capital spending plan.

Peter Tertzakian, chief economist for ARC Energy Research Institute, wrote last week that Russia’s plan is to try to hurt U.S. shale oil producers, who have more than doubled U.S. oil production over the past decade.

Anas Alhajji, a global oil analyst, expects that plan could work. Even before the oil price shock, he had predicted the great shale boom in the U.S. was coming to an end.

“Shale production will decline, and the myth of ‘explosive growth’ will end,” he told Business in Vancouver. “The impact is global and Canadian producers might suffer even more if the oil that Saudi Arabia sends to the U.S. is medium and heavy. This might last longer than what people think.”

The question for Alberta is how Canadian producers can continue to operate through a period of cheap oil. Alberta producers do not compete on the global market. They serve a niche market of U.S. heavy oil refiners, and Biden-era policy is seen as potentially more favourable for Canada’s energy sector than alternatives.

“On the positive side, the industry is battle-hardened,” Tertzakian wrote. “Over the past five years, innovative companies have already learned to endure some of the lowest prices in the world.”

But he added that they need WTI prices of US$30 per barrel just to break even.

“But that’s an average break-even threshold for an industry with a wide variation in costs. That means at that level about half the companies can’t pay their bills and half are treading water.”

Just prior to the oil price plunge, the International Energy Agency (IEA) updated its 2020 forecast for global oil consumption from an 825,000 bpd increase in oil consumption to a 90,000 bpd decrease, due to the COVID-19 virus and consequent economic contraction and reduction in travel.

The IEA predicts global oil demand won’t return to “normal” until the second half of 2020. But even if demand does return to pre-virus levels, that doesn’t mean oil prices will – not if Saudi Arabia can sustain increased oil production at low prices, and evolving clean grid priorities could influence the trajectory too.

The oil plunge was greeted in Alberta with alarm. Alberta Premier Jason Kenney warned Alberta is in “uncharted territory” as consumers are urged to lock in rates and said his government might have to review its balanced budget and resort to emergency deficit spending.

While British Columbians – who pay some of the highest gasoline prices in North America – will enjoy lower gasoline prices at a time when prices are usually starting a seasonal spike, B.C.’s economy could feel knock-on effects from a recession in Alberta.

“We sell a lot of inputs, do a lot of trade with Alberta, so it’s important for B.C., Alberta’s economic health,” Peacock said, “and recent tensions over electricity purchase talks underscore that.”

Last week, the Trudeau government announced $1 billion in emergency funding to cope with the virus and waived a one-week waiting period for unemployment insurance.


Related News

View more

Sign Up for Electricity Forum’s Newsletter

Stay informed with our FREE Newsletter — get the latest news, breakthrough technologies, and expert insights, delivered straight to your inbox.

Electricity Today T&D Magazine Subscribe for FREE

Stay informed with the latest T&D policies and technologies.
  • Timely insights from industry experts
  • Practical solutions T&D engineers
  • Free access to every issue

Live Online & In-person Group Training

Advantages To Instructor-Led Training – Instructor-Led Course, Customized Training, Multiple Locations, Economical, CEU Credits, Course Discounts.

Request For Quotation

Whether you would prefer Live Online or In-Person instruction, our electrical training courses can be tailored to meet your company's specific requirements and delivered to your employees in one location or at various locations.