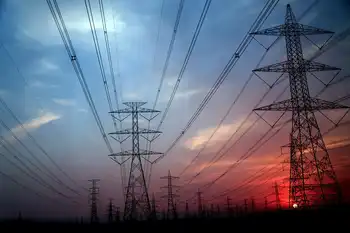
European Energy Crisis shocks markets as Russia slashes gas via Nord Stream, spiking prices and triggering rationing, LNG imports, storage shortfalls, and emergency measures to secure energy security before a harsh winter.
Key Points
Europe-wide gas shock from reduced Russian flows drives price spikes, rationing risk, LNG reliance, and emergency action.
✅ Nord Stream cuts deepen supply insecurity and storage gaps
✅ LNG imports rise but terminal capacity and shipping are tight
✅ Policy tools: rationing, subsidies, demand response, coal restarts
As Russian gas cutoffs upend European energy security, the continent is struggling to cope with what experts say is one of its worst-ever energy crises—and it could still get much worse.
For months, European leaders have been haunted by the prospect of losing Russia’s natural gas supply, which accounts for some 40 percent of European imports and has been a crucial energy lifeline for the continent. That nightmare is now becoming a painful reality as Moscow slashes its flows in retaliation for Europe’s support for Ukraine, dramatically increasing energy prices and forcing many countries to resort to emergency plans, including emergency measures to limit electricity prices in some cases, and as backup energy suppliers such as Norway and North Africa are failing to step up.
“This is the most extreme energy crisis that has ever occurred in Europe,” said Alex Munton, an expert on global gas markets at Rapidan Energy Group, a consultancy. “Europe [is] looking at the very real prospect of not having sufficient gas when it’s most needed, which is during the coldest part of the year.”
“Prices have shot through the roof,” added Munton, who noted that European natural gas prices—nearly $50 per MMBTu—have eclipsed U.S. price rises by nearly tenfold, and that rolling back electricity prices is tougher than it appears in the current market. “That is an extraordinarily high price to be paying for natural gas, and really there is no immediate way out from here.”
Many officials and energy experts worry that the crisis will only deepen after Nord Stream 1, the largest gas pipeline from Russia to Europe, is taken down for scheduled maintenance this week. Although the pipeline is supposed to be under repair for only 10 days, the Kremlin’s history of energy blackmail and weaponization has stoked fears that Moscow won’t turn it back on—leaving heavily reliant European countries in the lurch. (Russia’s second pipeline to Germany, Nord Stream 2, was killed in February as Russian President Vladimir Putin prepared to invade Ukraine, leaving Nord Stream 1 as the biggest direct gas link between Russia and Europe’s biggest economy.)
“Everything is possible. Everything can happen,” German economy minister Robert Habeck told Deutschlandfunk on Saturday. “It could be that the gas flows again, maybe more than before. It can also be the case that nothing comes.”
That would spell trouble for the upcoming winter, when demand for energy surges and having sufficient natural gas is necessary for heating. European countries typically rely on the summer months to refill their gas storage facilities. And at a time of war, when the continent’s future gas supply is uncertain, having that energy cushion is especially crucial.
If Russia’s prolonged disruptions continue, experts warn of a difficult winter: one of potential rationing, industrial shutdowns, and even massive economic dislocation. British officials, who just a few months ago warned of soaring power bills for consumers, are now warning of even worse, despite a brief fall to pre-Ukraine war levels in gas prices earlier in the year.
Europe could face a “winter of discontent,” said Helima Croft, a managing director at RBC Capital Markets. “Rationing, industrial shut-ins—all of that is looming.”
Unrest has already been brewing, with strikes erupting across the continent as households struggle under the pressures of spiraling costs of living and inflationary pressures. Some of this discontent has also had knock-on effects in the energy market. In Norway, the European Union’s biggest supplier of natural gas after Russia, mass strikes in the oil and gas industries last week forced companies to shutter production, sending further shockwaves throughout Europe.
European countries are at risk of descending into “very, very strong conflict and strife because there is no energy,” Frans Timmermans, the vice president of the European Commission, told the Guardian. “Putin is using all the means he has to create strife in our societies, so we have to brace ourselves for a very difficult period.”
The pain of the crisis, however, is perhaps being felt most clearly in Germany, which has been forced to turn to a number of energy-saving measures, including rationing heated water and closing swimming pools. To cope with the crunch, Berlin has already entered the second phase of its three-stage emergency gas plan; last week, it also moved to bail out its energy giants amid German utility troubles that have been financially slammed by Russian cutoffs.
But it’s not just Germany. “This is happening all across Europe,” said Olga Khakova, an expert on European energy security at the Atlantic Council, who noted that France has also announced plans to nationalize the EDF power company as it buckles under mounting economic losses, and the EU outlines gas price cap strategies to temper volatility. “The challenging part is how much can these governments provide in support to their energy consumers, to these companies? And what is that breaking point?”
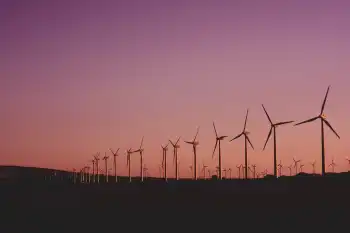
The situation has also complicated many countries’ climate goals, even as some call it a wake-up call to ditch fossil fuels for Europe. In late June, Germany, Italy, Austria, and the Netherlands announced they would restart old coal power plants as they grapple with shrinking supplies.
The potential outcomes that European nations are grappling with reveal how this crisis is occurring on a scale that has only been seen in times of war, Munton said. In the worst-case scenario, “we’re talking about rationing gas supplies, and this is not something that Europe has had to contend with in any other time than the wartime,” he said. “That’s essentially where things have got to now. This is an energy war.”
They also underscore the long and painful battle that Europe will continue to face in weaning itself off Russian gas. Despite the continent’s eagerness to leave Moscow’s supply behind, experts say Europe will likely remain trapped in this spiraling crisis until it can develop the infrastructure for greater energy independence—and that could take years. U.S. gas, shipped by tanker, is one option, but that requires new terminals to receive the gas and U.S. energy impacts remain a factor for policymakers. New pipelines take even longer to build—and there isn’t a surfeit of eligible suppliers.
Until then, European leaders will continue to scramble to secure enough supplies—and can only hope for mild weather. The “worst-case scenario is people having to choose between eating and heating come winter,” Croft said.
Related News