Radioactive byproduct in groundwater at nuke plant

By Knight Ridder Tribune


Substation Relay Protection Training

Our customized live online or in‑person group training can be delivered to your staff at your location.

  • Live Online
  • 12 hours Instructor-led
  • Group Training Available
Regular Price:
$699
Coupon Price:
$599
Reserve Your Seat Today
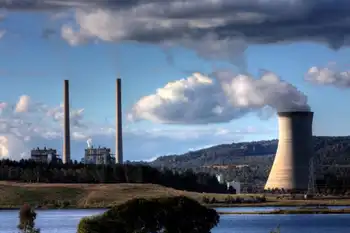
Radioactive tritium has leaked into groundwater from the Catawba nuclear power plant on Lake Wylie, Duke Energy told federal regulators.

Tritium occurs naturally and as a byproduct of nuclear plants. It emits a weak form of radiation, but people exposed to it may face increased risks of cancer or pass on genetic abnormalities.

One well at the Catawba plant had a tritium concentration twice as high as the federal government says is safe in drinking water. Duke says the contamination poses no threat to the public because it is confined within the plant's boundaries.

The S.C. Department of Health and Environmental Control will sample water from about two dozen residential wells near the plant, spokesman Thom Berry said.

At least six other nuclear plants, none in the Carolinas, have reported tritium leaks in recent years. The Nuclear Regulatory Commission says the leaks posed no threats to public health, but revised inspection procedures to ferret out potential leaks.

Nuclear reactors produce tritium from the use of a chemical, boron, to help control the chain reaction that produces heat. Boron is also added to the water in which fuel cools after it has been used in a reactor.

Under an industry initiative, Duke spokesman Valerie Patterson said, Catawba installed 30 new wells to monitor groundwater at the plant.

One of those wells - not used for drinking water purposes - detected the concentration Duke reported.

"We have no reason to believe, based on other testing of other wells, that they have elevated levels," Patterson said.

Duke's McGuire nuclear plant on Lake Norman has installed 41 wells and will add nine. It was unclear whether reportable levels of tritium had been detected there.

The Oconee plant in northwestern South Carolina will install 28 wells later this year, Patterson said. Duke said it's investigating the source of the leak. Other nuclear plants have traced leaks to spent fuel pools and to valves.

Related News

Ontario Ministry of Energy proposes growing hydrogen economy through reduced electricity rates

Ontario Hydrogen Strategy accelerates green hydrogen via electrolysis, reduced electricity rates, and IESO pilots, leveraging ICI, interruptible rates, and surplus power to grow clean tech, low-carbon energy, and export markets across Ontario.


Key Points

A provincial plan to scale green hydrogen with electricity costs, IESO pilots, and surplus power to boost tech.

✅ Amends ICI to admit hydrogen producers from 50 kW demand

✅ Enables co-located electrolysers to use surplus curtailed power

✅ Offers interruptible rates via IESO pilot for flexible loads


The Ontario Ministry of Energy is seeking input on accelerating Ontario’s hydrogen economy. The province has been promoting growth in the clean tech sector, including low-carbon energy production and the Hydrogen Innovation Fund, as an avenue for post-COVID-19 economic recovery. Hydrogen produced through electrolysis (or “green hydrogen”) has been central to these efforts, complimenting both federal and provincial initiatives to create vibrant domestic and export markets for the energy as a principal alternative to conventional fossil fuels.

On April 14, 2022, the Ministry filed a proposal (the Proposal) on the Environmental Registry of Ontario (ERO) to gather input from stakeholders, aligning with the province’s industrial electricity pricing consultation underway. As part of Ontario’s Hydrogen Strategy, the Ministry is considering several options that would provide reduced electricity rates for green hydrogen producers to make production more economically competitive with other energies. To date, the relatively high production cost of green hydrogen has been a challenge facing its adoption, both domestically and internationally.

The Proposal features three options:

  • Amending the rules for the Industrial Conservation Initiative (ICI) applicable to hydrogen producers;
  • Enabling onsite hydrogen production using electricity that would otherwise be curtailed; and
  • Providing an interruptible electricity rate for hydrogen producers.

Option 1: Amending the ICI rules

Option 1 would amend the ICI rules to allow all hydrogen producers with an average monthly peak demand of 50kW to participate. Hydrogen producers’ facilities could qualify for ICI in the first year of operation with a peak demand factor determined based on a deemed consumption profile, using a method yet to be determined by the Ministry. At the end of the first year, their global adjustment (GA) charges would be reconciled based on their actual consumption pattern. As set out in our prior article, GA was introduced by the province in January 2005 to ensure reliable, sustainable and a diverse supply of power at stable and competitive prices, aligning with plans to rely on battery storage to meet rising energy demand. The Ministry’s current proposal would require hydrogen producers to place a security deposit for their facilities’ first year of operation with the Independent Electricity System Operator (IESO) or their Local Distribution Company (LDC) to ensure other consumer would not be adversely affected.

Option 2: Enable onsite hydrogen production using surplus electricity

Option 2 would allow businesses to co-locate hydrogen electrolysers at electricity generation facilities, drawing on recent electrolyzer investment trends, to make use of what would become curtailed generation. Under this option in the Proposal, the developer for the hydrogen production facility would be required to be a separate legal entity from the one that owns or operates the electricity generation facility. Based on this required level of independence, the hydrogen developer would be required to pay the electricity generator for the electricity supply.

At this stage, it is not clear whether, or how the generator would be required to share the revenue with other consumers. The next steps of the Proposal may require regulatory amendments, and/or amendments to electricity generator’s contracts, consistent with efforts enabling storage in Ontario's electricity system to integrate flexible resources.

Option 3: Interruptible electricity rates for hydrogen producers

In 2021, the Ministry posted a proposal on the ERO including an Interruptible Rate Pilot that was to be developed in conjunction with the IESO in order to address stakeholder feedback received during the 2019 Industrial Consultation specific to the challenges of identifying and responding to peak demand events while participating in the ICI. The pilot was targeted towards large electricity consumers, where participants were charged GA at a reduced rate in exchange for agreeing to reduce consumption during system or local reliability events, as identified by IESO.

Option 3 would allow for the introduction for a dedicated stream for hydrogen producers into the interruptible rate pilot, which is currently under development with the IESO. This would take into account the unique circumstances of hydrogen producers, as well as the importance of the hydrogen sector in Ontario’s Low-Carbon Hydrogen Strategy. Under the pilot, participants would be given advance notice by the IESO to reduce demand over a fixed number of hours, several times each year, and emerging vehicle-to-grid models where EV owners can sell electricity back to the grid highlight additional flexibility options. Ultimately, the pilot would support low-carbon hydrogen production by offering large electricity consumers, such as hydrogen producers, reduced electricity rates in exchange for reduces consumption during system or local reliability events.

Following this initial development work, the Ministry intends to consult with stakeholders later this year to determine design details, as well as the timing for the potential roll out of the proposed pilot.

Key takeaways

The design options are not meant to be mutually exclusive, and might be pursued by the Ministry in combination. Ultimately, Ontario is focusing on ways to reduce electricity rates in an attempt to make the province a leader in the adoption of green hydrogen, as made clear in the Ontario Hydrogen Strategy, even as an electricity supply crunch looms, underscoring the urgency. Stakeholders will want to participate in this process given its long-term implications for both the hydrogen and power sectors.


Related News

View more

Pennsylvania Home to the First 100% Solar, Marriott-Branded U.S. Hotel

Courtyard by Marriott Lancaster Solar Array delivers 100% renewable electricity via photovoltaic panels at Greenfield Corporate Center, Pennsylvania, a High Hotels and Marriott sustainability initiative reducing grid demand and selling excess power for efficient operations.


Key Points

A $1.5M PV installation powering the 133-room hotel with 100% renewable electricity in Greenfield Center, Lancaster.

✅ 2,700 PV panels generate 1,239,000 kWh annually

✅ First Marriott in the US with 100% solar electricity

✅ $504,900 CFA grant; excess power sold to the utility


High Hotels Ltd., a hotel developer and operator, recently announced it is installing a $1.5 million solar array that will generate 100% of the electrical power required to operate one of its existing hotels in Greenfield Corporate Center. The completed installation will make the 133-room Courtyard by Marriott-Lancaster the first Marriott-branded hotel in the United States with 100% of its electricity needs generated from solar power. It is also believed to be the first solar array in the country installed for the sole purpose of generating 100% of the electricity needs of a hotel, mirroring how other firms are commissioning their first solar power plant to meet sustainability goals.

“This is an exciting approach to addressing our energy needs that aligns very well with High’s commitment to environmental stewardship,”

“We’ve been advancing many environmentally responsible practices across our hotel portfolio, including converting the interior and exterior lighting at the Lancaster Courtyard to LED, which will lower electricity demand by 15%,” said Russ Urban, president of High Hotels. “Installing solar is another important step in this progression, and we will look to apply lessons from this as we expand our portfolio of premium select-service hotels.”

The Lancaster-based hotel developer, owner and operator is working in partnership with Marriott International Inc. to realize this vision, in step with major brands announcing new clean energy projects across their portfolios.

The installation of more than 2,700 ballasted photovoltaic panels will fill an area more than two football fields in size. After evaluating several on-site and near-site alternatives, High Hotels decided to install the solar array on the roof of a nearby building in Greenfield Corporate Center. Using the existing roof saves more than three acres of open land and has additional aesthetic benefits, aligning with recommendations for solar farms under consideration by local planners. The solar array will produce 1,239,000 kWh of power for the hotel, which consumes 1,177,000 kWh. Any excess power will be sold to the utility, though affordable solar batteries are making on-site storage increasingly feasible.

High Hotels received a grant of $504,900 from the Commonwealth Financing Authority (CFA) through the Solar Energy Program to complete the project. An independent agency of the Department of Community and Economic Development (DCED), the CFA is responsible for evaluating projects and awarding funds for a variety of economic development programs, including the Solar Energy Program and statewide initiatives like solar-power subscriptions that broaden access. The project will receive a solar renewable energy credit which will be conveyed to the CFA to provide the agency with more funds to offer grants in the future.

“This is a cutting-edge project that is exactly the kind we are looking for to promote the generation and use of solar energy,” said DCED Secretary Dennis Davin. “I am very pleased that the first Marriott in the US to receive 100% of its electric needs through renewable solar energy is located right here in Central Pennsylvania.” Secretary Davin also serves as chairman of the CFA’s board.

Panels for the solar array will be Q Cells manufactured by Hanwha Cells Co., Ltd., headquartered in Seoul, South Korea. Ephrata, Pa.-based Meadow Valley Electric Inc. will install the array in the second and third quarters of 2018 with commissioning targeted for September 2018.


Related News

View more

Next Offshore Wind in U.S. Can Compete With Gas, Developer Says

Offshore Wind Cost Competitiveness is rising as larger turbines boost megawatt output, cut LCOE, and trim maintenance and installation time, enabling projects in New England to rival natural gas pricing while scaling reliably.


Key Points

It describes how larger offshore turbines lower LCOE and O&M, making U.S. projects price competitive with natural gas.

✅ Larger turbines boost MW output and reduce LCOE.

✅ Lower O&M and faster installation cut lifecycle costs.

✅ Competes with gas in New England bids, per BNEF.


Massive offshore wind turbines keep getting bigger, as projects like the biggest UK offshore wind farm come online, and that’s helping make the power cheaper — to the point where developers say new projects in U.S. waters can compete with natural gas.

The price “is going to be a real eye-opener,” said Bryan Martin, chairman of Deepwater Wind LLC, which won an auction in May to build a 400-megawatt wind farm southeast of Rhode Island.

Deepwater built the only U.S. offshore wind farm, a 30-megawatt project that was completed south of Block Island in 2016. The company’s bid was selected by Rhode Island the same day that Massachusetts picked Vineyard Wind to build an 800-megawatt wind farm in the same area, while international investors such as Japanese utilities in UK projects signal growing confidence.

#google#

Bigger turbines that make more electricity have cut the cost per megawatt by about half, a trend aided by higher-than-expected wind potential in many markets, said Tom Harries, a wind analyst at Bloomberg New Energy Finance. That also reduces maintenance expenses and installation time. All of this is helping offshore wind vie with conventional power plants.

“You could not build a thermal gas plant in New England for the price of the wind bids in Massachusetts and Rhode Island,” Martin said Friday at the U.S. Offshore Wind Conference in Boston. “It’s very cost-effective for consumers.”

The Massachusetts project could be about $100 to $120 a megawatt hour, according to a February estimate from Harries, though recent UK price spikes during low wind highlight volatility. The actual prices there and in Rhode Island weren’t disclosed.

For comparison, a new U.S. combine-cycle gas turbine ranges from $40 to $60 a megawatt-hour, and a new coal plant is $67 to $113, according to BNEF data.


A new power plant in land-constrained New England would probably be higher than that, and during winter peaks the region has seen record oil-fired generation in New England that underscores reliability concerns. More importantly, gas plants get a significant portion of their revenue from being able to guarantee that power is always available, something wind farms can’t do, said William Nelson, a New York-based analyst with BNEF. Looking only at the price at which offshore turbines can deliver electricity is a “narrow mindset,” he said.


Related News

View more

Potent greenhouse gas declines in the US, confirming success of control efforts

US SF6 Emissions Decline as NOAA analysis and EPA mitigation show progress, with atmospheric measurements and Greenhouse Gas Reporting verifying reductions from the electric power grid; sulfur hexafluoride's extreme global warming potential underscores inventory improvements.


Key Points

A documented drop in US sulfur hexafluoride emissions, confirmed by NOAA atmospheric data and EPA reporting reforms.

✅ NOAA towers and aircraft show 2007-2018 decline

✅ EPA reporting and utility mitigation narrowed inventory gaps

✅ Winter leaks and servicing signal further reduction options


A new NOAA analysis shows U.S. emissions of the super-potent greenhouse gas sulfur hexafluoride (SF6) have declined between 2007-2018, likely due to successful mitigation efforts by the Environmental Protection Agency (EPA) and the electric power industry, with attention to SF6 in the power industry across global markets. 

At the same time, significant disparities that existed previously between NOAA’s estimates, which are based on atmospheric measurements, and EPA’s estimates, which are based on a combination of reported emissions and industrial activity, have narrowed following the establishment of the EPA's Greenhouse Gas Reporting Program. The findings, published in the journal Atmospheric Chemistry and Physics, also suggest how additional emissions reductions might be achieved. 

SF6 is most commonly used as an electrical insulator in high-voltage equipment that transmits and distributes electricity, and its emissions have been increasing worldwide as electric power systems expand, even as regions hit milestones like California clean energy surpluses in recent years. Smaller amounts of SF6 are used in semiconductor manufacturing and in magnesium production. 

SF6 traps 25,000 times more heat than carbon dioxide over a 100-year time scale for equal amounts of emissions, and while CO2 emissions flatlined in 2019 globally, that comparison underscores the potency of SF6. That means a relatively small amount of the gas can have a significant impact on climate warming. Because of its extremely large global warming potential and long atmospheric lifetime, SF6 emissions will influence Earth’s climate for thousands of years.

In this study, researchers from NOAA’s Global Monitoring Laboratory, as record greenhouse gas concentrations drive demand for better data, working with colleagues at EPA, CIRES, and the University of Maryland, estimated U.S. SF6 emissions for the first time from atmospheric measurements collected at a network of tall towers and aircraft in NOAA’s Global Greenhouse Gas Reference Network. The researchers provided an estimate of SF6 emissions independent from the EPA’s estimate, which is based on reported SF6 emissions for some industrial facilities and on estimated SF6 emissions for others.

“We observed differences between our atmospheric estimates and the EPA’s activity-based estimates,” said study lead author Lei Hu, a Global Monitoring Laboratory researcher who was a CIRES scientist at the time of the study. “But by closely collaborating with the EPA, we were able to identify processes potentially responsible for a significant portion of this difference, highlighting ways to improve emission inventories and suggesting additional emission mitigation opportunities, such as forthcoming EPA carbon capture rules for power plants, in the future.” 

In the 1990s, the EPA launched voluntary partnerships with the electric power, where power-sector carbon emissions are falling as generation shifts, magnesium, and semiconductor industries to reduce SF6 emissions after the United States recognized that its emissions were significant. In 2011, large SF6 -emitting facilities were required to begin tracking and reporting their emissions under the EPA Greenhouse Gas Reporting Program. 

Hu and her colleagues documented a decline of about 60 percent in U.S. SF6 emissions between 2007-2018, amid global declines in coal-fired power in some years—equivalent to a reduction of between 6 and 20 million metric tons of CO2 emissions during that time period—likely due in part to the voluntary emission reduction partnerships and the EPA reporting requirement. A more modest declining trend has also been reported in the EPA’s national inventories submitted annually under the United Nations Framework Convention on Climate Change. 

Examining the differences between the NOAA and EPA independent estimates, the researchers found that the EPA’s past inventory analyses likely underestimated SF6 emissions from electrical power transmission and distribution facilities, and from a single SF6 production plant in Illinois. According to Hu, the research collaboration has likely improved the accuracy of the EPA inventories. The 2023 draft of the EPA’s U.S. Greenhouse Gas Emissions and Sinks: 1990-2021 used the results of this study to support revisions to its estimates of SF6 emissions from electrical transmission and distribution. 

The collaboration may also lead to improvements in the atmosphere-based estimates, helping NOAA identify how to expand or rework its network to better capture emitting industries or areas with significant emissions, according to Steve Montzka, senior scientist at GML and one of the paper’s authors.

Hu and her colleagues also found a seasonal variation in SF6 emissions from the atmosphere-based analysis, with higher emissions in winter than in summer. Industry representatives identified increased servicing of electrical power equipment in the southern states and leakage from aging brittle sealing materials in the equipment in northern states during winter as likely explanations for the enhanced wintertime emissions—findings that suggest opportunities for further emissions reductions.

“This is a great example of the future of greenhouse gas emission tracking, where inventory compilers and atmospheric scientists work together to better understand emissions and shed light on ways to further reduce them,” said Montzka.


Related News

View more

EIA: Pennsylvania exports the most electricity, California imports the most from other states

U.S. Electricity Trade by State, 2013-2017 highlights EIA grid patterns, interstate imports and exports, cross-border flows with Canada and Mexico, net exporters and importers, and market regions like ISOs and RTOs shaping consumption and generation.


Key Points

Brief EIA overview of interstate and cross-border power flows, ranking top net importers and exporters.

✅ Pennsylvania was the largest net exporter, averaging 59 million MWh.

✅ California was the largest net importer, averaging 77 million MWh.

✅ Top cross-border: NY, CA, VT, MN, MI imports; WA, TX, CA, NY, MT exports.


According to the U.S. Energy Information Administration (EIA) State Electricity Profiles, from 2013 to 2017, Pennsylvania was the largest net exporter of electricity, while California was the largest net importer.

Pennsylvania exported an annual average of 59 million megawatt-hours (MWh), while California imported an average of 77 million MWh annually.

Based on the share of total consumption in each state, the District of Columbia, Maryland, Massachusetts, Idaho and Delaware were the five largest power-importing states between 2013 and 2017, highlighting how some clean states import 'dirty' electricity as consumption outpaces local generation. Wyoming, West Virginia, North Dakota, Montana and New Hampshire were the five largest power-exporting states. Wyoming and West Virginia were net power exporting states between 2013 and 2017.

New York, California, Vermont, Minnesota and Michigan imported the most electricity from Canada or Mexico on average from 2013 to 2017, reflecting the U.S. look to Canada for green power during that period. Similarly, Washington, Texas, California, New York, and Montana exported the most electricity to Canada or Mexico, on average, during the same period.

Electricity routinely flows among the Lower 48 states and, to a lesser extent, between the United States and Canada and Mexico. From 2013 to 2017, Pennsylvania was the largest net exporter of electricity, sending an annual average of 59 million megawatthours (MWh) outside the state. California was the largest net importer, receiving an average of 77 million MWh annually.

Based on the share of total consumption within each state, the District of Columbia, Maryland, Massachusetts, Idaho, and Delaware were the five largest power-importing states between 2013 and 2017. Wyoming, West Virginia, North Dakota, Montana, and New Hampshire were the five largest power-exporting states. States with major population centers and relatively less generating capacity within their state boundaries tend to have higher ratios of net electricity imports to total electricity consumption, as utilities devote more to electricity delivery than to power production in many markets.

Wyoming and West Virginia were net power exporting states (they exported more power to other states than they consumed) between 2013 and 2017. Customers residing in these two states are not necessarily at an economic disadvantage or advantage compared with customers in neighboring states when considering their electricity bills and fees and market dynamics. However, large amounts of power trading may affect a state’s revenue derived from power generation.

Some states also import and export electricity outside the United States to Canada or Mexico, even as Canada's electricity exports face trade tensions today. New York, California, Vermont, Minnesota, and Michigan are the five states that imported the most electricity from Canada or Mexico on average from 2013 through 2017. Similarly, Washington, Texas (where electricity production and consumption lead the nation), California, New York, and Montana are the five states that exported the most electricity to Canada or Mexico, on average, for the same period.

Many states within the continental United States fall within integrated market regions, referred to as independent system operators or regional transmission organizations. These integrated market regions allow electricity to flow freely between states or parts of states within their boundaries.

EIA’s State Electricity Profiles provide details about the supply and disposition of electricity for each state, including net trade with other states and international imports and exports, and help you understand where your electricity comes from more clearly.


Related News

View more

South Australia rides renewables boom to become electricity exporter

Australia electricity grid transition is accelerating as renewables, wind, solar, and storage drive decentralised generation, emissions cuts, and NEM trade shifts, with South Australia becoming a net exporter post-Hazelwood closure and rooftop solar surging.


Key Points

Australia electricity shift to renewables, distributed generation and storage, cutting emissions, reshaping NEM flows.

✅ South Australia now exports power post-Hazelwood closure

✅ Rooftop solar is the fastest-growing NEM generation source

✅ Gas peaking and storage investments balance variable renewables


The politics may not change much, but Australia’s electricity grid is changing before our very eyes – slowly and inevitably becoming more renewable, more decentralised, and in step with Australia's energy transition that is challenging the pre-conceptions of many in the industry.

The latest national emissions audit from The Australia Institute, which includes an update on key electricity trends in the national electricity market, notes some interesting developments over the last three months.

The most surprising of those developments may be the South Australia achievement, which shows that since the closure of the Hazelwood brown coal generator in Victoria in March 2017, and as renewables outpacing brown coal in other markets, South Australia has become a net exporter of electricity, in net annualised terms.

Hugh Saddler, lead author of the study, notes that this is a big change for South Australia, which in 1999 and 2000, when it had only gas and local coal, used to import 30% of its electricity demand.

#google#

The fact that wholesale prices in South Australia were higher in other states – then, as they are now – has nothing to with wind and solar, but the fact that it has no low-cost conventional source and a peaky demand profile (then and now).

“The difference today is that the state is now taking advantage of its abundant resources of wind and solar radiation, and the new technologies which have made them the lowest cost sources of new generation, to supply much of its electricity requirements,” Saddler writes.

Other things to note about the flows between states is that Victoria was about equal on imports and exports with its three neighbouring states, despite the closure of Hazelwood. NSW continues to import around 10% of its needs from cheaper providers in Queensland.

Gas-fired generation had increased in the last year or two in South Australia as a result of the Northern closure, but is still below the levels of a decade ago.

But because it is expensive, this is likely to spur more investment in storage.

As for rooftop solar, Saddler notes that the share of residential solar in the grid is still relatively small but, despite excess solar risks flagged by distributors, it is the most steadily growing generation source in the NEM.

That line is expected to grow steadily. By 2040, or perhaps 2050, the share of distributed generation, which includes rooftop solar, battery storage and demand management, is expected to reach nearly half of all Australia’s grid demand.

Saddler, says, however, that the increase in large-scale solar over the last few months is a significant milestone in Australia’s transition towards clean electricity generation, mirroring trends in India's on-grid solar development seen in recent years. (See very top graph).

“Firstly, they are a concrete demonstration that the construction cost advantage, which wind enjoyed over solar until a year or two ago, is gone.

“From now on we can expect new capacity to be a mix of both technologies. Indeed, the Clean Energy Regulator states that it expects solar to account for half of all (new renewable) capacity by 2020, and the US is moving toward 30% from wind and solar as well.”


Related News

View more

Sign Up for Electricity Forum’s Newsletter

Stay informed with our FREE Newsletter — get the latest news, breakthrough technologies, and expert insights, delivered straight to your inbox.

Electricity Today T&D Magazine Subscribe for FREE

Stay informed with the latest T&D policies and technologies.
  • Timely insights from industry experts
  • Practical solutions T&D engineers
  • Free access to every issue

Download the 2025 Electrical Training Catalog

Explore 50+ live, expert-led electrical training courses –

  • Interactive
  • Flexible
  • CEU-cerified