Germany 2025 Energy Costs forecast electricity and heating price trends amid gas volatility, renewables expansion, grid upgrades, and policy subsidies, highlighting impacts on households, industries, efficiency measures, and the Energiewende transition dynamics.
Key Points
Electricity stabilizes, gas-driven heating stays high; renewables, subsidies, and efficiency measures moderate costs.
✅ Power prices stabilize above pre-crisis levels
✅ Gas volatility keeps heating bills elevated
✅ Subsidies and efficiency upgrades offset some costs
As Germany moves into 2025, the country is facing significant shifts in heating and electricity costs. With a variety of factors influencing energy prices, including geopolitical tensions, government policies, and the ongoing transition to renewable energy sources, consumers and businesses alike are bracing for potential changes in their energy bills. In this article, we will explore how heating and electricity costs are expected to evolve in Germany in the coming year and what that means for households and industries.
Energy Price Trends in Germany
In recent years, energy prices in Germany have experienced notable fluctuations, particularly due to the aftermath of the global energy crisis, which was exacerbated by the Russian invasion of Ukraine. This geopolitical shift disrupted gas supplies, which in turn affected electricity prices and strained local utilities across the country. Although the German government introduced measures to mitigate some of the price increases, many households have still felt the strain of higher energy costs.
For 2024, experts predict that electricity prices will likely stabilize but remain higher than pre-crisis levels. While electricity prices nearly doubled in 2022, they have gradually started to decline, and the market has adjusted to the new realities of energy supply and demand. Despite this, the cost of electricity is expected to stay elevated as Germany continues to phase out coal and nuclear energy while ramping up the use of renewable sources, which often require significant infrastructure investments.
Heating Costs: A Mixed Outlook
Heating costs in Germany are heavily influenced by natural gas prices, which have been volatile since the onset of the energy crisis. Gas prices, although lower than the peak levels seen in 2022, are still considerably higher than in the years before. This means that households relying on gas heating can expect to pay more for warmth in 2024 compared to previous years.
The government has implemented measures to cushion the impact of these increased costs, such as subsidies for vulnerable households and efforts to support energy efficiency upgrades. Despite these efforts, consumers will still feel the pinch, particularly in homes that use older, less efficient heating systems. The transition to more sustainable heating solutions, such as heat pumps, remains a key goal for the German government. However, the upfront cost of such systems can be a barrier for many households.
The Role of Renewable Energy and the Green Transition
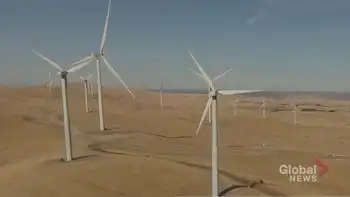
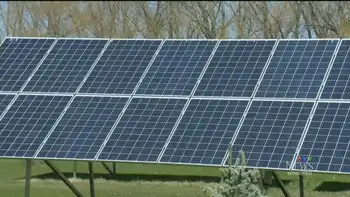
Germany has set ambitious goals for its energy transition, known as the "Energiewende," which aims to reduce reliance on fossil fuels and increase the share of renewable energy sources in the national grid. In 2024, Germany is expected to see further increases in renewable energy generation, particularly from wind and solar power. While this transition is essential for reducing carbon emissions and improving long-term energy security, the shift comes with its own challenges already documented in EU electricity market trends reports.
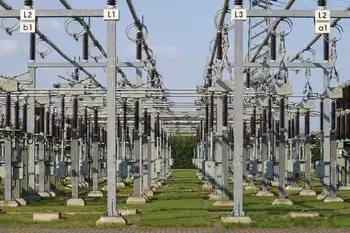
One of the main factors influencing electricity costs in the short term is the intermittency of renewable energy sources. Wind and solar power are not always available when demand peaks, requiring backup power generation from fossil fuels or stored energy. Additionally, the infrastructure needed to accommodate a higher share of renewables, including grid upgrades and energy storage solutions, is costly and will likely contribute to rising electricity prices in the near term.
On a positive note, Germany's growing investment in renewable energy is expected to make the country less reliant on imported fossil fuels, particularly natural gas, which has been a major source of price volatility. Over time, as the share of renewables in the energy mix grows, the energy system should become more stable and less susceptible to geopolitical shocks, which could lead to more predictable and potentially lower energy costs in the long run.
Government Interventions and Subsidies
To help ease the burden on consumers, the German government has continued to implement various measures to support households and businesses. One of the key programs is the reduction in VAT (Value Added Tax) on electricity, which has been extended in some regions. This measure is designed to make electricity more affordable for all households, particularly those on fixed incomes facing EU energy inflation pressures that have hit the poorest hardest.
Moreover, the government has been providing financial incentives for households and businesses to invest in energy-efficient technologies, such as insulation and energy-saving heating systems, complementing the earlier 200 billion euro energy shield announced to buffer surging prices. These incentives are intended to reduce overall energy consumption, which could offset some of the rising costs.
The outlook for heating and electricity costs in Germany for 2024 is mixed, even as energy demand hit a historic low amid economic stagnation. While some relief from the extreme price spikes of 2022 may be felt, energy costs will still be higher than they were in previous years. Households relying on gas heating will likely see continued elevated costs, although those who invest in energy-efficient solutions or renewable heating technologies may be able to offset some of the increases. Similarly, electricity prices are expected to stabilize but remain high due to the country’s ongoing transition to renewable energy sources.
While the green transition is crucial for long-term sustainability, consumers must be prepared for potentially higher energy costs in the short term. Government subsidies and incentives will help alleviate some of the financial pressure, but households should consider strategies to reduce energy consumption, such as investing in more efficient heating systems or adopting renewable energy solutions like solar panels.
As Germany navigates these changes, the country’s energy future will undoubtedly be shaped by a delicate balance between environmental goals and the economic realities of transitioning to a greener energy system.
Related News