GermanyÂ’s renewable myth

By Financial Post


High Voltage Maintenance Training Online

Our customized live online or in‑person group training can be delivered to your staff at your location.

  • Live Online
  • 12 hours Instructor-led
  • Group Training Available
Regular Price:
$599
Coupon Price:
$499
Reserve Your Seat Today
An aggressive policy of generously subsidizing and effectively mandating “renewable” electricity generation in Germany has led to a doubling of the renewable contribution to electricity generation in recent years.

This preference came primarily in the form of a subsidy policy based on feed-in tariffs, established in 1991 by the Electricity Feed-in Law, requiring utilities to accept and remunerate the feed-in of “green” electricity at 90 percent of the retail rate of electricity, considerably exceeding the cost of conventional electricity generation.

A subsequent law passed in 2000 guaranteed continued support for 20 years. This requires utilities to accept the delivery of power from independent producers of renewable electricity into their own grid, paying technology-specific feed-in tariffs far above their production cost of ¢2.9-10.2 per kilowatt hour (kWh).

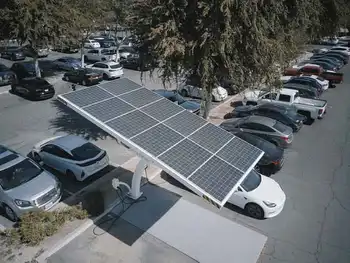
With a feed-in tariff of ¢59 per kWh in 2009, solar electricity generated from photovoltaics (PV) is guaranteed by far the largest financial support among all renewable energy technologies.

Currently, the feed-in tariff for PV is more than eight times higher than the wholesale electricity price at the power exchange and more than four times the feed-in tariff paid for electricity produced by on-shore wind turbines.

Even on-shore wind, widely regarded as a mature technology, requires feed-in tariffs that exceed the per-kWh cost of conventional electricity by up to 300% to remain competitive.

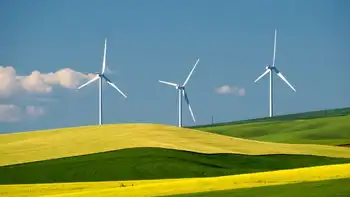
By 2008 this had led to Germany having the second-largest installed wind capacity in the world, behind the United States, and largest installed PV capacity in the world, ahead of Spain. This explains the claims that GermanyÂ’s feed-in tariff is a great success.

Installed capacity is not the same as production or contribution, however, and by 2008 the estimated share of wind power in GermanyÂ’s electricity production was 6.3%, followed by biomass-based electricity generation (3.6%) and water power (3.1%). The amount of electricity produced through solar photovoltaics was a negligible 0.6% despite being the most subsidized renewable energy, with a net cost of about $12.4 billion for 2008.

The total net cost of subsidizing electricity production by PV modules is estimated to reach $73.2 billion for those modules installed between 2000 and 2010. While the promotion rules for wind power are more subtle than those for PV, we estimate that the wind power subsidies may total US $28.1 billion for wind converters installed between 2000 and 2010.

Consumers ultimately bear the cost of renewable energy promotion. In 2008, the price mark-up due to the subsidization of green electricity was about ¢2.2, meaning the subsidy accounts for about 7.5% of average household electricity prices.

Given the net cost of ¢41.82/kWh for PV modules installed in 2008, and assuming that PV displaces conventional electricity generated from a mixture of gas and hard coal, abatement costs are as high as $1,050 per ton.

Using the same assumptions and a net cost for wind of ¢3.10/kWh, the abatement cost is approximately $80. While cheaper than PV, this cost is still nearly double the ceiling of the cost of a per-ton permit under Europe’s cap-and-trade scheme. Renewable energies are thus among the most expensive GHG reduction measures.

There are much cheaper ways to reduce carbon dioxide emissions than subsidizing renewable energies. CO2 abatement costs of PV are estimated to be as high as $1,050 per ton, while those of wind power are estimated at $80 per ton. By contrast, the current price of emissions certificates on the European emissions trading scheme is only 13.4 (Euro) per ton. Hence, the cost from emission reductions as determined by the market is about 53 times cheaper than employing PV and 4 times cheaper than using wind power.

Moreover, the prevailing coexistence of the EEG and emissions trading under the European Trading Scheme (ETS) means that the increased use of renewable energy technologies generally attains no additional emission reductions beyond those achieved by ETS alone. In fact, since the establishment of the ETS in 2005, the EEGÂ’s net climate effect has been equal to zero.

While employment projections in the renewable sector convey seemingly impressive prospects for gross job growth, they typically obscure the broader implications for economic welfare by omitting any accounting of offsetting impacts. These impacts include, but are not limited to, job losses from crowding out of cheaper forms of conventional energy generation, indirect impacts on upstream industries, additional job losses from the drain on economic activity precipitated by higher electricity prices, private consumersÂ’ overall loss of purchasing power due to higher electricity prices, and diverting funds from other, possibly more beneficial investment.

Proponents of renewable energies often regard the requirement for more workers to produce a given amount of energy as a benefit, failing to recognize that this lowers the output potential of the economy and is hence counterproductive to net job creation. Significant research shows that initial employment benefits from renewable policies soon turn negative as additional costs are incurred. Trade-and other assumptions in those studies claiming positive employment turn out to be unsupportable.

In the end, GermanyÂ’s PV promotion has become a subsidization regime that, on a per-worker basis, has reached a level that far exceeds average wages, with per-worker subsidies as high as $240,000.

It is most likely that whatever jobs are created by renewable energy promotion would vanish as soon as government support is terminated, leaving only GermanyÂ’s export sector to benefit from the possible continuation of renewables support in other countries such as the United States.

Due to their backup energy requirements, it turns out that any increased energy security possibly afforded by installing large PV and wind capacity is undermined by reliance on fuel sources — principally gas — that must be imported to meet domestic demand. That much of this gas is imported from unreliable suppliers calls energy security claims further into question.

Claims about technological innovation benefits of GermanyÂ’s first-actor status are unsupportable. In fact, the regime appears to be counterproductive in that respect, stifling innovation by encouraging producers to lock into existing technologies.

In conclusion, government policy has failed to harness the market incentives needed to ensure a viable and cost-effective introduction of renewable energies into GermanyÂ’s energy portfolio. To the contrary, GermanyÂ’s principal mechanism of supporting renewable technologies through feed-in tariffs imposes high costs without any of the alleged positive impacts on emissions reductions, employment, energy security, or technological innovation. Policymakers should thus scrutinize GermanyÂ’s experience, including in the U.S., where there are currently nearly 400 federal and state programs in place that provide financial incentives for renewable energy.

Although Germany’s promotion of renewable energies is commonly portrayed in the media as setting a “shining example in providing a harvest for the world” (The Guardian, 2007), we would instead regard the country’s experience as a cautionary tale of massively expensive environmental and energy policy that is devoid of economic and environmental benefits.

Related News

Emissions rise 2% in Australia amid increased pollution from electricity and transport

Australia's greenhouse gas emissions rose in Q2 as electricity and transport pollution increased, despite renewable energy growth. Net zero targets, carbon dioxide equivalent metrics, and land use changes underscore mixed trends in decarbonisation.


Key Points

About 499-500 Mt CO2-e annually, with a 2% quarterly rise led by electricity and transport.

✅ Q2 emissions rose to 127 Mt from 124.4 Mt seasonally adjusted

✅ Electricity sector up to 41.6 Mt; transport added nearly 1 Mt

✅ Land use remains a net sink; renewables expanded capacity


Australia’s greenhouse gas emissions rose in the June quarter by about 2% as pollution from the electricity sector and transport increased.

Figures released on Tuesday by the Morrison government showed that on a year to year basis, emissions for the 12 months to last June totalled 498.9m tonnes of carbon dioxide equivalent. That tally was down 2.1%, or 10.8m tonnes compared with the same period a year earlier.

However, on a seasonally adjusted quarterly basis, emissions increased to 127m tonnes, or just over 2%, from the 124.4m tonnes reported in the March quarter. For the year to March, emissions totalled 494.2m tonnes, underscoring the pickup in pollution in the more recent quarter even as global coal power declines worldwide.

A stable pollution rate, if not a rising one, is also implied by the government’s release of preliminary figures for the September quarter. They point to 125m tonnes of emissions in trend terms for the July-September months, bringing the year to September total to about 500m tonnes, the latest report said.

The government has made much of Australia “meeting and beating” climate targets. However, the latest statistics show mostly emissions are not in decline despite its pledge ahead of the Glasgow climate summit that the country would hit net zero by 2050, and AEMO says supply can remain uninterrupted as coal phases out over the next three decades.

“Nothing’s happening except for the electricity sector,” said Hugh Saddler, an honorary associate professor at the Australian National University. Once Covid curbs on the economy eased, such as during the current quarter, emission sources such as from transport will show a rise, he predicted.

Falling costs for new wind and solar farms, with the IEA naming solar the cheapest in history worldwide, are pushing coal and gas out of electricity generation, as well as pushing down power prices. In seasonally adjusted terms, though, emissions for that sector rose from 39.7m tonnes the March quarter to 41.6m in the June one.

Most other sectors were steady, with pollution from transport adding almost 1m tonnes in the June quarter.

On an annual basis, a 500m tonnes tally is the lowest since records began in the 1990s, and IEA reported global emissions flatlined in 2019 for context. That lower trajectory, though, is lower due much to the land sector remaining a net sink even as some experts raise questions about the true trends when it comes to land clearing.

According to the government, this sector – known as land use, land-use change and forestry – amounted to a net reduction of emissions of 24.4m tonnes, or almost negative 5% of the national total, in the year to June.

Sign up to receive an email with the top stories from Guardian Australia every morning

“The magnitude of this net sink has decreased by 0.6% (0.2 Mt CO2-e) on the previous 12 months due to an increase in emissions from agricultural soils, partially offset by a continuing decline in land clearing emissions,” the latest report said.

For its part, the government also touted the increase of renewable energy, as seen in Canada's electricity progress too, as central to driving emissions lower.

“Since 2017, Australia’s consumption of renewable energy has grown at a compound annual rate of 4.6%, with more than $40bn invested in Australia’s renewable energy sector,” Angus Taylor, the federal energy minister said, while UK net zero policy changes show a different approach. “Last year, Australia deployed new solar and wind at eight times the global per capita average.”

ANU’s Saddler said the main driver had been the 2020 Renewable Energy Target that the Coalition government had cut, and had anyway been implemented “a very considerable time ago”.

Tim Baxter, the Climate Council’s senior researcher, said “the time for leaning on the achievements of others is long since past”.

“We need a federal government willing to step up on emissions reductions and take charge with real policy, not wishlists,” he said, referring to the government’s net zero plan to rely on technologies to cut pollution in pursuit of a sustainable electric planet in practice, some of which don’t exist now.


Related News

View more

Hydro One employees support Province of Ontario in the fight against COVID-19

Hydro One COVID-19 Quarantine Support connects Ontario's Ministry of Health with trained customer service teams to contact travellers, encourage self-isolation, explain quarantine rules, and share public health guidance to slow community transmission.


Key Points

Hydro One helps Ontario's MOH contact travellers and guide self-isolation for quarantine compliance.

✅ Trained agents contact returning travellers in Ontario

✅ Guidance on self-isolation, symptoms, and quarantine compliance

✅ Supports public health while freeing front-line resources


Hydro One Networks Inc. ("Hydro One") announced support to the Ministry of Health (MOH) with its efforts in contacting travellers entering Ontario to ensure they comply with Canada's mandatory quarantine measures to combat COVID-19. Hydro One has volunteered employees from its customer service operations to contact thousands of returning travellers to provide them with timely guidance on how to self-isolate and spot the symptoms of the virus to help stop its spread.

"Our team is ready to lend a helping hand and support the province to help fight this invisible enemy," said Mark Poweska, President and CEO, Hydro One. "Our very dedicated customer service staff are highly professional and will be a valuable resource in supporting the province as it works to keep Ontarians safe and slow the spread of COVID-19."

"We have seen a tremendous response from all our companies across Ontario to help us fight the COVID-19 outbreak. With this one, Hydro One is helping the province to remind Ontarians they need to stay safe at home, especially self-isolating customers throughout Ontario," said Christine Elliott, Deputy Premier and Minister of Health. "We thank them for stepping up to be part of the fantastic province-wide effort acting together and allowing our front line workers to focus their efforts where they are needed most during this challenging time."

"We are pleased to see Hydro One volunteer its resources and expertise to support in the fight against COVID-19," said Greg Rickford, Minister of Energy, Northern Development and Mines. "In these unprecedented times, I am proud to see leaders in the energy sector rise to the challenge, from restoring power after major storms to supporting the people of our province."

Hydro One and its employees play a critical role in maintaining Ontario's electricity system. Since the COVID-19 outbreak began, Hydro One has been monitoring the evolving situation and adapting its operations, including on-site lockdowns for key staff as needed to ensure it continues to deliver the service Ontarians depend on while keeping our employees, customers and the public safe.

Hydro One has also developed a number of customer support measures during COVID-19, including a new Pandemic Relief Fund to offer payment flexibility and financial assistance to customers experiencing financial hardship, suspending late payment fees and returning approximately $5 million in security deposits to businesses across Ontario.

"Customers are counting on us now more than ever – not only to keep the lights on across the province, but to offer support during this difficult time," said Poweska. "Hydro One will continue to collaborate with industry partners and the province, including mutual aid assistance with other utilities, to find new ways to offer support where it is needed."

More information about how Hydro One is supporting its customers, including its ban on disconnections and other measures, can be found at www.HydroOne.com/PandemicRelief .


Related News

View more

Tesla CEO Elon Musk slams Texas energy agency as unreliable: "not earning that R"

ERCOT Texas Power Grid Crisis disrupts millions amid a winter storm, with rolling blackouts, power outages, and energy demand; Elon Musk criticizes ERCOT as Tesla owners use Camp Mode while wind turbines face icing


Key Points

A Texas blackout during a winter storm, exposing ERCOT failures, rolling blackouts, and urgent grid resilience measures.

✅ Millions without power amid record cold and energy demand

✅ Elon Musk criticizes ERCOT over grid reliability failures

✅ Tesla Camp Mode aids warmth during extended outages


Tesla CEO Elon Musk on Wednesday slammed the Texas agency responsible for a statewide blackout amid a U.S. grid with frequent outages that has left millions of people to fend for themselves in a freezing cold winter storm.

Musk tweeted that Texas’ power grid manager, the Electricity Reliability Council of Texas (ERCOT), is not earning the “R” in the acronym, highlighting broader grid vulnerabilities that critics have noted.

Musk moved to Texas from California in December and is building a new Tesla factory in Austin. His critique of the state’s electrical grid operator came after multiple Tesla owners in the state said they had slept in their vehicles to keep warm amid the lingering power outage.

In 2019, Tesla released a vehicle with a “Camp Mode,” which enables owners to use the vehicle’s features – like lights and climate control – without significantly depleting the battery.

“We had the power go out for 6 hours last night. Our house does not have gas, and we ran out of firewood... what are we going to do,” one Reddit user wrote on “r/TeslaMotors.”

“So my wife my dog and my newborn daughter slept in the garage in our Model3 all nice and cozy. If I didn't have this car, it would have been a very rough night.”

More than two dozen people have died in the extreme weather this week, some while struggling to find warmth inside their homes. In the Houston area, one family succumbed to carbon monoxide from car exhaust in their garage. Another perished as they used a fireplace to keep warm.

Utilities from Minnesota to Texas and Mississippi have implemented rolling blackouts to ease the burden on power grids straining to meet extreme demand for heat and electricity, as longer, more frequent outages hit systems nationwide.

More than 3 million customers remained without power in Texas, Louisiana and Mississippi, more than 200,000 more in four Appalachian states, and nearly that many in the Pacific Northwest, according to poweroutage.us, which tracks utility outage reports, and advocates warn that millions could face summer shut-offs without protections.

ERCOT said early Wednesday that electricity had been restored to 600,000 homes and businesses by Tuesday night, though nearly 3 million homes and businesses remained without power, as California turns to batteries to help balance demand. Officials did not know when power would be restored.

ERCOT President Bill Magness said he hoped many customers would see at least partial service restored soon but could not say definitively when that would be.

Magness has defended ERCOT’s decision, saying it prevented an “even more catastrophic than the terrible events we've seen this week."

Utility crews raced Wednesday to restore power to nearly 3.4 million customers around the U.S. who were still without electricity in the aftermath of a deadly winter storm, even as officials urge residents to prepare for summer blackouts that could tax systems further, and another blast of ice and snow threatened to sow more chaos.

The latest storm front was expected to bring more hardship to states that are unaccustomed to such frigid weather — parts of Texas, Arkansas and the Lower Mississippi Valley — before moving into the Northeast on Thursday.

"There's really no letup to some of the misery people are feeling across that area," said Bob Oravec, lead forecaster with the National Weather Service, referring to Texas.

Sweden, known for its brutally cold climate, has offered some advice to Texans unaccustomed to such freezing temperatures, as Canadian grids are increasingly exposed to harsh weather that strains reliability. Stefan Skarp of the Swedish power company told Bloomberg on Tuesday: “The problem with sub-zero temperatures and humid air is that ice will form on the wind turbines.”

“When ice freezes on to the wings, the aerodynamic changes for the worse so that wings catch less and less wind until they don't catch any wind at all,” he said.


Related News

View more

Rising Electricity Prices: Inflation, Climate Change, and Clean Energy Challenges

Rising Electricity Prices are driven by inflation, climate change, and the clean energy transition, affecting energy bills, grid resilience, and supply. Renewables, storage, and infrastructure upgrades shape costs, volatility, and long-term sustainability.


Key Points

Rising electricity prices stem from inflation, climate risk, and costs of integrating clean energy and storage into modern grids.

✅ Inflation raises fuel, materials, and labor costs for utilities

✅ Extreme weather damages infrastructure and strains peak demand

✅ Clean energy rollout needs storage, backup, and grid upgrades


In recent months, consumers have been grappling with a concerning trend: rising electricity prices across the country. This increase is not merely a fluctuation but a complex issue shaped by a confluence of factors including inflation, climate change, and the transition to clean energy. Understanding these dynamics is crucial for navigating the current energy landscape and preparing for its future.

Inflation and Its Impact on Energy Costs

Inflation, the economic phenomenon of rising prices across various sectors, has significantly impacted the cost of living, including electricity and natural gas prices for households. As the price of goods and services increases, so too does the cost of producing and delivering electricity. Energy production relies heavily on raw materials, such as metals and fuels, whose prices have surged in recent years. For instance, the costs associated with mining, transporting, and refining these materials have risen, thereby increasing the operational expenses for power plants.

Moreover, inflation affects labor costs, as wages often need to keep pace with the rising cost of living. As utility companies face higher expenses for both materials and labor, these costs are inevitably passed on to consumers in the form of higher electricity bills.

Climate Change and Energy Supply Disruptions

Climate change also plays a significant role in driving up electricity prices. Extreme weather events, such as hurricanes, heatwaves, and floods, have become more frequent and severe due to climate change. These events disrupt energy production and distribution by damaging infrastructure, impeding transportation, and affecting the availability of resources.

For example, hurricanes can knock out power plants and damage transmission lines, leading to shortages and higher costs. During periods of extreme summer heat across many regions, heatwaves can strain the power grid as increased demand for air conditioning pushes the system to its limits. Such disruptions not only lead to higher immediate costs but also necessitate costly repairs and infrastructure upgrades.

Additionally, the increasing frequency of natural disasters forces utilities to invest in more resilient infrastructure, as many utilities spend more on delivery to harden grids and reduce outages, which adds to overall costs. These investments, while necessary for long-term reliability, contribute to short-term price increases for consumers.

The Transition to Clean Energy

The shift towards clean energy is another pivotal factor influencing electricity prices. While renewable energy sources like wind, solar, and hydro power are crucial for reducing greenhouse gas emissions and combating climate change, their integration into the existing grid presents challenges.

Renewable energy infrastructure requires substantial initial investment. The construction of wind farms, solar panels, and the associated grid improvements involve significant capital expenditure. These upfront costs are often reflected in electricity prices. Moreover, renewable energy sources can be intermittent, meaning they do not always produce electricity at times of high demand. This intermittency necessitates the development of energy storage solutions and backup systems, which further adds to the costs.

Utilities are also transitioning from fossil fuel-based energy production to cleaner alternatives, a process that involves both technological and operational shifts and intersects with the broader energy crisis impacts on electricity, gas, and EVs nationwide. These changes can temporarily increase costs as utilities phase out old systems and implement new ones. While the long-term benefits of cleaner energy include environmental sustainability and potentially lower operating costs, the transition period can be financially burdensome for consumers.

The Path Forward

Addressing rising electricity prices requires a multifaceted approach. Policymakers must balance the need for immediate relief, as California regulators face calls for action amid soaring bills, with the long-term goals of sustainability and resilience. Investments in energy efficiency can help reduce overall demand and ease pressure on the grid. Expanding and modernizing energy infrastructure to accommodate renewable sources can also mitigate price volatility.

Additionally, efforts to mitigate climate change through improved resilience and adaptive measures can reduce the frequency and impact of extreme weather events, thereby stabilizing energy costs.

Consumer education is vital in this process. Understanding the factors driving electricity prices can empower individuals to make informed decisions about energy consumption and conservation. Furthermore, exploring energy-efficient appliances and practices can help manage costs in the face of rising prices.

In summary, the rising cost of electricity is a multifaceted issue influenced by inflation, climate change, and the transition to clean energy, and recent developments show Germany's rising energy costs in the coming year. While these factors pose significant challenges, they also offer opportunities for innovation and improvement in how we produce, distribute, and consume energy. By addressing these issues with a balanced approach, it is possible to navigate the complexities of rising electricity prices while working towards a more sustainable and resilient energy future.


Related News

View more

California's solar energy gains go up in wildfire smoke

California Wildfire Smoke Impact on Solar reduces photovoltaic output, as particulate pollution, soot, and haze dim sunlight and foul panels, cutting utility-scale generation and grid reliability across CAISO during peak demand and heatwaves.


Key Points

How smoke and soot cut solar irradiance and foul panels, slashing PV generation and straining CAISO grid operations.

✅ Smoke blocks sunlight; soot deposition reduces panel efficiency.

✅ CAISO reported ~30% drop versus July during peak smoke.

✅ Longer fire seasons threaten solar reliability and capacity planning.


Smoke from California’s unprecedented wildfires was so bad that it cut a significant chunk of solar power production in the state, even as U.S. solar generation rose in 2022 nationwide. Solar power generation dropped off by nearly a third in early September as wildfires darkened the skies with smoke, according to the US Energy Information Administration.

Those fires create thick smoke, laden with particles that block sunlight both when they’re in the air and when they settle onto solar panels. In the first two weeks of September, soot and smoke caused solar-powered electricity generation to fall 30 percent compared to the July average, according to the California Independent System Operator (CAISO), which oversees nearly all utility-scale solar energy in California, where wind and solar curtailments have been rising amid grid constraints. It was a 13.4 percent decrease from the same period last year, even though solar capacity in the state has grown about 5 percent since September 2019.

California depends on solar installations for nearly 20 percent of its electricity generation, and has more solar capacity than the next five US states trailing it combined as it works to manage its solar boom sustainably. It will need even more renewable power to meet its goal of 100 percent clean electricity generation by 2045, building on a recent near-100% renewable milestone that underscored the transition. The state’s emphasis on solar power is part of its long-term efforts to avoid more devastating effects of climate change. But in the short term, California’s renewables are already grappling with rising temperatures.

Two records were smashed early this September that contributed to the loss of solar power. California surpassed 2 million acres burned in a single fire season for the first time (1.7 million more acres have burned since then). And on September 15th, small particle pollution reached the highest levels recorded since 2000, according to the California Air Resources Board. Winds that stoked the flames also drove pollution from the largest fires in Northern California to Southern California, where there are more solar farms.

Smaller residential and commercial solar systems were affected, too, and solar panels during grid blackouts typically shut off for safety, although smoke was the primary issue here. “A lot of my systems were producing zero power,” Steve Pariani, founder of the solar installation company Solar Pro Energy Systems, told the San Mateo Daily Journal in September.

As the planet heats up, California’s fire seasons have grown longer, and blazes are tearing through more land than ever before, while grid operators are also seeing rising curtailments as they integrate more renewables. For both utilities and smaller solar efforts, wildfire smoke will continue to darken solar energy’s otherwise bright future, even as it becomes the No. 3 renewable source in the U.S. by generation.


Related News

View more

Climate change: Greenhouse gas concentrations again break records

Rising Greenhouse Gas Concentrations drive climate change, with CO2, methane, and nitrous oxide surging; WMO data show higher radiative forcing, elevated pre-industrial baselines, and persistent atmospheric concentrations despite Paris Agreement emissions pledges.


Key Points

Increasing atmospheric CO2, methane, and nitrous oxide levels that raise radiative forcing and drive warming.

✅ WMO data show CO2 at 407.8 ppm in 2018, above decade average

✅ Methane and nitrous oxide surged, elevating total radiative forcing

✅ Concentrations differ from emissions; sinks absorb about half


The World Meteorological Organization (WMO) says the increase in CO2 was just above the average rise recorded over the last decade.

Levels of other warming gases, such as methane and nitrous oxide, have also surged by above average amounts.

Since 1990 there's been an increase of 43% in the warming effect on the climate of long lived greenhouse gases.

The WMO report looks at concentrations of warming gases in the atmosphere rather than just emissions.

The difference between the two is that emissions refer to the amount of gases that go up into the atmosphere from the use of fossil fuels, such as burning coal for coal-fired electricity generation and from deforestation.

Concentrations are what's left in the air after a complex series of interactions between the atmosphere, the oceans, the forests and the land. About a quarter of all carbon emissions are absorbed by the seas, and a similar amount by land and trees, while technologies like carbon capture are being explored to remove CO2.

Using data from monitoring stations in the Arctic and all over the world, researchers say that in 2018 concentrations of CO2 reached 407.8 parts per million (ppm), up from 405.5ppm a year previously.

This increase was above the average for the last 10 years and is 147% of the "pre-industrial" level in 1750.

The WMO also records concentrations of other warming gases, including methane and nitrous oxide, and some countries have reported declines in certain potent gases, as noted in US greenhouse gas controls reports, though global levels remain elevated. About 40% of the methane emitted into the air comes from natural sources, such as wetlands, with 60% from human activities, including cattle farming, rice cultivation and landfill dumps.

Methane is now at 259% of the pre-industrial level and the increase seen over the past year was higher than both the previous annual rate and the average over the past 10 years.

Nitrous oxide is emitted from natural and human sources, including from the oceans and from fertiliser-use in farming. According to the WMO, it is now at 123% of the levels that existed in 1750.

Last year's increase in concentrations of the gas, which can also harm the ozone layer, was bigger than the previous 12 months and higher than the average of the past decade.

What concerns scientists is the overall warming impact of all these increasing concentrations. Known as total radiative forcing, this effect has increased by 43% since 1990, and is not showing any indication of stopping.

There is no sign of a slowdown, let alone a decline, in greenhouse gases concentration in the atmosphere despite all the commitments under the Paris agreement on climate change and the ongoing global energy transition efforts," said WMO Secretary-General Petteri Taalas.

"We need to translate the commitments into action and increase the level of ambition for the sake of the future welfare of mankind," he added.

"It is worth recalling that the last time the Earth experienced a comparable concentration of CO2 was three to five million years ago. Back then, the temperature was 2-3C warmer, sea level was 10-20m higher than now," said Mr Taalas.

The UN Environment Programme will report shortly on the gap between what actions countries are taking to cut carbon, for example where Australia's emissions rose 2% recently, and what needs to be done to keep under the temperature targets agreed in the Paris climate pact.

Preliminary findings from this study, published during the UN Secretary General's special climate summit last September, indicated that emissions continued to rise during 2018, although global emissions flatlined in 2019 according to the IEA.

Both reports will help inform delegates from almost 200 countries who will meet in Madrid next week for COP25, following COP24 in Katowice the previous year, the annual round of international climate talks.


Related News

View more

Sign Up for Electricity Forum’s Newsletter

Stay informed with our FREE Newsletter — get the latest news, breakthrough technologies, and expert insights, delivered straight to your inbox.

Electricity Today T&D Magazine Subscribe for FREE

Stay informed with the latest T&D policies and technologies.
  • Timely insights from industry experts
  • Practical solutions T&D engineers
  • Free access to every issue

Live Online & In-person Group Training

Advantages To Instructor-Led Training – Instructor-Led Course, Customized Training, Multiple Locations, Economical, CEU Credits, Course Discounts.

Request For Quotation

Whether you would prefer Live Online or In-Person instruction, our electrical training courses can be tailored to meet your company's specific requirements and delivered to your employees in one location or at various locations.