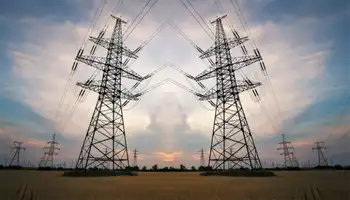
Video Shows Hacker Hit on Power Grid

By Hartford Courant


CSA Z462 Arc Flash Training - Electrical Safety Essentials

Our customized live online or in‑person group training can be delivered to your staff at your location.

  • Live Online
  • 6 hours Instructor-led
  • Group Training Available
Regular Price:
$249
Coupon Price:
$199
Reserve Your Seat Today
A government video shows the potential destruction caused by hackers seizing control of a crucial part of the U.S. electrical grid: an industrial turbine spinning wildly out of control until it becomes a smoking hulk and power shuts down.

The video, produced for the Homeland Security Department and obtained by The Associated Press, was marked "Official Use Only." It shows commands quietly triggered by simulated hackers having such a violent reaction that the enormous turbine shudders as pieces fly apart and it belches black-and-white smoke.

The video was produced for top U.S. policy makers by the Idaho National Laboratory, which has studied the little-understood risks to the specialized electronic equipment that operates power, water and chemical plants. Vice President Dick Cheney is among those who have watched the video, said one U.S. official, speaking on condition of anonymity because this official was not authorized to publicly discuss such high-level briefings.

"They've taken a theoretical attack and they've shown in a very demonstrable way the impact you can have using cyber means and cyber techniques against this type of infrastructure," said Amit Yoran, former U.S. cybersecurity chief for the Bush administration. Yoran is chief executive for NetWitness Corp., which sells sophisticated network monitoring software.

"It's so graphic," Yoran said. "Talking about bits and bytes doesn't have the same impact as seeing something catch fire."

The electrical attack never actually happened. The recorded demonstration, called the "Aurora Generator Test," was conducted in March by government researchers investigating a dangerous vulnerability in computers at U.S. utility companies known as supervisory control and data acquisition systems. The programming flaw was quietly fixed, and equipment-makers urged utilities to take protective measures.

There was no evidence any U.S. utility company suffered damage from hackers or terrorists using this technique, U.S. officials said. But these officials cautioned that affected systems are not routinely monitored as closely as many modern corporate computer networks, so there would be little forensic evidence to study after such a break-in.

Industry experts cautioned that intruders would need specialized knowledge to carry out such attacks, including the ability to turn off warning systems.

"The video is not a realistic representation of how the power system would operate," said Stan Johnson, a manager at the North American Electric Reliability Corp., the Princeton, N.J.-based organization charged with overseeing the power grid.

A top Homeland Security Department official, Robert Jamison, said companies are working to limit such attacks.

"Is this something we should be concerned about? Yes," said Jamison, who oversees the department's cybersecurity division. "But we've taken a lot of risk off the table."

President Bush's top telecommunications advisers concluded years ago that an organization such as a foreign intelligence service or a well-funded terror group "could conduct a structured attack on the electric power grid electronically, with a high degree of anonymity, and without having to set foot in the target nation."

Ominously, the Idaho National Laboratory - which produced the new video - has described the risk as "the invisible threat."

Experts said the affected systems were not developed with security in mind.

"What keeps your lights on are some very, very old technology," said Joe Weiss, a security expert who has testified before Congress about such threats. "If you can get access to these systems, you can conceptually cause them to do whatever it is you want them to do."

The Homeland Security Department has been working with industries, especially electrical and nuclear companies, to enhance security measures. The electric industry is still working on their internal assessments and plans, but the nuclear sector has implemented its security measures at all its plants, the government said.

In July the Federal Energy Regulatory Commission proposed a set of standards to help protect the country's bulk electric power supply system from cyber attacks. These standards would require certain users, owners and operators of power grids to establish plans and controls.

Related News

World Bank Backs India's Low-Carbon Transition with $1.5 Billion

World Bank Financing for India's Low-Carbon Transition accelerates clean energy deployment, renewable energy capacity, and energy efficiency, channeling climate finance into solar, wind, grid upgrades, and green jobs for sustainable development and climate resilience.


Key Points

$1.5B World Bank support to scale renewables, boost energy efficiency, and drive India's low-carbon growth.

✅ Funds solar, wind, and grid modernization projects

✅ Backs industrial and building energy-efficiency upgrades

✅ Catalyzes green jobs, innovation, and climate resilience


In a significant move towards bolstering India's efforts towards a low-carbon future, the World Bank has approved an additional $1.5 billion in financing. This article explores how this funding aims to support India's transition to cleaner energy sources, informed by global moves toward clean and universal electricity standards and market access, the projects it will fund, and the broader implications for sustainable development.

Commitment to Low-Carbon Transition

India, as one of the world's largest economies, faces substantial challenges in balancing economic growth with environmental sustainability. The country has committed to reducing its carbon footprint and enhancing energy efficiency through various initiatives and partnerships. The World Bank's financing represents a crucial step towards achieving these goals within the context of the global energy transition now underway, providing essential resources to accelerate India's transition towards a low-carbon economy.

Projects Supported by World Bank Funding

The $1.5 billion financing package will support several key projects aimed at advancing India's renewable energy sector and promoting sustainable development practices. These projects may include the expansion of solar and wind energy capacity, enhancing energy efficiency in industries and buildings, improving waste management systems, and fostering innovation in clean technologies.

Impact on Renewable Energy Sector

India's renewable energy sector stands to benefit significantly from the World Bank's financial support. With investments in solar and wind power projects, and broader shifts toward carbon-free electricity across utilities, the country can increase its renewable energy capacity, reduce dependency on fossil fuels, and mitigate greenhouse gas emissions. This expansion not only enhances energy security but also creates opportunities for job creation and economic growth in the clean energy sector.

Enhancing Energy Efficiency

In addition to renewable energy projects, the financing will likely focus on enhancing energy efficiency across various sectors. Improving energy efficiency in industries, transportation, and residential buildings is critical to reducing overall energy consumption, and analyses of decarbonizing Canada's electricity grid highlight how efficiency supports lower carbon emissions and progress toward sustainable development goals. The World Bank's support in this area can facilitate technological advancements and policy reforms that promote energy conservation practices.

Promoting Sustainable Development

The World Bank's financing is aligned with India's broader goals of promoting sustainable development and addressing climate change impacts. By investing in clean energy infrastructure and promoting environmentally sound practices, and amid momentum from the U.S. climate deal that shapes investment expectations, the funding contributes to enhancing resilience to climate risks, improving air quality, and fostering inclusive economic growth that benefits all segments of society.

Collaboration and Partnership

The approval of $1.5 billion in financing underscores the importance of international collaboration and partnership in advancing global climate goals, drawing lessons from China's path to carbon neutrality where relevant. The World Bank's engagement with India demonstrates a commitment to supporting developing countries in their efforts to transition towards sustainable development pathways and build resilience against climate change impacts.

Challenges and Opportunities

Despite the positive impact of the World Bank's financing, India faces challenges such as regulatory barriers, funding constraints, and technological limitations in scaling up renewable energy and energy efficiency initiatives, as well as evolving investor sentiment amid U.S. oil policy shifts that affect energy strategy. Addressing these challenges requires coordinated efforts from government agencies, private sector stakeholders, and international partners to overcome barriers and maximize the impact of investments in sustainable development.

Conclusion

The World Bank's approval of $1.5 billion in financing to support India's low-carbon transition marks a significant milestone in global efforts to combat climate change and promote sustainable development. By investing in renewable energy, enhancing energy efficiency, and fostering innovation, the funding contributes to building a cleaner, more resilient future for India and sets a precedent for international cooperation in addressing pressing environmental challenges worldwide.


Related News

View more

For Hydro-Québec, selling to the United States means reinventing itself

Hydro-Quebec hydropower exports deliver low-carbon electricity to New England, sparking debate on greenhouse gas accounting, grid attributes, and REC-style certificates as Quebec modernizes monitoring to verify emissions, integrate renewables, and meet ambitious climate targets.


Key Points

Low-carbon electricity to New England, with improved emissions tracking and verifiable grid attributes.

✅ Deep, narrow reservoirs cut lifecycle GHGs in cold boreal waters

✅ Attribute certificates trace source, type, and carbon intensity

✅ Contracts require facility-level tagging for compliance


For 40 years, through the most vicious interprovincial battles, even as proposals for bridging the Alberta-B.C. gap aimed to improve grid resilience, Canadians could agree on one way Quebec is undeniably superior to the rest of the country.

It’s hydropower, and specifically the mammoth dam system in Northern Quebec that has been paying dividends since it was first built in the 70s. “Quebec continues to boast North America’s lowest electricity prices,” was last year’s business-as-usual update in one trade publication, even as Newfoundland's rate strategy seeks relief for consumers.

With climate crisis looming, that long-ago decision earns even more envy and reflects Canada's electricity progress across the grid today. Not only do they pay less, but Quebeckers also emit the least carbon per capita of any province.

It may surprise most Canadians, then, to hear how most of New England has reacted to the idea of being able to buy permanently into Quebec’s power grid.

​​​​​​Hydro-Québec’s efforts to strike major export deals have been rebuffed in the U.S., by environmentalists more than anyone. They question everything about Quebec hydropower, including asking “is it really low-carbon?”

These doubts may sound nonsensical to regular Quebeckers. But airing them has, in fact, pushed Hydro-Québec to learn more about itself and adopt new technology.

We know far more about hydropower than we knew 40 years ago, including whether it’s really zero-emission (it’s not), how to make it as close to zero-emission as possible, and how to account for it as precisely as new clean energies like solar and wind, underscoring how cleaning up Canada's electricity is vital to meeting climate pledges.

The export deals haven’t gone through yet, but they’ve already helped drag Hydro-Québec—roughly the fourth-biggest hydropower system on the planet—into the climate era.

Fighting to export
One of the first signs of trouble for Quebec hydro was in New Hampshire, almost 10 years ago. People there began pasting protest signs on their barns and buildings. One citizens’ group accused Hydro of planning a “monstrous extension cord” across the state.

Similar accusations have since come from Maine, Massachusetts and New York.

The criticism isn’t coming from state governments, which mostly want a more permanent relationship with Hydro-Québec. They already rely on Quebec power, but in a piecemeal way, topping up their own power grid when needed (with the exception of Vermont, which has a small permanent contract for Quebec hydropower).

Last year, Quebec provided about 15 percent of New England’s total power, plus another substantial amount to New York, which is officially not considered to be part of New England, and has its own energy market separate from the New England grid.

Now, northeastern states need an energy lynch pin, rather than a top-up, with existing power plants nearing the end of their lifespans. In Massachusetts, for example, one major nuclear plant shut down this year and another will be retired in 2021. State authorities want a hydro-based energy plan that would send $10 billion to Hydro-Québec over 20 years.

New England has some of North America’s most ambitious climate goals, with every state in the region pledging to cut emissions by at least 80 percent over the next 30 years.

What’s the downside? Ask the citizens’ groups and nonprofits that have written countless op-eds, organized petitions and staged protests. They argue that hydropower isn’t as clean as cutting-edge clean energy such as solar and wind power, and that Hydro-Québec isn’t trying hard enough to integrate itself into the most innovative carbon-counting energy system. Right as these other energy sources finally become viable, they say, it’s a step backwards to commit to hydro.

As Hydro-Québec will point out, many of these critics are legitimate nonprofits, but others may have questionable connections. The Portland Press Herald in Maine reported in September 2018 that a supposedly grassroot citizens’ group called “Stand Up For Maine” was actually funded by the New England Power Generators Association, which is based in Boston and represents such power plant owners as Calpine Corp., Vistra Energy and NextEra Energy.

But in the end, that may not matter. Arguably the biggest motivator to strike these deals comes not from New England’s needs, but from within Quebec. The province has spent more than $10 billion in the last 15 years to expand its dam and reservoir system, and in order to stay financially healthy, it needs to double its revenue in the next 10 years—a plan that relies largely on exports.

With so much at stake, it has spent the last decade trying to prove it can be an energy of the future.

“Learning as you go”
American critics, justified or not, have been forcing advances at Hydro for a long time.

When the famously huge northern Quebec hydro dams were built at James Bay—construction began in the early 1970s—the logic was purely economic. The term “climate change” didn’t exist. The province didn’t even have an environment department.

The only reason Quebec scientists started trying to measure carbon emissions from hydro reservoirs was “basically because of the U.S.,” said Alain Tremblay, a senior environmental advisor at Hydro Quebec.


Alain Tremblay, senior environmental advisor at Hydro-Québec. Photograph courtesy of Hydro-Québec
In the early 1990s, Hydro began to export power to the U.S., and “because we were a good company in terms of cost and efficiency, some Americans didn't like that,” he said—mainly competitors, though he couldn’t say specifically who. “They said our reservoirs were emitting a lot of greenhouse gases.”

The detractors had no research to back up that claim, but Hydro-Québec had none to refute it, either, said Tremblay. “At that time we didn’t have any information, but from back-of-the envelope calculations, it was impossible to have the emissions the Americans were expecting we have.”

So research began, first to design methods to take the measurements, and then to carry them out. Hydro began a five-year project with a Quebec university.

It took about 10 years to develop a solid methodology, Tremblay said, with “a lot of error and learning-as-you-go.” There have been major strides since then.

“Twenty years ago we were taking a sample of water, bringing it back to the lab and analyzing that with what we call a gas chromatograph,” said Tremblay. “Now, we have an automated system that can measure directly in the water,” reading concentrations of CO2 and methane every three hours and sending its data to a processing centre.

The tools Hydro-Québec uses are built in California. Researchers around the world now follow the same standard methods.

At this point, it’s common knowledge that hydropower does emit greenhouse gases. Experts know these emissions are much higher than previously thought.

Workers on the Eastmain-1 project environmental monitoring program. Photography courtesy of Alain Tremblay.
​But Hydro-Québec now has the evidence, also, to rebut the original accusations from the early 1990s and many similar ones today.

“All our research from Université Laval [found] that it’s about a thousand years before trees decompose in cold Canadian waters,” said Tremblay.

Hydro reservoirs emit greenhouse gases because vegetation and sometimes other biological materials, like soil runoff, decay under the surface.

But that decay depends partly on the warmth of the water. In tropical regions, including the southern U.S., hydro dams can have very high emissions. But in boreal zones like northern Quebec (or Manitoba, Labrador and most other Canadian locations with massive hydro dams), the cold, well-oxygenated water vastly slows the process.

Hydro emissions have “a huge range,” said Laura Scherer, an industrial ecology professor at Leiden University in the Netherlands who led a study of almost 1,500 hydro dams around the world.

“It can be as low as other renewable energy sources, but it can also be as high as fossil fuel energy,” in rare cases, she said.

While her study found that climate was important, the single biggest factor was “sizing and design” of each dam, and specifically its shape, she said. Ideally, hydro dams should be deep and narrow to minimize surface area, perhaps using a natural valley.

Hydro-Québec’s first generation of dams, the ones around James Bay, were built the opposite way—they’re wide and shallow, infamously flooding giant tracts of land.


Alain Tremblay, senior environmental advisor at Hydro-Québec testing emission levels. Photography courtesy of Alain Tremblay
Newly built ones take that new information into account, said Tremblay. Its most recent project is the Romaine River complex, which will eventually include four reservoirs near Quebec’s northeastern border with Labrador. Construction began in 2016.

The site was picked partly for its topography, said Tremblay.

“It’s a valley-type reservoir, so large volume, small surface area, and because of that there’s a pretty limited amount of vegetation that’s going to be flooded,” he said.

There’s a dramatic emissions difference with the project built just before that, commissioned in 2006. Called Eastmain, it’s built near James Bay.

“The preliminary results indicate with the same amount of energy generated [by Romaine] as with Eastmain, you’re going to have about 10 times less emissions,” said Tremblay.

Tracing energy to its source
These signs of progress likely won’t satisfy the critics, who have publicly argued back and forth with Hydro about exactly how emissions should be tallied up.

But Hydro-Québec also faces a different kind of growing gap when it comes to accounting publicly for its product. In the New England energy market, a sophisticated system “tags” all the energy in order to delineate exactly how much comes from which source—nuclear, wind, solar, and others—and allows buyers to single out clean power, or at least the bragging rights to say they bought only clean power.

Really, of course, it’s all the same mix of energy—you can’t pick what you consume. But creating certificates prevents energy producers from, in worst-case scenarios, being able to launder regular power through their clean-power facilities. Wind farms, for example, can’t oversell what their own turbines have produced.

What started out as a fraud prevention tool has “evolved to make it possible to also track carbon emissions,” said Deborah Donovan, Massachusetts director at the Acadia Center, a climate-focused nonprofit.

But Hydro-Québec isn’t doing enough to integrate itself into this system, she says.

It’s “the tool that all of our regulators in New England rely on when we are confirming to ourselves that we’ve met our clean energy and our carbon goals. And…New York has a tool just like that,” said Donovan. “There isn’t a tracking system in Canada that’s comparable, though provinces like Nova Scotia are tapping the Western Climate Initiative for technical support.”

Hydro Quebec Chénier-Vignan transmission line crossing the Outaouais river. Photography courtesy of Hydro-Québec
Developing this system is more a question of Canadian climate policy than technology.

Energy companies have long had the same basic tracking device—a meter, said Tanya Bodell, a consultant and expert in New England’s energy market. But in New England, on top of measuring “every time there’s a physical flow of electricity” from a given source, said Bodell, a meter “generates an attribute or a GIS certificate,” which certifies exactly where it’s from. The certificate can show the owner, the location, type of power and its average emissions.

Since 2006, Hydro-Québec has had the ability to attach the same certificates to its exports, and it sometimes does.

“It could be wind farm generation, even large hydro these days—we can do it,” said Louis Guilbault, who works in regulatory affairs at Hydro-Québec. For Quebec-produced wind energy, for example, “I can trade those to whoever’s willing to buy it,” he said.

But, despite having the ability, he also has the choice not to attach a detailed code—which Hydro doesn’t do for most of its hydropower—and to have it counted instead under the generic term of “system mix.”

Once that hydropower hits the New England market, the administrators there have their own way of packaging it. The market perhaps “tries to determine emissions, GHG content,” Guilbault said. “They have their own rules; they do their own calculations.”

This is the crux of what bothers people like Donovan and Bodell. Hydro-Québec is fully meeting its contractual obligations, since it’s not required to attach a code to every export. But the critics wish it would, whether by future obligation or on its own volition.

Quebec wants it both ways, Donovan argued; it wants the benefits of selling low-emission energy without joining the New England system of checks and balances.

“We could just buy undifferentiated power and be done with it, but we want carbon-free power,” Donovan said. “We’re buying it because of its carbon content—that’s the reason.”

Still, the requirements are slowly increasing. Under Hydro-Québec’s future contract with Massachusetts (which still has several regulatory steps to go through before it’s approved) it’s asked to sell the power’s attributes, not just the power itself. That means that, at least on paper, Massachusetts wants to be able to trace the energy back to a single location in Quebec.

“It’s part of the contract we just signed with them,” said Guilbault. “We’re going to deliver those attributes. I’m going to select a specific hydro facility, put the number in...and transfer that to the buyers.”

Hydro-Québec says it’s voluntarily increasing its accounting in other ways. “Even though this is not strictly required,” said spokeswoman Lynn St. Laurent, Hydro is tracking its entire output with a continent-wide registry, the North American Renewables Registry.

That registry is separate from New England’s, so as far as Bodell is concerned, the measure doesn’t really help. But she and others also expect the entire tracking system to grow and mature, perhaps integrating into one. If it had been created today, in fact, rather than in the 1990s, maybe it would use blockchain technology rather than a varied set of administrators, she said.

Counting emissions through tracking still has a long way to go, as well, said Donovan, and it will increasingly matter in Canada's race to net-zero as standards tighten. For example, natural gas is assigned an emissions number that’s meant to reflect the emissions when it’s consumed. But “we do not take into account what the upstream carbon emissions are through the pipeline leakage, methane releases during fracking, any of that,” she said.

Now that the search for exactitude has begun, Hydro-Québec won’t be exempt, whether or not Quebeckers share that curiosity. “We don’t know what Hydro-Québec is doing on the other side of the border,” said Donovan.


Related News

View more

Spain's power demand in April plummets under COVID-19 lockdown

Spain Electricity Demand April 2020 saw a 17.3% year-on-year drop as COVID-19 lockdown curbed activity; renewables and wind power lifted the emission-free share, while combined cycle plants dominated islands, per REE data.


Key Points

A 17.3% y/y decline amid COVID-19 lockdown, with 47.9% renewables and wind at 21.3% of the national power mix.

✅ Mainland demand -17%; Balearic -27.6%; Canary -20.3%.

✅ Emission-free share: 49.7% on the peninsula in April.

✅ Combined cycle led islands; coal absent in Balearics.


Demand for electricity in Spain dropped by 17.3% year-on-year to an estimated 17,104 GWh in April, aligning with a 15% global daily demand dip during the pandemic, while the country’s economy slowed down under the national state of emergency and lockdown measures imposed to curb the spread of COVID-19.

According to the latest estimates by Spanish grid operator Red Electrica de Espana (REE), the decline in demand was registered across Spain’s entire national territory, similar to a 10% UK drop during lockdown. On the mainland, it decreased by 17% to 16,191 GWh, while on the Balearic and the Canary Islands it plunged by 27.6% and 20.3%, respectively.

Renewables accounted for 47.9% of the total national electricity production in April, echoing Britain’s cleanest electricity trends during lockdown. Wind power production went down 20% year-on-year to 3,730 GWh, representing a 21.3% share in the total power mix.

During April, electricity generation in the peninsula was mostly based on emission-free technologies, reflecting an accelerated power-system transition across Europe, with renewables accounting for 49.7%. Wind farms produced 3,672 GWh, 20.1% less compared to April 2019, while contributing 22% to the power mix, even as global demand later surpassed pre-pandemic levels in subsequent periods.

In the Balearic Islands, electricity demand of 323,296 MWh was for the most part met by combined cycle power plants, even as some European demand held firm in later lockdowns, which accounted for 78.3% of the generation. Renewables and emission-free technologies had a combined share of 6.4%, while coal was again absent from the local power mix, completing now four consecutive months without contributing a single MWh.

In the Canary Islands system, demand for power decreased to 558,619 MWh, even as surging demand elsewhere strained power systems across the world. Renewables and emission-free technologies made up 14.3% of the mix, while combined cycle power plants led with a 45.3% share.


Related News

View more

Electricity subsidies to pulp and paper mills to continue, despite NB Power's rising debt

NB Power Pulp and Paper Subsidies lower electricity rates for six New Brunswick mills using firm power benchmarks and interruptible discounts, while government mandates, utility debt, ratepayer impacts, and competitiveness pressures shape provincial energy policy.


Key Points

Provincial mandates that buy down firm electricity rates for six mills to a national average, despite NB Power's debt.

✅ Mandated buy-down to match national firm electricity rates

✅ Ignores large non-firm interruptible power discounts

✅ Raises equity concerns amid NB Power debt and rate pressure


An effort to fix NB Power's struggling finances that is supposed to involve a look at "all options" will not include a review of the policy that requires the utility to subsidize electricity prices for six New Brunswick pulp and paper mills, according to the Department of Natural Resources and Energy Development.

The program is meant "to enable New Brunswick's pulp and paper companies have access to competitive priced electricity,"  said the department's communications officer Nick Brown in an email Monday 

"Keeping our large industries competitive with other Canadian jurisdictions, amid Nova Scotia rate hike opposition debates elsewhere, is important," he wrote, knocking down the idea the subsidy program might be scrutinized for shortcomings like other NB Power expenses.

Figures released last week show NB Power paid out $9.7 million in rate subsidies to the mills under the program in the fiscal year ended in March 2021, even though the utility was losing $4 million for the year and falling deeper into debt, amid separate concerns about old meter issues affecting households.

Subsidies went to three mills owned by J.D. Irving Ltd. including two in Saint John and one in Lake Utopia, two owned by the AV group in Nackawic and Atholville and the Twin Rivers pulp mill in Edmundston.

The New Brunswick government has made NB Power subsidize pulp and paper mills like Twin Rivers Paper Company since 2012, and is requiring the program to continue despite financial problems at the utility. (CBC)
It was NB Power's second year in a row of financial losses, while it is supposed to pay down $500 million of its $4.9 billion debt load in the next five years to prepare for the refurbishment of the Mactaquac dam, a burden comparable to customers in Newfoundland paying for Muskrat Falls elsewhere under separate policies, under a directive issued by the province

NB Power president Keith Cronkhite said he was "very disappointed" with debt increasing last year instead of  falling and senior vice president and chief financial officer Darren Murphy said everything would be under the microscope this year to turn the utility's finances around.  

"We need to do better," said Murphy on Thursday

"We need to step back and make sure we're considering all options, including approaches like Newfoundland's ratepayer shield agreement on megaproject overruns, to achieve that objective because the objective is quickly closing in on us."

However, reviewing the subsidy program for the six pulp and paper mills is apparently off limits.

The subsidy program requires NB Power to buy down the cost of "firm" electricity bought by pulp and paper mills to a national average that is calculated by the Department of Natural Resources and Energy Development.

Last year the province declared the price mills in New Brunswick pay to be an average of  7.536 cents per kilowatt hour (kwh).  It is higher than rates in five other provinces that have mills, which the province points to as justification for the subsidies, even as Nova Scotia's 14% rate hike approval highlights broader upward pressure, although the true significance of that difference is not entirely clear.

In British Columbia, the large forest products company Paper Excellence operates five pulp and paper mills which are charged 17.2 per cent less for firm electricity than the six mills in New Brunswick.

The Paper Excellence Paper Mill in Port Alberni, B.C. pays lower electricity prices than mills in New Brunswick, a benefit largely offset by higher property taxes. It's a factor New Brunswick does not count in calculating subsidies NB Power must pay. (Paper Excellence)
However, local property taxes on the five BC mills are a combined $7.8 million higher than the six New Brunswick plants, negating much of that difference.

The province's subsidy formula does not account for differences like that or for the fact New Brunswick mills buy a high percentage of their electricity at cheap non-firm prices.

Not counting the subsidies, NB Power already sells high volumes of what it calls interruptible and surplus power to industry at deep discounts on the understanding it can be cut off and redeployed elsewhere on short notice when needed.

Actual interruptions in service are rare.  Last year there were none, but NB Power sold 837 million kilowatt hours of the discounted power to industry at an average price of 4.9 cents per kwh.   

NB Power does not disclose how much of the $22 million or more in savings went to the six mills, but the price was 35 per cent below NB Power's posted rate for the plants and rivaled firm prices big mills receive anywhere in Canada, including Quebec.

Asked why the subsidy program ignores large amounts of discounted interruptible power used by New Brunswick mills in making comparisons between provinces, Brown said regulations governing the program require a comparison of firm prices only.

"The New Brunswick average rate is based on NB Power's published large industrial rate for firm energy, as required by the Electricity from Renewable Resources regulation," he wrote.

The subsidy program itself was imposed on NB Power by the province in 2012 to aid companies suffering after years of poor markets for forest products following the 2008 financial collapse and recession.  

Providing subsidies has cost NB Power $100 million so far and has continued even as markets for pulp products improved significantly and NB Power's own finances worsened.

Report warned against subsidies
NB Power has never directly criticized the program, but in a matter currently in front the of the New Brunswick Energy and Utilities Board looking at how NB Power might restructure its rates, including proposals such as seasonal rates that could prompt backlash, an independent consultant hired by the utility suggested rate subsidies to large export oriented manufacturing facilities, like pulp and paper mills, is generally a poor idea.

"We do not recommend offering subsidies to exporters," says the report by Christensen Associates Energy Consulting of Madison, Wis.

"There are two serious economic problems with subsidizing exports. The first is that the benefits may be less than the costs. The second problem is that subsidies tend to last forever, even if the circumstances that initially justified the subsidies have disappeared."

The Christensen report did not directly assess the merits of the current subsidy for pulp and paper mills but it addressed the issue because it said in the design of new rates "one NB Power business customer has raised the possibility that their electricity-intensive business ought to be granted subsidies because of the potential to generate extra benefits for the Province through increases in their exports"

That, said Christensen, rarely benefits the public.

"The direct costs of the subsidies are the subsidies themselves, a part of which ends up in the pockets of out-of-province consumers of the exported goods," said the report.  

"But there are also indirect costs due to the fact that the subsidies are financed through higher electricity prices, which means that other electricity customers have less money to spend on services provided by local businesses, thus putting a drag on the local economy."

The province does not agree.

Asked whether it has any studies or cost-benefit reviews that show the subsidy program is a net benefit to New Brunswick, the department cited none but maintained it is an important initiative, even as elsewhere governments have offered electricity bill credit relief to ratepayers.

"The program was designed to give large industrial businesses the ability to compete on a level energy field," wrote Brown.


Related News

View more

Which of the cleaner states imports dirty electricity?

Hourly Electricity Emissions Tracking maps grid balancing areas, embodied emissions, and imports/exports, revealing carbon intensity shifts across PJM, ERCOT, and California ISO, and clarifying renewable energy versus coal impacts on health and climate.


Key Points

An hourly method tracing generation, flows, and embodied emissions to quantify carbon intensity across US balancing areas.

✅ Hourly traces of imports/exports and generation mix

✅ Consumption-based carbon intensity by balancing area

✅ Policy insights for renewables, coal, health costs


In the United States, electricity generation accounts for nearly 30% of our carbon emissions. Some states have responded to that by setting aggressive renewable energy standards; others are hoping to see coal propped up even as its economics get worse. Complicating matters further is the fact that many regional grids are integrated, and as America goes electric the stakes grow, meaning power generated in one location may be exported and used in a different state entirely.

Tracking these electricity exports is critical for understanding how to lower our national carbon emissions. In addition, power from a dirty source like coal has health and environment impacts where it's produced, and the costs of these aren't always paid by the parties using the electricity. Unfortunately, getting reliable figures on how electricity is produced and where it's used is challenging, even for consumers trying to find where their electricity comes from in the first place, leaving some of the best estimates with a time resolution of only a month.

Now, three Stanford researchers—Jacques A. de Chalendar, John Taggart, and Sally M. Benson—have greatly improved on that standard, and they have managed to track power generation and use on an hourly basis. The researchers found that, of the 66 grid balancing areas within the United States, only three have carbon emissions equivalent to our national average, and they have found that imports and exports of electricity have both seasonal and daily changes. de Chalendar et al. discovered that the net results can be substantial, with imported electricity increasing California's emissions/power by 20%.

Hour by hour
To figure out the US energy trading landscape, the researchers obtained 2016 data for grid features called balancing areas. The continental US has 66 of these, providing much better spatial resolution on the data than the larger grid subdivisions. This doesn't cover everything—several balancing areas in Canada and Mexico are tied in to the US grid—and some of these balancing areas are much larger than others. The PJM grid, serving Pennsylvania, New Jersey, and Maryland, for example, is more than twice as large as Texas' ERCOT, in a state that produces and consumes the most electricity in the US.

Despite these limitations, it's possible to get hourly figures on how much electricity was generated, what was used to produce it, and whether it was used locally or exported to another balancing area. Information on the generating sources allowed the researchers to attach an emissions figure to each unit of electricity produced. Coal, for example, produces double the emissions of natural gas, which in turn produces more than an order of magnitude more carbon dioxide than the manufacturing of solar, wind, or hydro facilities. These figures were turned into what the authors call "embodied emissions" that can be traced to where they're eventually used.

Similar figures were also generated for sulfur dioxide and nitrogen oxides. Released by the burning of fossil fuels, these can both influence the global climate and produce local health problems.

Huge variation
The results were striking. "The consumption-based carbon intensity of electricity varies by almost an order of magnitude across the different regions in the US electricity system," the authors conclude. The low is the Bonneville Power grid region, which is largely supplied by hydropower; it has typical emissions below 100kg of carbon dioxide per megawatt-hour. The highest emissions come in the Ohio Valley Electric region, where emissions clear 900kg/MW-hr. Only three regional grids match the overall grid emissions intensity, although that includes the very large PJM (where capacity auction payouts recently fell), ERCOT, and Southern Co balancing areas.

Most of the low-emissions power that's exported comes from the Pacific Northwest's abundant hydropower, while the Rocky Mountains area exports electricity with the highest associated emissions. That leads to some striking asymmetries. Local generation in the hydro-rich Idaho Power Company has embodied emissions of only 71kg/MW-hr, while its imports, coming primarily from Rocky Mountain states, have a carbon content of 625kg/MW-hr.

The reliance on hydropower also makes the asymmetry seasonal. Local generation is highest in the spring as snow melts, but imports become a larger source outside this time of year. As solar and wind can also have pronounced seasonal shifts, similar changes will likely be seen as these become larger contributors to many of these regional grids. Similar things occur daily, as both demand and solar production (and, to a lesser extent, wind) have distinct daily profiles.

The Golden State
California's CISO provides another instructive case. Imports represent less than 30% of its total electric use in 2016, yet California electricity imports provided 40% of its embodied emissions. Some of these, however, come internally from California, provided by the Los Angeles Department of Water and Power. The state itself, however, has only had limited tracking of imported emissions, lumping many of its sources as "other," and has been exporting its energy policies to Western states in ways that shape regional markets.

Overall, the 2016 inventory provides a narrow picture of the US grid, as plenty of trends are rapidly changing our country's emissions profile, including the rise of renewables and the widespread adoption of efficiency measures and other utility trends in 2017 that continue to evolve. The method developed here can, however, allow for annual updates, providing us with a much better picture of trends. That could be quite valuable to track things like how the rapid rise in solar power is altering the daily production of clean power.

More significantly, it provides a basis for more informed policymaking. States that wish to promote low-emissions power can use the information here to either alter the source of their imports or to encourage the sites where they're produced to adopt more renewable power. And those states that are exporting electricity produced primarily through fossil fuels could ensure that the locations where the power is used pay a price that includes the health costs of its production.


Related News

View more

Construction of expanded Hoa Binh Hydropower Plant to start October 2020

Expanded Hoa Binh Hydropower Plant increases EVN capacity with 480MW turbines, commercial loan financing, grid stability, flood control, and Da River reliability, supported by PECC1 feasibility work and CMSC collaboration on site clearance.


Key Points

A 480MW EVN expansion on the Da River to enhance grid stability, flood control, and seasonal water supply in Vietnam.

✅ 480MW, two turbines, EVN-led financing without guarantees

✅ Improves frequency modulation and national grid stability

✅ Supports flood control and dry-season water supply


The extended Hoa Binh Hydropower Plant, which is expected to break ground in October 2020, is considered the largest power project to be constructed this year, even as Vietnam advances a mega wind project planned for 2025.

Covering an area of 99.2 hectares, the project is invested by Electricity of Vietnam (EVN). Besides, Vietnam Electricity Power Projects Management Board No.1 (EVNPMB1) is the representative of the investor and Power Engineering Consulting JSC 1 (EVNPECC1) is in charge of building the feasibility report for the project. The expanded Hoa Binh Hydro Power Plant has a total investment of VND9.22 trillion ($400.87 million), 30 per cent of which is EVN’s equity and the remaining 70 per cent comes from commercial loans without a government guarantee.

According to the initial plan, EVN will begin the construction of the project in the second quarter of this year and is expected to take the first unit into operation in the third quarter of 2023, a timeline reminiscent of Barakah Unit 1 reaching full power, and the second one in the fourth quarter of the same year.

Chairman of the Committee for Management of State Capital at Enterprises (CMSC) Nguyen Hoang Anh said that in order to start the construction in time, CMSC will co-operate with EVN to work with partners as well as local and foreign banks to mobilise capital, reflecting broader nuclear project milestones across the energy sector.

In addition, EVN will co-operate with Hoa Binh People’s Committee to implement site clearance, remove Ba Cap port and select contractors.

Once completed, the project will contribute to preventing floods in the rainy season and supply water in the dry season. The plant expansion will include two turbines with the total capacity of 480MW, similar in scale to the 525-MW hydropower station China is building on a Yangtze tributary, and electricity output of about 488.3 million kWh per year.

In addition, it will help improve frequency modulation capability and stabilise the frequency of the national electricity system through approaches like pumped storage capacity, and reduce the working intensity of available turbines of the plant, thus prolonging the life of the equipment and saving maintenance and repair costs.

Built in the Da River basin in the northern mountainous province of Hoa Binh, at the time of its conception in 1979, Hoa Binh was the largest hydropower plant in Southeast Asia, while projects such as China’s Lawa hydropower station now dwarf earlier benchmarks.

The construction was supported by the Soviet Union all the way through, designing, supplying equipment, supervising, and helping it go on stream. Construction began in November 1979 and was completed 15 years later in December 1994, when it was officially commissioned, similar to two new BC generating stations recently brought online.


Related News

View more

Sign Up for Electricity Forum’s Newsletter

Stay informed with our FREE Newsletter — get the latest news, breakthrough technologies, and expert insights, delivered straight to your inbox.

Electricity Today T&D Magazine Subscribe for FREE

Stay informed with the latest T&D policies and technologies.
  • Timely insights from industry experts
  • Practical solutions T&D engineers
  • Free access to every issue

Live Online & In-person Group Training

Advantages To Instructor-Led Training – Instructor-Led Course, Customized Training, Multiple Locations, Economical, CEU Credits, Course Discounts.

Request For Quotation

Whether you would prefer Live Online or In-Person instruction, our electrical training courses can be tailored to meet your company's specific requirements and delivered to your employees in one location or at various locations.