Plug-in power a key to cleaner air

By Vancouver Sun


CSA Z463 Electrical Maintenance

Our customized live online or in‑person group training can be delivered to your staff at your location.

  • Live Online
  • 6 hours Instructor-led
  • Group Training Available
Regular Price:
$249
Coupon Price:
$199
Reserve Your Seat Today
Cruise ships may soon be able to cut their engines and plug into the BC Hydro grid when they're docked at Canada Place.

A proposal going to the Metro Vancouver environment and energy committee would make "port electrification" a priority for the region due to ongoing concerns about the effect of ship diesel emissions on local air quality and human health.

At present, seagoing vessels including cruise, container and other cargo ships keep their engines running in port in order to generate electrical power for on-board lights and other systems.

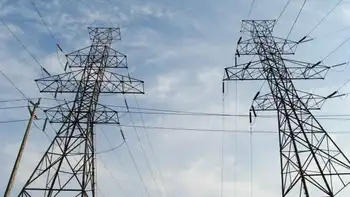
Collectively, ship exhaust emissions comprise one of the biggest sources of air pollution in the Metro-Fraser Valley region — port electrification would allow marine vessels to switch off their engines and plug into the grid instead.

The biggest snag is an absence of federal dollars — $4 million is needed to bolster contributions from the Metro Vancouver port authority, the region, the marine industry and the province.

Port Metro Vancouver hopes to see cruise ships plugged in for the 2009 summer season - Holland America and Princess Cruises already have plug-in ships plying the west coast.

Metro committee chair Joe Trasolini noted that with a federal election underway, it's an opportune time for the locals to lock in a commitment for the cash.

"I've been harping at this for three years, but it seems to be an opportune time now," said Trasolini, who will be standing for reelection as mayor of Port Moody in November's municipal elections.

"We are doing a lot to try to reduce greenhouse gas emissions and particulate matter emissions and so on, all of the things that affect the airshed. Yet there was one area where we saw exponential growth with nothing to abate it. That was emissions originating from marine vessels," Trasolini said in an interview.

"The objective is to have onshore power right across the Metro Vancouver port — but as a first step we have to power up the cruise ship industry, who seem to be more in the public eye and more willing to comply with our requests."

John Hansen, president of the NorthWest CruiseShip Association noted that the first shore plug terminal on the west coast was established at Juno, Alaska, in 2002.

"Since then Seattle has provided shore power plug in for two of their three berths. Holland America and Princess Cruise ships are able to plug-in in Seattle.

"We are certainly aware that there's a lot of interest in California, in Long Beach, in San Pedro, in San Francisco and San Diego to follow suit.

"We're certainly excited about the prospect of having that capability in Vancouver as well."

Hansen said that if you discount the capital investment needed to install a transformer on a ship in order to plug into the grid, the cost of electricity from shore power and diesel generation is roughly equal.

Darryl Desjardins, environmental programs director for Port Metro Vancouver said the port hopes that within 15 years, the capital stock rollover among international shipping lines will lead to all ships coming into the Vancouver port with the capability to plug into the grid.

"In the inner harbour, the Vanterm and Centerm container terminals already have the infrastructure in place to allow for the electrical wiring to go to the dockside, and when the Deltaport third berth project is complete at Roberts Bank, that will also have the infrastructure in place for shore power," Desjardins said in an interview.

He said the port is also looking at projects such as wind and tidal power generation to produce enough electricity to feed ships without drawing on the BC Hydro grid.

The port authority has applied formally to BC Hydro for an interconnecting service, and Hydro must obtain consent from the B.C. Utilities Commission in order to develop a pricing scheme for the seagoing customers.

Hydro spokeswoman Susan Danard said that the power would be provided to ships on an "interruptible" basis — in other words, Hydro will reserve the ability to cut their supply if demand spikes from their regular customers.

Related News

Basin Electric and Clenera Renewable Energy Announce Power Purchase Agreement for Montana Solar Project

Cabin Creek Solar Project Montana delivers 150 MW of utility-scale solar under a Power Purchase Agreement, with Basin Electric and Clenera supplying renewable energy, enhancing grid reliability, and reducing carbon emissions for 30,000 homes.


Key Points

A 150 MW solar PPA near Baker by Basin Electric and Clenera, delivering reliable renewable power and carbon reduction.

✅ 150 MW across two 75 MW sites near Baker, Montana

✅ PPA supports Basin Electric's diverse, cost-effective portfolio

✅ Cuts 265,000 tons CO2 and powers 30,000 homes


A new solar project in Montana will provide another 150 megawatts (MW) of affordable, renewable power to Basin Electric customers and co-op members across the region.

Basin Electric Power Cooperative (Basin Electric) and Clenera Renewable Energy, announced today the execution of a Power Purchase Agreement (PPA) for the Cabin Creek Solar Project. Cabin Creek is Basin Electric's second solar PPA, and the result of the cooperative's continuing goal of providing a diverse mix of energy sources that are cost-effective for its members.

When completed, Cabin Creek will consist of two, 75-MW projects in southeastern Montana, five miles west of Baker. According to Clenera, the project will eliminate 265,000 tons of carbon dioxide per year and power 30,000 homes, while communities such as the Ermineskin First Nation advance their own generation efforts.

"Renewable technology has advanced dramatically in recent years, with rapid growth in Alberta underscoring broader trends, which means even more affordable power for Basin Electric's customers," said Paul Sukut, CEO and general manager of Basin Electric. "Basin Electric is excited to purchase the output from this project to help serve our members' growing energy needs. Adding solar further promotes our all-of-the-above energy solution as we generate energy using a diverse resource portfolio including coal, natural gas, and other renewable resources to provide reliable, affordable, and environmentally safe generation.

"Clenera is proud to partner with Basin Electric Power Cooperative to support the construction of the Cabin Creek Solar projects in Montana," said Jared McKee, Clenera's director of Business Development. "We truly believe that Basin Electric will be a valuable partner as we aim to deliver today's new era of reliable, battery storage increasingly enabling round-the-clock service, affordable, and clean energy."

"We're pleased that Southeast Electric will be home to the Cabin Creek Solar Project," said Jack Hamblin, manager of Southeast Electric Cooperative, a Basin Electric Class C member headquartered in Ekalaka, Montana. "This project is one more example of cooperatives working together to use economies of scale to add affordable generation for all their members - similar to what was done 70 years ago when cooperatives were first built."

Basin Electric Class A member Upper Missouri Power Cooperative, headquartered in Sidney, Montana, provides wholesale power to Southeast Electric and 10 other distribution cooperatives in western North Dakota and eastern Montana. "It is encouraging to witness the development of cost-competitive energy, including projects in Alberta contracted at lower cost than natural gas that demonstrate market shifts, like the Cabin Creek Solar Project, which will be part of the energy mix we purchase from Basin Electric for our member systems, said Claire Vigesaa, Upper Missouri's general manager. "The energy needs in our region are growing and this project will help us serve both our members, and our communities as a whole."

Cabin Creek will bring significant economic benefits to the local area. According to Clenera, the project will contribute $8 million in property taxes to Fallon County and $5 million for the state of Montana over 35 years. They say it will also create approximately 300 construction jobs and two to three full-time jobs.

"This project underscores the efforts by Montana's electric cooperatives to continue to embrace more carbon-free technology," said Gary Wiens, CEO of Montana Electric Cooperatives' Association. "It also demonstrates Basin Electric's commitment to seek development of renewable energy projects in our state. It's exciting that these two projects combined are 50 times larger than our current largest solar array in Montana."

Cabin Creek is anticipated to begin operations in late 2023.


Related News

View more

Spain's power demand in April plummets under COVID-19 lockdown

Spain Electricity Demand April 2020 saw a 17.3% year-on-year drop as COVID-19 lockdown curbed activity; renewables and wind power lifted the emission-free share, while combined cycle plants dominated islands, per REE data.


Key Points

A 17.3% y/y decline amid COVID-19 lockdown, with 47.9% renewables and wind at 21.3% of the national power mix.

✅ Mainland demand -17%; Balearic -27.6%; Canary -20.3%.

✅ Emission-free share: 49.7% on the peninsula in April.

✅ Combined cycle led islands; coal absent in Balearics.


Demand for electricity in Spain dropped by 17.3% year-on-year to an estimated 17,104 GWh in April, aligning with a 15% global daily demand dip during the pandemic, while the country’s economy slowed down under the national state of emergency and lockdown measures imposed to curb the spread of COVID-19.

According to the latest estimates by Spanish grid operator Red Electrica de Espana (REE), the decline in demand was registered across Spain’s entire national territory, similar to a 10% UK drop during lockdown. On the mainland, it decreased by 17% to 16,191 GWh, while on the Balearic and the Canary Islands it plunged by 27.6% and 20.3%, respectively.

Renewables accounted for 47.9% of the total national electricity production in April, echoing Britain’s cleanest electricity trends during lockdown. Wind power production went down 20% year-on-year to 3,730 GWh, representing a 21.3% share in the total power mix.

During April, electricity generation in the peninsula was mostly based on emission-free technologies, reflecting an accelerated power-system transition across Europe, with renewables accounting for 49.7%. Wind farms produced 3,672 GWh, 20.1% less compared to April 2019, while contributing 22% to the power mix, even as global demand later surpassed pre-pandemic levels in subsequent periods.

In the Balearic Islands, electricity demand of 323,296 MWh was for the most part met by combined cycle power plants, even as some European demand held firm in later lockdowns, which accounted for 78.3% of the generation. Renewables and emission-free technologies had a combined share of 6.4%, while coal was again absent from the local power mix, completing now four consecutive months without contributing a single MWh.

In the Canary Islands system, demand for power decreased to 558,619 MWh, even as surging demand elsewhere strained power systems across the world. Renewables and emission-free technologies made up 14.3% of the mix, while combined cycle power plants led with a 45.3% share.


Related News

View more

Saudis set to 'boost wind by over 6GW'

Saudi Arabia Wind Power Market set to lead the Middle East, driven by Vision 2030 renewables goals, REPDO tenders, and PIF backing, adding 6.2GW wind capacity by 2028 alongside solar PV diversification.


Key Points

It is the emerging national segment leading Middle East wind growth, targeting 6.2GW by 2028 under Vision 2030 policies.

✅ Adds 6.2GW, 46% of regional wind capacity by 2028

✅ REPDO tenders and PIF funding underpin pipeline

✅ Targets: 16GW wind, 40GW solar under Vision 2030


Saudi Arabia will become a regional heavyweight in the Middle East's wind power market adding over 6GW in the next 10 years, according to new research by Wood Mackenzie Power & Renewables.

The report – 'Middle East Wind Power Market Outlook, 2019-2028’ – said developers will build 6.2GW of wind capacity in the country or 46% of the region’s total wind capacity additions between 2019 and 2028.

Wood Mackenzie Power & Renewables senior analyst Sohaib Malik said: “The integration of renewables in Vision 2030’s objectives underlines strong political commitment within Saudi Arabia.

“The level of Saudi ambition for wind and solar PV varies significantly, despite the cost parity between both technologies during the first round of tenders in 2018.”

Saudi Arabia has set a 16GW target for wind by 2030 and 40GW for solar, plans to solicit 60 GW of clean energy over the next decade, Wood Mackenzie added.

“Moving forward, the Renewable Energy Project Development Office will award 850MW of wind capacity in 2019, which is expected to be commissioned in 2021-2022, and increase the local content requirement in future tendering rounds,” Malik said.

However, Saudi Arabia will fall short of its current 2030 renewables target, despite growth projections and regional leadership, the report said.

Some 70% of the renewables capacity target is to be supported by the Public Investment Fund (PIF), the Saudi sovereign wealth fund, while the remaining capacity is to be awarded through REPDO.

“A central concern is the PIF’s lack of track record in the renewables sector and its limited in-house sectoral expertise,” said Malik

“REPDO, on the other hand, completed two renewables request for proposals after pre-developing the sites,” he said.

PIF is estimated to have $230bn of assets – targeted to reach $2 trillion under Vision 2030 – driven by investments in a variety of sectors ranging from electric vehicles to public infrastructure, Wood Mackenzie said.

“There is little doubt about the fund’s financial muscle, however, its past investment strategy focused on established firms in traditional industries,” Malik added.

“Aspirations to develop a value chain for wind and PV technologies locally is a different ball game and requires the PIF to acquire new capabilities for effective oversight of these ventures,” he said.

The report noted that regional volatility is expected to remain, with strong positive growth, driven by Jordan and Iran in 2018 expected to reverse in 2019, and policy shifts, as in Canada’s scaled-back projections, can influence outcomes.

Post-2020 Wood Mackenzie Power & Renewables sees regional demand returning to steady growth as global renewables set more records elsewhere.

“In 2018, developers added 185MW and 63MW of wind capacity in Jordan and Iran, respectively, compared to 53MW of capacity across the entire region in 2017, following a record year for renewables in 2016,” said Malik.

“The completion of the 89MW Al Fujeij and the 86MW Al Rajef projects in 2018 indicates that Jordan has 375MW of the region’s operational 675MW wind capacity.

“Iran followed with 278MW of installed capacity at the end of 2018. A slowdown in 2019 is expected, as project development activity softens in Iran.

“Additionally, delays in awarding the 400MW Dumat Al Jandal project in Saudi Arabia will limit annual capacity additions to 184MW.”

He added that a maturing project pipeline in the region supports the 2020-2021 outlook, even as wind power grew despite Covid-19 globally.

“Saudi Arabian demand serves as the foundation for regional demand. Regional demand diversification is also occurring, with Lebanon set to add 200-400MW to its existing permitted capacity pipeline of 202MW in 2019,” he said

“These developments pave the way for the addition of 2GW of wind capacity between 2019 and 2021.”

Wood Mackenzie Power & Renewables added that the outlook for solar in the region is “much more positive” than wind.

“Compared to only 6GW of wind power capacity, developers will add 53GW of PV capacity through 2024,” said Malik.

He added: “Solar PV, supported by trends such as China’s rapid PV growth in 2016, has become a natural choice for many countries in the region, which is endowed with world class solar energy resources.

“The increased focus on solar energy is demonstrated by ambitious PV targets across the region.”


Related News

View more

Hydro-Québec puts global ambitions on hold as crisis weighs on demand

Hydro-Que9bec COVID-19 M&A Pause signals a halt to international expansion as falling electricity demand, weaker exports, and revenue pressure shift capital to the Quebec economy, prioritizing domestic investment, strategic plan revisions, and risk management.


Key Points

Hydro-Que9bec COVID-19 M&A Pause halts overseas deals, shifting investment to Quebec as demand, exports and revenue fall.

✅ International M&A on hold; capital reallocated to Quebec projects

✅ Lower electricity demand reduces exports and spot prices

✅ Strategic plan and 2020 guidance revised downward


COVID-19 is forcing Hydro-Québec to pull the plug on its global ambitions — for now, even as its electricity ambitions have reopened old wounds in Newfoundland and Labrador in recent years.

Quebec’s state-owned power generator and distributor has put international mergers and acquisitions on hold for the foreseeable future because of the COVID-19 crisis, chief financial officer Jean-Hugues Lafleur said Friday.

Former chief executive officer Éric Martel, who left last month, had made foreign expansion a key tenet of his growth strategy.

“We’re in revision mode” as pertains to acquisitions, Lafleur told reporters on a conference call, as the company pursues a long-term strategy to wean the province off fossil fuels at home as well. “I don’t see how Hydro-Québec could take $5 billion now and invest it in Chile because we have an investment opportunity there. Instead, the $5 billion will be invested here to support the Quebec economy. We’re going to make sure the Quebec economy recovers the right way before we go abroad.”

Lafleur spoke after Hydro-Québec reported a 14-per-cent drop in first-quarter profit and warned full-year results will fall short of expectations as COVID-19 weighs on power demand.

Net income in the three-month period ended March 31 was $1.53 billion, down from $1.77 billion a year ago, Hydro-Québec said in a statement. Revenue fell about six per cent to $4.37 billion.

“Due to the economic downturn resulting from the current crisis, we’re anticipating lower electricity sales in all of our markets,” Lafleur said. “Consequently, the financial outlook for 2020 set out in the strategic plan 2020–2024, which also reflects the province’s no-nuclear stance, will be revised downward.”

It’s still too early to determine the scope of the revision, the company said in its quarterly report. Hydro-Québec was targeting net income of between $2.8 billion and $3 billion in 2020, according to its strategic plan.

The first quarter was the utility’s last under Martel, who quit to take over at jetmaker Bombardier Inc. Quebec appointed former Énergir CEO Sophie Brochu to replace him, effective April 6.

First-quarter results “weren’t significantly affected” by the pandemic, Lafleur said on a conference call with reporters. Electricity sales generated $294 million less than a year ago due primarily to milder temperatures, he said.

Results will start to reflect COVID-19’s impact in the second quarter, though NB Power has signed three deals to bring more Quebec electricity into the province that could cushion some exports.

Electricity consumption in Quebec has fallen five per cent in the past two months, paced by an 11-per-cent plunge for commercial and institutional clients, and cities such as Ottawa saw a demand plunge during closures.

Industrial customers such as pulp and paper producers have also curbed power use, and it’s hard to see demand rebounding this year, Lafleur said.

“What we’ve lost since the start of the pandemic is not coming back,” he said.

Demand on export markets, meanwhile, has shrunk between six per cent and nine per cent since mid-March. The drop has been particularly steep in Ontario, reaching as much as 12 per cent, after the province chose not to renew its electricity deal with Quebec earlier this year, compared with declines of up to five per cent in New England and eight per cent in New York.

Spot prices in the U.S. have retreated in tandem, falling this week to as low as 1.5 U.S. cents per kilowatt-hour, Lafleur said. Hydro-Québec’s hedging strategy — which involves entering into fixed-price sales contracts about a year ahead of time — allowed the company to export power for an average of 4.9 U.S. cents per kilowatt-hour in the first quarter, compared with the 2.2 cents it would have otherwise made.

Investments will decline this year as construction activity proceeds at reduced speed, Lafleur said. Hydro-Québec was initially planning to invest about $4 billion in the province, he said, as it works to increase hydropower capacity to more than 37,000 MW across its fleet.

Physical distancing measures “are having an impact on productivity,” Lafleur said. “We can’t work the way we wanted, and project costs are going to be affected. Anytime we send workers north on a plane, we need to leave an empty seat beside them.”


Related News

View more

Duke Energy reaffirms capital investments in renewables and grid projects to deliver cleaner energy, economic growth

Duke Energy Clean Energy Strategy advances renewables, battery storage, grid modernization, and energy efficiency to cut carbon, retire coal, and target net-zero by 2050 across the Carolinas with robust IRPs and capital investments.


Key Points

Plan to expand renewables, storage, and grid upgrades to cut carbon and reach net-zero electricity by 2050.

✅ 56B investment in renewables, storage, and grid modernization

✅ Targets 50% carbon reduction by 2030 and net-zero by 2050

✅ Retires coal units; expands energy efficiency and IRPs


Duke Energy says that the company will continue advancing its ambitious clean energy goals without the Atlantic Coast Pipeline (ACP) by investing in renewables, battery storage, energy efficiency programs and grid projects that support U.S. electrification efforts.

Duke Energy, the nation's largest electric utility, unveils its new logo. (PRNewsFoto/Duke Energy) (PRNewsfoto/Duke Energy)

Duke Energy's $56 billion capital investment plan will deliver significant customer benefits and create jobs at a time when policymakers at all levels are looking for ways to rebuild the economy in 2020 and beyond. These investments will deliver cleaner energy for customers and communities while enhancing the energy grid to provide greater reliability and resiliency.

"Sustainability and the reduction of carbon emissions are closely tied to our region's success," said Lynn Good, Duke Energy Chair, President and CEO. "In our recent Climate Report, we shared a vision of a cleaner electricity future with an increasing focus on renewables and battery storage in addition to a diverse mix of zero-carbon nuclear, natural gas, hydro and energy efficiency programs.

"Achieving this clean energy vision will require all of us working together to develop a plan that is smart, equitable and ensures the reliability and affordability that will spur economic growth in the region. While we're disappointed that we're not able to move forward with ACP, we will continue exploring ways to help our customers and communities, particularly in eastern North Carolina where the need is great," said Good.

Already a clean-energy leader, Duke Energy has reduced its carbon emissions by 39% from 2005 and remains on track to cut its carbon emissions by at least 50% by 2030, as peers like Alliant's carbon-neutral plan demonstrate broader industry momentum toward decarbonization. The company also has an ambitious clean energy goal of reaching net-zero emissions from electricity generation by 2050. 

In September 2020, Duke Energy plans to file its Integrated Resource Plans (IRP) for the Carolinas after an extensive process of working with the state's leaders, policymakers, customers and other stakeholders. The IRPs will include multiple scenarios to support a path to a cleaner energy future in the Carolinas, reflecting key utility trends shaping resource planning.

Since 2010, Duke Energy has retired 51 coal units totaling more than 6,500 megawatts (MW) and plans to retire at least an additional 900 MW by the end of 2024. In 2019, the company proposed to shorten the book lives of another approximately 7,700 MW of coal capacity in North Carolina and Indiana.

Duke Energy will host an analyst call in early August 2020 to discuss second quarter 2020 financial results and other business and financial updates. The company will also host its inaugural Environmental, Social and Governance (ESG) investor day in October 2020.


Duke Energy

Duke Energy is transforming its customers' experience, modernizing the energy grid, generating cleaner energy and expanding natural gas infrastructure to create a smarter energy future for the people and communities it serves. The Electric Utilities and Infrastructure unit's regulated utilities serve 7.8 million retail electric customers in six states: North Carolina, South Carolina, Florida, Indiana, Ohio and Kentucky. The Gas Utilities and Infrastructure unit distributes natural gas to 1.6 million customers in five states: North Carolina, South Carolina, Tennessee, Ohio and Kentucky. The Duke Energy Renewables unit operates wind and solar generation facilities across the U.S., as well as energy storage and microgrid projects.

Duke Energy was named to Fortune's 2020 "World's Most Admired Companies" list and Forbes' "America's Best Employers" list. More information about the company is available at duke-energy.com. The Duke Energy News Center contains news releases, fact sheets, photos, videos and other materials. Duke Energy's illumination features stories about people, innovations, community topics and environmental issues. Follow Duke Energy on Twitter, LinkedIn, Instagram and Facebook.


Forward-Looking Information

This document includes forward-looking statements within the meaning of Section 27A of the Securities Act of 1933 and Section 21E of the Securities Exchange Act of 1934. Forward-looking statements are based on management's beliefs and assumptions and can often be identified by terms and phrases that include "anticipate," "believe," "intend," "estimate," "expect," "continue," "should," "could," "may," "plan," "project," "predict," "will," "potential," "forecast," "target," "guidance," "outlook" or other similar terminology. Various factors may cause actual results to be materially different than the suggested outcomes within forward-looking statements; accordingly, there is no assurance that such results will be realized. These factors include, but are not limited to:

  • The impact of the COVID-19 electricity demand shift on operations and revenues;
  • State, federal and foreign legislative and regulatory initiatives, including costs of compliance with existing and future environmental requirements, including those related to climate change, as well as rulings that affect cost and investment recovery or have an impact on rate structures or market prices;
  • The extent and timing of costs and liabilities to comply with federal and state laws, regulations and legal requirements related to coal ash remediation, including amounts for required closure of certain ash impoundments, are uncertain and difficult to estimate;
  • The ability to recover eligible costs, including amounts associated with coal ash impoundment retirement obligations and costs related to significant weather events, and to earn an adequate return on investment through rate case proceedings and the regulatory process;
  • The costs of decommissioning nuclear facilities could prove to be more extensive than amounts estimated and all costs may not be fully recoverable through the regulatory process;
  • Costs and effects of legal and administrative proceedings, settlements, investigations and claims;
  • Industrial, commercial and residential growth or decline in service territories or customer bases resulting from sustained downturns of the economy and the economic health of our service territories or variations in customer usage patterns, including energy efficiency and demand response efforts and use of alternative energy sources, such as self-generation and distributed generation technologies;
  • Federal and state regulations, laws and other efforts designed to promote and expand the use of energy efficiency measures and distributed generation technologies, such as private solar and battery storage, in Duke Energy service territories could result in customers leaving the electric distribution system, excess generation resources as well as stranded costs;
  • Advancements in technology;
  • Additional competition in electric and natural gas markets and continued industry consolidation;
  • The influence of weather and other natural phenomena on operations, including the economic, operational and other effects of severe storms, hurricanes, droughts, earthquakes and tornadoes, including extreme weather associated with climate change;
  • The ability to successfully operate electric generating facilities and deliver electricity to customers including direct or indirect effects to the company resulting from an incident that affects the U.S. electric grid or generating resources;
  • The ability to obtain the necessary permits and approvals and to complete necessary or desirable pipeline expansion or infrastructure projects in our natural gas business;
  • Operational interruptions to our natural gas distribution and transmission activities;
  • The availability of adequate interstate pipeline transportation capacity and natural gas supply;
  • The impact on facilities and business from a terrorist attack, cybersecurity threats, data security breaches, operational accidents, information technology failures or other catastrophic events, such as fires, explosions, pandemic health events or other similar occurrences;
  • The inherent risks associated with the operation of nuclear facilities, including environmental, health, safety, regulatory and financial risks, including the financial stability of third-party service providers;
  • The timing and extent of changes in commodity prices and interest rates and the ability to recover such costs through the regulatory process, where appropriate, and their impact on liquidity positions and the value of underlying assets;
  • The results of financing efforts, including the ability to obtain financing on favorable terms, which can be affected by various factors, including credit ratings, interest rate fluctuations, compliance with debt covenants and conditions and general market and economic conditions;
  • Credit ratings of the Duke Energy Registrants may be different from what is expected;
  • Declines in the market prices of equity and fixed-income securities and resultant cash funding requirements for defined benefit pension plans, other post-retirement benefit plans and nuclear decommissioning trust funds;
  • Construction and development risks associated with the completion of the Duke Energy Registrants' capital investment projects, including risks related to financing, obtaining and complying with terms of permits, meeting construction budgets and schedules and satisfying operating and environmental performance standards, as well as the ability to recover costs from customers in a timely manner, or at all;
  • Changes in rules for regional transmission organizations, including FERC debates on coal and nuclear subsidies and new and evolving capacity markets, and risks related to obligations created by the default of other participants;
  • The ability to control operation and maintenance costs;
  • The level of creditworthiness of counterparties to transactions;
  • The ability to obtain adequate insurance at acceptable costs;
  • Employee workforce factors, including the potential inability to attract and retain key personnel;
  • The ability of subsidiaries to pay dividends or distributions to Duke Energy Corporation holding company (the Parent);
  • The performance of projects undertaken by our nonregulated businesses and the success of efforts to invest in and develop new opportunities;
  • The effect of accounting pronouncements issued periodically by accounting standard-setting bodies;
  • The impact of U.S. tax legislation to our financial condition, results of operations or cash flows and our credit ratings;
  • The impacts from potential impairments of goodwill or equity method investment carrying values; and
  • The ability to implement our business strategy, including enhancing existing technology systems.
  • Additional risks and uncertainties are identified and discussed in the Duke Energy Registrants' reports filed with the SEC and available at the SEC's website at sec.gov. In light of these risks, uncertainties and assumptions, the events described in the forward-looking statements might not occur or might occur to a different extent or at a different time than described. Forward-looking statements speak only as of the date they are made and the Duke Energy Registrants expressly disclaim an obligation to publicly update or revise any forward-looking statements, whether as a result of new information, future events or otherwise.


Related News

View more

During this Pandemic, Save Money - How To Better Understand Your Electricity Bill

Commercial Electric Tariffs explain utility rate structures, peak demand charges, kWh vs kW pricing, time-of-use periods, voltage, delivery, capacity ratchets, and riders, guiding facility managers in tariff analysis for accurate energy savings.


Key Points

Commercial electric tariffs define utility pricing for energy, demand, delivery, time-of-use periods, riders, and ratchet charges.

✅ Separate kWh charges from kW peak demand fees.

✅ Verify time-of-use windows and demand interval length.

✅ Review riders, capacity ratchets, and minimum demand clauses.


Especially during these tough economic times, as major changes to electric bills are debated in some states, facility executives who don’t understand how their power is priced have been disappointed when their energy projects failed to produce expected dollar savings. Here’s how not to be one of them.

Your electric rate is spelled out in a document called a “tariff” that can be downloaded from your utility’s web page. A tariff should clearly spell out the costs for each component that is part of your rate, reflecting cost allocation practices in your region. Don’t be surprised to learn that it contains a bunch of them. Unlike residential electric rates, commercial electric bills are not based solely on the quantity of kilowatt-hours (kWh) consumed in a billing period (in the United States, that’s a month). Instead, different rates may apply to how your power is supplied, how it is delivered via electricity delivery charges, when it was consumed, its voltage, how fast it was used (in kW), and other factors.

If a tariff’s lingo and word structure are too opaque, spend some time with a utility account rep to translate it. Many state utility commissions also have customer advocates that may assist as they explore new utility rate designs that affect customers. Alternatively, for a fee, facility managers can privately chat with an energy consultant.

Common mistakes

Many facility managers try to estimate savings based on an averaged electric rate, i.e., annual electric spend divided by annual kWh. However, in markets where electricity demand is flat, such a number may obscure the fastest rising cost component: monthly peak demand charges, measured in dollars per kW (or kilo-volt-amperes, kVA).

This charge is like a monthly speeding ticket, based solely on the highest speed you drove during that time. In some areas, peak demand charges now account for 30 to 60 percent of a facility’s annual electric spend. When projecting energy cost savings, failing to separately account for kW peak demand and kWh consumption may result in erroneous results, and a lot of questions from the C-suite.

How peak demand charges are calculated varies among utilities. Some base it on the highest average speed of use across one hour in a month, while others may use the highest average speed during a 15- or 30-minute period. Others may average several of the highest speeds within a defined time period (for example, 8 a.m. to 6 p.m. on weekdays). It is whatever your tariff says it is.

Because some power-consuming (or producing) devices, including those tied to smart home electricity networks, vary in their operation or abilities, they may save money on a few — but not all — of those rate components. If an equipment vendor calculates savings from its product by using an average electric rate, take pause. Tell the vendor to return after the proposal has been redone using tariff-based numbers.

When a vendor is the only person calculating potential savings from using a product, there’s also a built-in conflict of interest: The person profiting from an equipment sale should not also be the one calculating its expected financial return. Before signing any energy project contracts, it’s essential that someone independent of the deal reviews projected savings. That person (typically an energy or engineering consultant) should be quite familiar with your facility’s electric tariff, including any special provisions, riders, discounts, etc., that may pertain. When this doesn’t happen, savings often don’t occur as planned. 

For example, some utilities add another form of demand charge, based on the highest kW in a year. It has various names: capacity, contract demand, or the generic term “ratchet charge.” Some utilities also have a minimum ratchet charge which may be based on a percent of a facility’s annual kW peak. It ensures collection of sufficient utility revenue to cover the cost of installed transmission and distribution even when a customer significantly cuts its peak demand.


Related News

View more

Sign Up for Electricity Forum’s Newsletter

Stay informed with our FREE Newsletter — get the latest news, breakthrough technologies, and expert insights, delivered straight to your inbox.

Electricity Today T&D Magazine Subscribe for FREE

Stay informed with the latest T&D policies and technologies.
  • Timely insights from industry experts
  • Practical solutions T&D engineers
  • Free access to every issue

Live Online & In-person Group Training

Advantages To Instructor-Led Training – Instructor-Led Course, Customized Training, Multiple Locations, Economical, CEU Credits, Course Discounts.

Request For Quotation

Whether you would prefer Live Online or In-Person instruction, our electrical training courses can be tailored to meet your company's specific requirements and delivered to your employees in one location or at various locations.