Paraguay looks to renegotiate Brazil energy deal

By San Francisco Chronicle


High Voltage Maintenance Training Online

Our customized live online or in‑person group training can be delivered to your staff at your location.

  • Live Online
  • 12 hours Instructor-led
  • Group Training Available
Regular Price:
$599
Coupon Price:
$499
Reserve Your Seat Today
Paraguay's new President Fernando Lugo visited Brazil with one goal: launching talks to earn his poor country more money from a dam on the nations' shared border, the largest hydroelectric project in the world.

Brazil has resisted new terms for distributing electricity and profit from the Itaipu dam, established by a 1970s-era treaty between the neighboring countries. But Lugo said Brazilian President Luiz Inacio Lula da Silva is willing to debate the issue.

"Who said you can't change a treaty?" Lugo told reporters in Sao Paulo before heading to Brasilia to meet Silva. "You can change anything when there's a will, when (the current situation) doesn't fit the challenges of the modern world."

After meeting for three hours, Lugo and Silva ordered high-ranking officials to discuss Paraguay's complaints soon. Brazilian Foreign minister Celso Amorim told reporters that Brazil won't change the terms of the treaty, but is open to "creative solutions" he did not describe in detail.

The treaty now gives each nation half the electricity the dam generates. Paraguay, whose population is less than 4 percent the size of Brazil's, sells most of its share back to Brazil for US$100 million a year — ensuring that the dam provides 20 percent of electric power consumed by Latin America's largest economy.

Lugo's leftist administration, which took office last month ending 61 years of one-party conservative rule, wants to increase those charges by as much as US$2 billion a year.

Brazil — which sorely needs all the energy it can get to fuel its booming economy — financed the dam's entire construction, spending US$12.2 billion. Still, most Paraguayans think they should charge market prices for its electricity, or be allowed to sell it to other nations at a higher cost.

The treaty, signed in 1973 when dictators ruled both countries, expires in 2023. Both nations can agree to modify it, but Brazilian officials have insisted they won't.

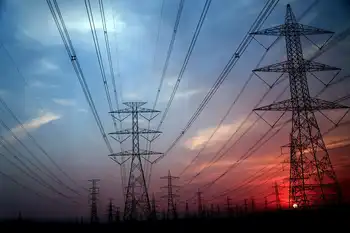
The Itaipu dam has been the world's top hydroelectric producer since it started operating in 1980, although it will lose that distinction next year when China's Three Gorges dam begins generating power.

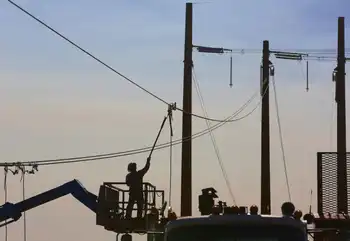
Paraguay has 6.7 million citizens compared to Brazil's nearly 190 million, and would never be able to use the excess energy now flowing to Brazil. The landlocked, mostly rural country even lacks transmission lines to boost consumption, which has stalled economic growth. Brazil offered a US$200 million loan to build that infrastructure, but many Paraguayans dismissed that gesture as an insult.

Lugo refused to say whether he shared his countrymen's sentiment, saying such discussion would start negotiations with Silva out on the wrong foot.

One of Lugo's political rivals, retired Paraguayan Gen. Lino Cesar Oviedo, was quick to criticize Lugo's trip. The president "is wasting his time because Brazil has already announced it won't renegotiate the treaty," Oviedo said.

Related News

Canada's looming power problem is massive but not insurmountable: report

Canada Net-Zero Electricity Buildout will double or triple power capacity, scaling clean energy, renewables, nuclear, hydro, and grid transmission, with faster permitting, Indigenous consultation, and trillions in investment to meet 2035 non-emitting regulations.


Key Points

A national plan to rapidly expand clean, non-emitting power and grid capacity to enable a net-zero economy by 2050.

✅ Double to triple generation; all sources non-emitting by 2035

✅ Accelerate permitting, transmission, and Indigenous partnerships

✅ Trillions in investment; cross-jurisdictional coordination


Canada must build more electricity generation in the next 25 years than it has over the last century in order to support a net-zero emissions economy by 2050, says a new report from the Public Policy Forum.

Reducing our reliance on fossil fuels and shifting to emissions-free electricity, as provinces such as Ontario pursue new wind and solar to ease a supply crunch, to propel our cars, heat our homes and run our factories will require doubling — possibly tripling — the amount of power we make now, the federal government estimates.

"Imagine every dam, turbine, nuclear plant and solar panel across Canada and then picture a couple more next to them," said the report, which will be published Wednesday.

It's going to cost a lot, and in Ontario, greening the grid could cost $400 billion according to one report. Most estimates are in the trillions.

It's also going to require the kind of cross-jurisdictional co-operation, with lessons from Europe's power crisis underscoring the stakes, Indigenous consultation and swift decision-making and construction that Canada just isn't very good at, the report said.

"We have a date with destiny," said Edward Greenspon, president of the Public Policy Forum. "We need to build, build, build. We're way behind where we need to be and we don't have a lot of a lot of time remaining."

Later this summer, Environment Minister Steven Guilbeault will publish new regulations to require that all power be generated from non-emitting sources by 2035 clean electricity goals, as proposed.

Greenspon said that means there are two major challenges ahead: massively expanding how much power we make and making all of it clean, even though some natural gas generation will be permitted under federal rules.

On average, it takes more than four years just to get a new electricity generating project approved by Ottawa, and more than three years for new transmission lines.

That's before a single shovel touches any dirt.

Building these facilities is another thing, and provinces such as Ontario face looming electricity shortfalls as projects drag on. The Site C dam in British Columbia won't come on line until 2025 and has been under construction since 2015. A new transmission line from northern Manitoba to the south took more than 11 years from the first proposal to operation.

"We need to move very quickly, and probably with a different approach ... no hurdles, no timeouts," Greenspon said.

There are significant unanswered questions about the new power mix, and the pace at which Canada moves away from fossil fuel power is one of the biggest political issues facing the country, with debates over whether scrapping coal-fired electricity is cost-effective still unresolved.


Related News

View more

Minnesota Power energizes Great Northern Transmission Line

Great Northern Transmission Line delivers 250 MW of carbon-free hydropower from Manitoba Hydro, strengthening Midwest grid reliability, enabling wind storage balancing, and advancing Minnesota Power's EnergyForward strategy for cleaner, renewable energy across the region.


Key Points

A 500 kV cross-border line delivering 250 MW of carbon-free hydropower, strengthening reliability and enabling renewables.

✅ 500 kV, 224-mile line from Manitoba to Minnesota

✅ Delivers 250 MW hydropower via ALLETE-Minnesota Power

✅ Enables wind storage and grid balancing with Manitoba Hydro


Minnesota Power, a utility division of ALLETE Inc. (NYSE:ALE), has energized its Great Northern Transmission Line, bringing online an innovative delivery and storage system for renewable energy that spans two states and one Canadian province, similar to the Maritime Link project in Atlantic Canada.

The 500 kV line is now delivering 250 megawatts of carbon-free hydropower from Manitoba, Canada, to Minnesota Power customers.

Minnesota Power completed the Great Northern Transmission Line (GNTL) in February 2020, ahead of schedule and under budget. The 224-mile line runs from the Canadian border in Roseau County to a substation near Grand Rapids, Minnesota. It consists of 800 tower structures which were fabricated in the United States and used 10,000 tons of North American steel. About 2,200 miles of wire were required to install the line's conductors. The GNTL also is contributing significant property tax revenue to local communities along the route.

"This is such an incredible achievement for Minnesota Power, ALLETE, and our region, and is the culmination of a decade-long vision brought to life by our talented and dedicated employees," said ALLETE President and CEO Bethany Owen. "The GNTL will help Minnesota Power to provide our customers with 50 percent renewable energy less than a year from now. As part of our EnergyForward strategy, it also strengthens the grid across the Midwest and in Canada, enhancing reliability for all of our customers."

With the GNTL energized and connected to Manitoba Hydro's recently completed Manitoba-Minnesota Transmission Project at the border, the companies now have a unique "wind storage" mechanism that quickly balances energy supply and demand in Minnesota and Manitoba, and enables a larger role for renewables in the North American energy grid.

The GNTL and its delivery of carbon-free hydropower are important components of Minnesota Power's EnergyForward strategy to transition away from coal and add renewable power sources while maintaining reliable and affordable service for customers, echoing interties like the Maritime Link that facilitate regional power flows. It also is part of a broader ALLETE strategy to advance and invest in critical regional transmission and distribution infrastructure, such as the TransWest Express transmission project, to ensure grid integrity and enable cleaner energy to reduce carbon emissions.

"The seed for this renewable energy initiative was planted in 2008 when Minnesota Power proposed purchasing 250 megawatts of hydropower from Manitoba Hydro. Beyond the transmission line, it also included a creative asset swap to move wind power from North Dakota to Minnesota, innovative power purchase agreements, and a remarkable advocacy process to find an acceptable route for the GNTL," said ALLETE Executive Chairman Al Hodnik. "It marries wind and water in a unique connection that will help transform the energy landscape of North America and reduce carbon emissions related to the existential threat of climate change."

Minnesota Power and Manitoba Hydro, a provincial Crown Corporation, coordinated on the project from the beginning, navigating National Energy Board reviews along the way. It is based on the companies' shared values of integrity, environmental stewardship and community engagement.

"The completion of Minnesota Power's Great Northern Transmission Line and our Manitoba-Minnesota Transmission Project is a testament to the creativity, perseverance, cooperation and skills of hundreds of people over so many years on both sides of the border," said Jay Grewal, president and CEO of Manitoba Hydro. "Perhaps even more importantly, it is a testament to the wonderful, longstanding relationship between our two companies and two countries. It shows just how much we can accomplish when we all work together toward a common goal."

Minnesota Power engaged federal, state and local agencies; the sovereign Red Lake Nation and other tribes, reflecting First Nations involvement in major transmission planning; and landowners along the proposed routes beginning in 2012. Through 75 voluntary meetings and other outreach forums, a preferred route was selected with strong support from stakeholders that was approved by the Minnesota Public Utilities Commission in April 2016.

A four-year state and federal regulatory process culminated in late 2016 when the federal Department of Energy approved a Presidential Permit for the GNTL, similar to the New England Clean Power Link process, needed because of the international border crossing. Construction of the line began in early 2017.

"A robust stakeholder process is essential to the success of any project, but especially when building a project of this scope," Owen said. "We appreciated the early engagement and support from stakeholders, local communities and tribes, agencies and regulators through the many approval milestones to the completion of the GNTL."


Related News

View more

Tunisia invests in major wind farm as part of longterm renewable energy plan

Sidi Mansour Wind Farm Tunisia will deliver 30 MW as an IPP, backed by UPC Renewables and CFM, under a STEG PPA, supporting 2030 renewable energy targets, grid connection, job creation, and CO2 emissions reduction.


Key Points

A 30 MW wind IPP by UPC and CFM in Sidi Mansour, supplying STEG and advancing Tunisia's 2030 renewable target.

✅ 30 MW capacity under STEG PPA, first wind IPP in Tunisia

✅ Co-developed by UPC Renewables and Climate Fund Managers

✅ Cuts CO2 by up to 56,645 t and creates about 100 jobs


UPC Renewables (UPC) and the Climate Fund Managers (CFM) have partnered to develop a 30 megawatt wind farm in Sidi Mansour, Tunisia, which, amid regional wind expansion efforts, will help the country meet its 30% renewable energy target by 2030.

Tunisia announced the launch of its solar energy plan in 2016, with projects like the 10 MW Tunisian solar park aiming to increase the role of renewables in its electricity generation mix ten-fold to 30%,

This Sidi Mansour Project will help Tunisia meet its goals, reducing its reliance on imported fossil fuels and, mirroring 90 MW Spanish wind build milestones, demonstrating to the world that it is serious about further development of renewable energy investment.

“Chams Enfidha”, the first solar energy station in Tunisia with a capacity of 1 megawatt and located in the Enfidha region. (Ministry of Energy, Mines and Energy Transition Facebook page)

This project will also be among the country’s first Independent Power Producers (IPP). CFM is acting as sponsor, financial adviser and co-developer on the project, in a landscape shaped by IRENA-ADFD funding in developing countries, while UPC will lead the development with its local team. The team will be in charge of permitting, grid connection, land securitisation, assessment of wind resources, contract procurement and engineering.

UPC was selected under the “Authorisation Scheme” tender for the project in 2016, similar to utility-scale developments like a 450 MW U.S. wind farm, and promptly signed a power purchase agreement with Société Tunisienne Electricité et du Gaz (STEG).

Brian Caffyn, chairman of UPC Group, said: “We can start the construction of the Sidi Mansour wind farm in 2020, helping stimulate the Tunisian economy, create local jobs and a social plan for local communities while respecting international environmental protection guidelines.”

Sebastian Surie, CFM’s regional head of Africa, added: “CFM is thrilled to partner with a leading wind developer in the Sidi Mansour Wind Project to assist Tunisia in meeting its renewable energy goals. As potentially the first Wind IPP in Tunisia, this Project will be a testament to how CI1’s full life-cycle financing solution can unlock investment in renewable energy in new markets, as seen in an Irish offshore wind project globally.”

The project will not only provide electricity, but also reduce CO2 emissions by up to 56,645 tonnes and create some 100 new jobs.

Wind turbine in El Haouaria, Tunisia, highlighting advances such as a huge offshore wind turbine that can power 18,000 homes. (Reuters)

Tunisia’s first power station, “Chams Enfidha,” inaugurated at the beginning of July, has a capacity of one megawatt, with an estimated cost of 3.3 million dinars ($1.18 million). The state invested 2.3 million dinars into the project ($820,000), with the remaining 1 million dinars ($360,000) provided by a private investor.


Related News

View more

U.S. Residents Averaged Fewer Power Outages in 2022

2022 U.S. Power Outage Statistics show lower SAIDI as fewer major events hit, with SAIFI trends, electric reliability, outage duration and frequency shaped by hurricanes, winter storms, vegetation, and utility practices across states.


Key Points

They report SAIDI and SAIFI for 2022, showing outage duration, frequency, and impacts of major weather events.

✅ 2022 SAIDI averaged 5.6 hours; SAIFI averaged 1.4 interruptions.

✅ Fewer major events lowered outage duration versus 2021.

✅ Hurricanes and winter storms drove long outages in several states.


In 2022, U.S. electricity consumers on average experienced about 5.5 hours of power disruptions, a decrease from nearly two hours compared to 2021. This information comes from the latest Annual Electric Power Industry Report. The reduction in yearly power interruptions primarily resulted from fewer significant events in 2022 compared to the previous year, and utility disaster planning continues to support grid resilience as severe weather persists.

Since 2013, excluding major events, the annual average duration of power interruptions has consistently hovered around two hours. Factors contributing to major power disruptions include weather-related incidents, vegetation interference near power lines, and specific utility practices, while pandemic-related grid operations influenced workforce planning more than outage frequency. To assess the reliability of U.S. electric utilities, two key indexes are utilized:

  • The System Average Interruption Duration Index (SAIDI) calculates the total length (in hours) an average customer endures non-brief power interruptions over a year.
  • The System Average Interruption Frequency Index (SAIFI) tracks the number of times interruptions occur.

The influence of major events on electrical reliability is gauged by comparing affected states' SAIDI and SAIFI values against the U.S. average, which was 5.6 hours of outages and 1.4 outages per customer in 2022. The year witnessed 18 weather-related disasters in the U.S., each resulting in over $1 billion in damages, and COVID-19 grid assessments indicated the electricity system was largely safe from pandemic impacts. Noteworthy major events include:

  • Hurricane Ian in September 2022, leaving over 2.6 million Floridian customers without electricity, with restoration in some areas taking weeks rather than days.
  • Hurricane Nicole in November 2022, causing over 300,000 Florida customers to lose power.
  • Winter Storm Elliott in December 2022, affecting over 1.5 million customers in multiple states including Texas where utilities struggled after Hurricane Harvey to restore service, and Florida, and bringing up to four feet of snow in parts of New York.

In 2022, states like Florida, West Virginia, Maine, Vermont, and New Hampshire experienced the most prolonged power interruptions, with New Hampshire averaging 10.3 hours and Florida 19.1 hours, and FPL's Irma storm response illustrates how restoration can take days or weeks in severe cases. Conversely, the District of Columbia, Delaware, Rhode Island, Nebraska, and Iowa had the shortest total interruptions, with the District of Columbia averaging just 34 minutes and Iowa 85 minutes.

The frequency of outages, unlike their duration, is more often linked to non-major events. Across the nation, Alaska recorded the highest number of power disruptions per customer (averaging 3.5), followed by several heavily forested states like Tennessee and Maine. Power outages due to falling tree branches are common, particularly during winter storms that burden tree limbs and power lines, as seen in a North Seattle outage affecting 13,000 customers. The District of Columbia stood out with the shortest and fewest outages per customer.


Related News

View more

Ontario's electricity operator kept quiet about phantom demand that cost customers millions

IESO Fictitious Demand Error inflated HOEP in the Ontario electricity market, after embedded generation was mis-modeled; the OEB says double-counted load lifted wholesale prices and shifted costs via the Global Adjustment.


Key Points

An IESO modeling flaw that double-counted load, inflating HOEP and charges in Ontario's wholesale market.

✅ Double-counted unmetered load from embedded generation

✅ Inflated HOEP; shifted costs via Global Adjustment

✅ OEB flagged transparency; exporters paid more


For almost a year, the operator of Ontario’s electricity system erroneously counted enough phantom demand to power a small city, causing prices to spike and hundreds of millions of dollars in extra charges to consumers, according to the provincial energy regulator.

The Independent Electricity System Operator (IESO) also failed to tell anyone about the error once it noticed and fixed it.

The error likely added between $450 million and $560 million to hourly rates and other charges before it was fixed in April 2017, according to a report released this month by the Ontario Energy Board’s Market Surveillance Panel.

It did this by adding as much as 220 MW of “fictitious demand” to the market starting in May 2016, when the IESO started paying consumers who reduced their demand for power during peak periods. This involved the integration of small-scale embedded generation (largely made up of solar) into its wholesale model for the first time.

The mistake assumed maximum consumption at such sites without meters, and double-counted that consumption.

The OEB said the mistake particularly hurt exporters and some end-users, who did not benefit from a related reduction of a global adjustment rate applicable to other customers.

“The most direct impact of the increase in HOEP (Hourly Ontario Energy Price) was felt by Ontario consumers and exporters of electricity, who paid an artificially high HOEP, to the benefit of generators and importers,” the OEB said.

The mix-up did not result in an equivalent increase in total system costs, because changes to the HOEP are offset by inverse changes to a electricity cost allocation mechanism such as the Global Adjustment rate, the OEB noted.


A chart from the OEB's report shows the time of day when fictitious demand was added to the system, and its influence on hourly rates.

Peak time spikes
The OEB said that the fictitious demand “regularly inflated” the hourly price of energy and other costs calculated as a direct function of it.

For almost a year, Ontario's electricity system operator @IESO_Tweets erroneously counted enough phantom demand to power a small city, causing price spikes and hundreds of millions in charges to consumers, @OntEnergyBoard says. @5thEstate reports.

It estimated the average increase to the HOEP was as much as $4.50/MWh, but that price spikes, compounded by scheduled OEB rate changes, would have been much higher during busier times, such as the mid-morning and early evening.

“In times of tight supply, the addition of fictitious demand often had a dramatic inflationary impact on the HOEP,” the report said.

That meant on one summer evening in 2016 the hourly rate jumped to $1,619/MWh, it said, which was the fourth highest in the history of the Ontario wholesale electricity market.

“Additional demand is met by scheduling increasingly expensive supply, thus increasing the market price. In instances where supply is tight and the supply stack is steep, small increases in demand can cause significant increases in the market price.

The OEB questioned why, as of September this year, the IESO had failed to notify its customers or the broader public, amid a broader auditor-regulator dispute that drew political attention, about the mistake and its effect on prices.

“It's time for greater transparency on where electricity costs are really coming from,” said Sarah Buchanan, clean energy program manager at Environmental Defence.

“Ontario will be making big decisions in the coming years about whether to keep our electricity grid clean, or burn more fossil fuels to keep the lights on,” she added. “These decisions need to be informed by the best possible evidence, and that can't happen if critical information is hidden.”

In a response to the OEB report on Monday, the IESO said its own initial analysis found that the error likely pushed wholesale electricity payments up by $225 million. That calculation assumed that the higher prices would have changed consumer behaviour, while upcoming electricity auctions were cited as a way to lower costs, it said.

In response to questions, a spokesperson said residential and small commercial consumers would have saved $11 million in electricity costs over the 11-month period, even as a typical bill increase loomed province-wide, while larger consumers would have paid an extra $14 million.

That is because residential and small commercial customers pay some costs via time-of-use rates, including a temporary recovery rate framework, the IESO said, while larger customers pay them in a way that reflects their share of overall electricity use during the five highest demand hours of the year.

The IESO said it could not compensate those that had paid too much, given the complexity of the system, and that the modelling error did not have a significant impact on ratepayers.

While acknowledging the effects of the mistake would vary among its customers, the IESO said the net market impact was less than $10 million, amid ongoing legislation to lower electricity rates in Ontario.

It said it would improve testing of its processes prior to deployment and agreed to publicly disclose errors that significantly affect the wholesale market in the future.


Related News

View more

California’s Solar Power Cost Shift: A Misguided Policy Threatening Energy Equity

California Rooftop Solar Cost Shift examines PG&E rate hikes, net metering changes, and utility infrastructure spending impacts on low-income households, distributed generation, and clean energy adoption, potentially raising bills and undermining grid resilience.


Key Points

A claim that rooftop solar shifts fixed grid costs to others; critics cite PG&E rates, avoided costs, and impacts.

✅ PG&E rates outpace national average, underscoring cost drivers.

✅ Net metering cuts risk burdening low- and middle-income homes.

✅ Distributed generation avoids infrastructure spend and grid strain.


California is grappling with soaring electricity prices across the state, with Pacific Gas & Electric (PG&E) rates more than double the national average and increasing at an average of 12.5% annually over the past six years. In response, Governor Gavin Newsom issued an executive order directing state energy agencies to identify ways to reduce power costs. However, recent policy shifts targeting rooftop solar users may exacerbate the problem rather than alleviate it.

The "Cost Shift" Theory

A central justification for these pricing changes is the "cost shift" theory. This theory posits that homeowners with rooftop solar panels reduce their electricity consumption from the grid, thereby shifting the fixed costs of maintaining and operating the electrical grid onto non-solar customers. Proponents argue that this leads to higher rates for those without solar installations.

However, this theory is based on a flawed assumption: that PG&E owns 100% of the electricity generated by its customers and is entitled to full profits even for energy it does not deliver. In reality, rooftop solar users supply only about half of their energy needs and still pay for the rest. Moreover, their investments in solar infrastructure reduce grid strain and save ratepayers billions by avoiding costly infrastructure projects and reducing energy demand growth, aligning with efforts to revamp electricity rates to clean the grid as well.

Impact on Low- and Middle-Income Households

The majority of rooftop solar users are low- and middle-income households. These individuals often invest in solar panels to lower their energy bills and reduce their carbon footprint. Policy changes that undermine the financial viability of rooftop solar disproportionately affect these communities, and efforts to overturn income-based charges add uncertainty about affordability and access.

For instance, Assembly Bill 942 proposes to retroactively alter contracts for millions of solar consumers, cutting the compensation they receive from providing energy to the grid, raising questions about major changes to your electric bill that could follow if their home is sold or transferred. This would force those with solar leases—predominantly lower-income individuals—to buy out their contracts when selling their homes, potentially incurring significant financial burdens.

The Real Drivers of Rising Energy Costs

While rooftop solar users are being blamed for rising electricity rates, calls for action have mounted as the true culprits lie elsewhere. Unchecked utility infrastructure spending has been a significant factor in escalating costs. For example, PG&E's rates have increased rapidly, yet the utility's spending on infrastructure projects has often been criticized for inefficiency and lack of accountability. Instead of targeting solar users, policymakers should scrutinize utility profit motives and infrastructure investments to identify areas where costs can be reduced without sacrificing service quality.

California's approach to addressing rising electricity costs by targeting rooftop solar users is misguided. The "cost shift" theory is based on flawed assumptions and overlooks the substantial benefits that rooftop solar provides to the grid and ratepayers. To achieve a sustainable and equitable energy future, the state must focus on controlling utility spending, promoting clean energy access for all, especially as it exports its energy policies across the West, and ensuring that policies support—not undermine—the adoption of renewable energy technologies.


Related News

View more

Sign Up for Electricity Forum’s Newsletter

Stay informed with our FREE Newsletter — get the latest news, breakthrough technologies, and expert insights, delivered straight to your inbox.

Electricity Today T&D Magazine Subscribe for FREE

Stay informed with the latest T&D policies and technologies.
  • Timely insights from industry experts
  • Practical solutions T&D engineers
  • Free access to every issue

Live Online & In-person Group Training

Advantages To Instructor-Led Training – Instructor-Led Course, Customized Training, Multiple Locations, Economical, CEU Credits, Course Discounts.

Request For Quotation

Whether you would prefer Live Online or In-Person instruction, our electrical training courses can be tailored to meet your company's specific requirements and delivered to your employees in one location or at various locations.