Bulgaria begins construction of new nuclear plant

By Associated Press


Protective Relay Training - Basic

Our customized live online or in‑person group training can be delivered to your staff at your location.

  • Live Online
  • 12 hours Instructor-led
  • Group Training Available
Regular Price:
$699
Coupon Price:
$599
Reserve Your Seat Today
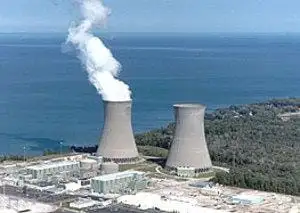
Bulgarian Prime Minister Sergey Stanishev has attended a ceremony to launch construction of the country's second nuclear power station.

The Belene plant on the Danube River will compensate for the closure of two units at the existing Kozlodui plant. State-owned NEK power utility says Belene's two 1000-megawatt reactors will be operational by 2014.

Russia's Atomstroyexport will be the main contractor, using France's Areva and Germany's Siemens as primary subcontractors.

NEK will retain control of Belene's operations with at least a 51 percent stake, while Bulgaria has already shortlisted Germany's RWE Power and Electrabel SA of Belgium as strategic investors.

Related News

Shocking scam: fraudster pretending to be from BC Hydro attempts to extort business

BC Hydro Bitcoin Scam targets small businesses with utility impersonation, call spoofing, and disconnection threats, demanding prepaid cards, cash cards, or bitcoin. Learn payment policies and key warning signs to avoid costly power shutoffs.


Key Points

A phone fraud where impostors threaten power disconnection and demand immediate payment via bitcoin or prepaid cards.

✅ Demands bitcoin, cash cards, or prepaid credit within minutes

✅ Uses caller ID spoofing and utility impersonation tactics

✅ BC Hydro never takes bitcoin or prepaid cards for bills


'I've gotta give him very high marks for being a good scammer,' says almost-fooled business owner

It's an old scam with a new twist.

Fraudsters pretending to be BC Hydro representatives are threatening to disconnect small business owners' power, mirroring Toronto Hydro scam warnings recently, unless they send in cash cards, prepaid credit cards or even bitcoin right away.

Colin Mackintosh, owner of Trans National Art in Langley, B.C., said he almost was fooled by one such scammer.

It was just before quitting time on Thursday at his shop when he got an unpleasant phone call.

"The phone rings. My partner hands me the phone and this fellow says to me that he's outside, he works with BC Hydro and he has a disconnect notice," Mackintosh said.

The caller, Mackintosh said, claimed that if an immediate payment wasn't made they'd cut off the company's power.

'Very well done'

BC Hydro says the scam has been around for a while, and amid commercial power use during COVID-19 in B.C., demanding payment in bitcoin is a new wrinkle.

Fraudsters mostly target small businesses because losing their power for a day or two would be a huge financial hit, a spokesperson said.

Mackintosh said the scammer knew all about the business. His number even showed up as BC Hydro on the call display, and the utility has faced scrutiny in a regulator report unrelated to such scams.

"He had all the answers to every question I seemed to have for him.  Very professional. Very well done. I've gotta give him very high marks for being a good scammer," Mackintosh said.

The caller demanded Mackintosh make an immediate payment at the nearest BC Hydro kiosk. Mackintosh was directed to drive to a certain address to make the payment.

He was ready to pay hundreds of dollars but when he got to the address, there was no kiosk: just a tire shop and inside something that looked like a cash machine but was actually a bitcoin ATM.

"At the very top of it, in little letters, it said 'Bit Coin,'" Mackintosh said. "As soon as I saw those two words, I told him in two expressive words what I thought of him and I hung up the phone."


Scam increasing

BC Hydro spokesperson Mora Scott said fraudsters target small businesses because their livelihoods depend on power, and customers face pressures highlighted in a deferred costs report as well.

"Fraudsters will reach out to our customers pretending to be B.C. Hydro representatives," said Scott.

"They'll demand an immediate payment or they'll disconnect their power. This did start to surface around 2015 but we have seen an increase recently."

Scott said that BC Hydro will never ask for banking information over the phone and does not accept cash card, prepaid credit cards or bitcoin as payment, and customers can consult BC Hydro bill relief for legitimate assistance.


Related News

View more

Shopping for electricity is getting cheaper in Texas

Texas Electricity Prices are shifting as deregulation matures, with competitive market shopping lowering residential rates, narrowing gaps with regulated areas, and EIA data showing long term declines versus national averages across most Texans.


Key Points

Texas Electricity Prices are average residential rates in deregulated and regulated markets across the state.

✅ Deregulated areas saw 17.4% residential price declines since 2006

✅ Regulated zones experienced a 5.5% increase over the same period

✅ Competitive shopping narrowed the gap; Texas averaged below US


Shopping for electricity is becoming cheaper for most Texans, according to a new study from the Texas Coalition for Affordable Power. But for those who live in an area with only one electricity provider, prices have increased in a recent 10-year period, the study says.

About 85 percent of Texans can purchase electricity from a number of providers in a deregulated marketplace, while the remaining 15 percent must buy power from a single provider, often an electric cooperative, in their area.

The report from the Texas Coalition for Affordable Power, which advocates for cities and local governments and negotiates their power contracts, pulls information from the U.S. Energy Information Administration to compare prices for Texans in the two models. Most Texans could begin choosing their electricity provider in 2002.

Buying power tends to be more expensive for Texans who live in a part of the state with a deregulated electricity market. But that gap is continuing to shrink as Texans become more willing to shop for power, even as electricity complaints have periodically risen. In 2015, the gap “was the smallest since the beginning of deregulation,” according to the report.

Between 2006 and 2015, the last year for which data is available, average residential electric prices for Texans in a competitive market decreased by 17.4 percent, while average prices increased by 5.5 percent in the regulated areas, even as the Texas power grid has periodically faced stress.

“These residential price declines are promising, and show the retail electric market is maturing,” Jay Doegey, executive director for the Texas Coalition for Affordable Power, said in a statement. “We’re encouraged by the price declines, but more progress is needed.”

The study attributes the decline to the prevalence of “low-priced individual deals” in the competitive areas, while policymakers consider market reforms to bolster reliability.

Overall, the average price of electricity in Texas (which produces and consumes the most electricity in the U.S.) — including the price in the deregulated marketplace, for the third time in four years — was below the national average in 2015.


Related News

View more

During this Pandemic, Save Money - How To Better Understand Your Electricity Bill

Commercial Electric Tariffs explain utility rate structures, peak demand charges, kWh vs kW pricing, time-of-use periods, voltage, delivery, capacity ratchets, and riders, guiding facility managers in tariff analysis for accurate energy savings.


Key Points

Commercial electric tariffs define utility pricing for energy, demand, delivery, time-of-use periods, riders, and ratchet charges.

✅ Separate kWh charges from kW peak demand fees.

✅ Verify time-of-use windows and demand interval length.

✅ Review riders, capacity ratchets, and minimum demand clauses.


Especially during these tough economic times, as major changes to electric bills are debated in some states, facility executives who don’t understand how their power is priced have been disappointed when their energy projects failed to produce expected dollar savings. Here’s how not to be one of them.

Your electric rate is spelled out in a document called a “tariff” that can be downloaded from your utility’s web page. A tariff should clearly spell out the costs for each component that is part of your rate, reflecting cost allocation practices in your region. Don’t be surprised to learn that it contains a bunch of them. Unlike residential electric rates, commercial electric bills are not based solely on the quantity of kilowatt-hours (kWh) consumed in a billing period (in the United States, that’s a month). Instead, different rates may apply to how your power is supplied, how it is delivered via electricity delivery charges, when it was consumed, its voltage, how fast it was used (in kW), and other factors.

If a tariff’s lingo and word structure are too opaque, spend some time with a utility account rep to translate it. Many state utility commissions also have customer advocates that may assist as they explore new utility rate designs that affect customers. Alternatively, for a fee, facility managers can privately chat with an energy consultant.

Common mistakes

Many facility managers try to estimate savings based on an averaged electric rate, i.e., annual electric spend divided by annual kWh. However, in markets where electricity demand is flat, such a number may obscure the fastest rising cost component: monthly peak demand charges, measured in dollars per kW (or kilo-volt-amperes, kVA).

This charge is like a monthly speeding ticket, based solely on the highest speed you drove during that time. In some areas, peak demand charges now account for 30 to 60 percent of a facility’s annual electric spend. When projecting energy cost savings, failing to separately account for kW peak demand and kWh consumption may result in erroneous results, and a lot of questions from the C-suite.

How peak demand charges are calculated varies among utilities. Some base it on the highest average speed of use across one hour in a month, while others may use the highest average speed during a 15- or 30-minute period. Others may average several of the highest speeds within a defined time period (for example, 8 a.m. to 6 p.m. on weekdays). It is whatever your tariff says it is.

Because some power-consuming (or producing) devices, including those tied to smart home electricity networks, vary in their operation or abilities, they may save money on a few — but not all — of those rate components. If an equipment vendor calculates savings from its product by using an average electric rate, take pause. Tell the vendor to return after the proposal has been redone using tariff-based numbers.

When a vendor is the only person calculating potential savings from using a product, there’s also a built-in conflict of interest: The person profiting from an equipment sale should not also be the one calculating its expected financial return. Before signing any energy project contracts, it’s essential that someone independent of the deal reviews projected savings. That person (typically an energy or engineering consultant) should be quite familiar with your facility’s electric tariff, including any special provisions, riders, discounts, etc., that may pertain. When this doesn’t happen, savings often don’t occur as planned. 

For example, some utilities add another form of demand charge, based on the highest kW in a year. It has various names: capacity, contract demand, or the generic term “ratchet charge.” Some utilities also have a minimum ratchet charge which may be based on a percent of a facility’s annual kW peak. It ensures collection of sufficient utility revenue to cover the cost of installed transmission and distribution even when a customer significantly cuts its peak demand.


Related News

View more

Russia and Ukraine Accuse Each Other of Violating Energy Ceasefire

Russia-Ukraine Energy Ceasefire Violations escalate as U.S.-brokered truce frays, with drone strikes, shelling, and grid attacks disrupting gas supply and power infrastructure across Kursk, Luhansk, Sumy, and Dnipropetrovsk, prompting sanctions calls.


Key Points

Alleged breaches of a U.S.-brokered truce, with both sides striking power grids, gas lines, and critical energy nodes.

✅ Drone and artillery attacks reported on power and gas assets

✅ Both sides accuse each other of breaking truce terms

✅ U.S. mediation faces verification and compliance hurdles


Russia and Ukraine have traded fresh accusations regarding violations of a fragile energy ceasefire, brokered by the United States, which both sides had agreed to last month. These new allegations highlight the ongoing tensions between the two nations and the challenges involved in implementing a truce amid global energy instability in such a complex and volatile conflict.

The U.S.-brokered ceasefire had initially aimed to reduce the intensity of the fighting, specifically in the energy sector, where both sides had previously targeted each other’s infrastructure. Despite this agreement, the accusations on Wednesday suggest that both Russia and Ukraine have continued their attacks on each other's energy facilities, a crucial aspect of the ceasefire’s terms.

Russia’s Ministry of Defence claimed that Ukrainian forces had launched drone and shelling attacks in the western Kursk region, cutting power to over 1,500 homes. This attack allegedly targeted key infrastructure, leaving several localities without electricity. Additionally, in the Russian-controlled part of Ukraine's Luhansk region, a Ukrainian drone strike hit a gas distribution station, severely disrupting the gas supply for over 11,000 customers in the area around Svatove.

In response, Ukrainian President Volodymyr Zelensky accused Russia of breaking the ceasefire. He claimed that Russian drone strikes had targeted an energy substation in Ukraine’s Sumy region, while artillery fire had damaged a power line in the Dnipropetrovsk region, leaving nearly 4,000 consumers without power even as Ukraine increasingly leans on electricity imports to stabilize the grid. Ukraine's accusations painted a picture of continued Russian aggression against critical energy infrastructure, a strategy that had previously been a hallmark of Russia’s broader military operations in the war.

The U.S. had brokered the energy truce as a potential stepping stone toward a more comprehensive ceasefire agreement. However, the repeated violations raise questions about the truce’s viability and the broader prospects for peace between Russia and Ukraine. Both sides are accusing each other of undermining the agreement, which had already been delicate due to previous suspicions and mistrust. In particular, the U.S. administration, led by President Donald Trump, has expressed impatience with the slow progress in moving toward a lasting peace, amid debates over U.S. national energy security priorities.

Kremlin spokesperson Dmitry Peskov defended Russia’s stance, emphasizing that President Vladimir Putin had shown a commitment to peace by agreeing to the energy truce, despite what he termed as daily Ukrainian attacks on Russian infrastructure. He reiterated that Russia would continue to cooperate with the U.S., even though the Ukrainian strikes were ongoing. This perspective suggests that Russia remains committed to the truce but views Ukraine’s actions as violations that could potentially derail efforts to reach a more comprehensive ceasefire.

On the other hand, President Zelensky argued that Russia was not adhering to the terms of the ceasefire. He urged the U.S. to take a stronger stance against Russia, including increasing sanctions on Moscow as punishment for its violations. Zelensky’s call for heightened sanctions is a continuation of his efforts to pressure international actors, particularly the U.S. and European countries, to provide greater energy security support for Ukraine’s struggle and to hold Russia accountable for its actions.

The ceasefire’s fragility is also reflected in the differing views between Ukraine and Russia on what constitutes a successful resolution. Ukraine had proposed a full 30-day ceasefire, but President Putin declined, raising concerns about monitoring and verifying compliance with the terms. This disagreement suggests that both sides are not entirely aligned on what a peaceful resolution should look like and how it can be realistically achieved.

The situation is complicated by the broader context of the war, which has now dragged on for over three years. The conflict has seen significant casualties, immense destruction, and deep geopolitical ramifications. Both countries are heavily reliant on their energy infrastructures, making any attack on these systems not only a military tactic but also a form of economic warfare. Energy resources, including electricity and natural gas, have become central to the ongoing conflict, with both sides using them to exert pressure on the other amid Europe's deepening energy crisis that reverberates beyond the battlefield.

As of now, it remains unclear whether the recent violations of the energy ceasefire will lead to a breakdown of the truce or whether the United States will intervene further to restore compliance, even as Ukraine prepares for winter amid energy challenges. The situation remains fluid, and the international community continues to closely monitor the developments. The U.S., which played a central role in brokering the energy ceasefire, has made it clear that it expects both sides to uphold the terms of the agreement and work toward a more permanent cessation of hostilities.

The continued accusations between Russia and Ukraine regarding the breach of the energy ceasefire underscore the challenges of negotiating peace in such a complex and entrenched conflict. While both sides claim to be upholding their commitments, the reality on the ground suggests that reaching a full and lasting peace will require much more than temporary truces. The international community, particularly the U.S., will likely continue to push for stronger actions to enforce compliance and to prevent the conflict from further escalating. The outcome of this dispute will have significant implications for both countries and the broader European energy landscape and security landscape.


Related News

View more

The Netherlands Outpaces Canada in Solar Power Generation

Netherlands vs Canada Solar Power compares per capita capacity, renewable energy policies, photovoltaics adoption, rooftop installations, grid integration, and incentives like feed-in tariffs and BIPV, highlighting efficiency, costs, and public engagement.


Key Points

Concise comparison of per capita capacity, policies, technology, and engagement in Dutch and Canadian solar adoption.

✅ Dutch per capita PV capacity exceeds Canada's by wide margin.

✅ Strong incentives: net metering, feed-in tariffs, rooftop focus.

✅ Climate, grid density, and awareness drive higher yields.


When it comes to harnessing solar power, the Netherlands stands as a shining example of efficient and widespread adoption, far surpassing Canada in solar energy generation per capita. Despite Canada's vast landmass and abundance of sunlight, the Netherlands has managed to outpace its North American counterpart, which some experts call a solar power laggard in solar energy production. This article explores the factors behind the Netherlands' success in solar power generation and compares it to Canada's approach.

Solar Power Capacity and Policy Support

The Netherlands has rapidly expanded its solar power capacity in recent years, driven by a combination of favorable policies, technological advancements, and public support. According to recent data, the Netherlands boasts a significantly higher per capita solar power capacity compared to Canada, where demand for solar electricity lags relative to deployment in many regions, leveraging its smaller geographical size and dense population centers to maximize solar panel installations on rooftops and in urban areas.

In contrast, Canada's solar energy development has been slower, despite having vast areas of suitable land for solar farms. Challenges such as regulatory hurdles, varying provincial policies, and the high initial costs of solar installations have contributed to a more gradual adoption of solar power across the country. However, provinces like Ontario have seen significant growth in solar installations due to supportive government incentives and favorable feed-in tariff programs, though growth projections were scaled back after Ontario scrapped a key program.

Innovation and Technological Advancements

The Netherlands has also benefited from ongoing innovations in solar technology and efficiency improvements. Dutch companies and research institutions have been at the forefront of developing new solar panel technologies, improving efficiency rates, and exploring innovative applications such as building-integrated photovoltaics (BIPV). These advancements have helped drive down the cost of solar energy and increase its competitiveness with traditional fossil fuels.

In contrast, while Canada has made strides in solar technology research and development, commercialization and widespread adoption have been more restrained due to factors like market fragmentation and the country's reliance on other energy sources such as hydroelectricity.

Public Awareness and Community Engagement

Public awareness and community engagement play a crucial role in the Netherlands' success in solar power adoption. The Dutch government has actively promoted renewable energy through public campaigns, educational programs, and financial incentives for homeowners and businesses to install solar panels. This proactive approach has fostered a culture of energy conservation and sustainability among the Dutch population.

In Canada, while there is growing public support for renewable energy, varying levels of awareness and engagement across different provinces have impacted the pace of solar energy adoption. Provinces like British Columbia and Alberta have seen increasing interest in solar power, driven by environmental concerns, technological advancements, and economic benefits, as the country is set to hit 5 GW of installed capacity in the near term.

Climate and Geographic Considerations

Climate and geographic considerations also influence the disparity in solar power generation between the Netherlands and Canada. The Netherlands, despite its northern latitude, benefits from relatively mild winters and a higher average annual sunlight exposure compared to most regions of Canada. This favorable climate has facilitated higher solar energy yields and made solar power a more viable option for electricity generation.

In contrast, Canada's diverse climate and geography present unique challenges for solar energy deployment. Northern regions experience extended periods of darkness during winter months, limiting the effectiveness of solar panels in those areas. Despite these challenges, advancements in energy storage technologies and hybrid solar-diesel systems are making solar power increasingly feasible in remote and off-grid communities across Canada, even as Alberta faces expansion challenges related to grid integration and policy.

Future Prospects and Challenges

Looking ahead, both the Netherlands and Canada face opportunities and challenges in expanding their respective solar power capacities. In the Netherlands, continued investments in solar technology, grid infrastructure upgrades, and policy support will be crucial for maintaining momentum in renewable energy development.

In Canada, enhancing regulatory consistency, scaling up solar installations in urban and rural areas, and leveraging emerging technologies will be essential for narrowing the gap with global leaders in solar energy generation and for seizing opportunities in the global electricity market as the energy transition accelerates.

In conclusion, while the Netherlands currently generates more solar power per capita than Canada, with the Prairie Provinces poised to lead growth in the Canadian market, both countries have unique strengths and challenges in their pursuit of a sustainable energy future. By learning from each other's successes and leveraging technological advancements, both nations can further accelerate the adoption of solar power and contribute to global efforts to combat climate change.


Related News

View more

No time to be silent on NZ's electricity future

New Zealand Renewable Energy Strategy examines decarbonisation, GHG emissions, and net energy as electrification accelerates, expanding hydro, geothermal, wind, and solar PV while weighing intermittency, storage, materials, and energy security for a resilient power system.


Key Points

A plan to expand electricity generation, balancing decarbonisation, net energy limits, and energy security.

✅ Distinguishes decarbonisation targets from renewable capacity growth

✅ Highlights net energy limits, intermittency, and storage needs

✅ Addresses materials, GHG build-out costs, and energy security


The Electricity Authority has released a document outlining a plan to achieve the Government’s goal of more than doubling the amount of electricity generated in New Zealand over the next few decades.

This goal is seen as a way of both reducing our greenhouse gas (GHG) emissions overall, as everything becomes electrified, and ensuring we have a 100 percent renewable energy system at our disposal. Often these two goals are seen as being the same – to decarbonise we must transition to more renewable energy to power our society.

But they are quite different goals and should be clearly differentiated. GHG emissions could be controlled very effectively by rationing the use of a fossil fuel lockdown approach, with declining rations being available over a few years. Such a direct method of controlling emissions would ensure we do our bit to remain within a safe carbon budget.

If we took this dramatic step we could stop fretting about how to reduce emissions (that would be guaranteed by the rationing), and instead focus on how to adapt our lives to the absence of fossil fuels.

Again, these may seem like the same task, but they are not. Decarbonising is generally thought of in terms of replacing fossil fuels with some other energy source, signalling that a green recovery must address more than just wind capacity. Adapting our lives to the absence of fossil fuels pushes us to ask more fundamental questions about how much energy we actually need, what we need energy for, and the impact of that energy on our environment.

MBIE data indicate that between 1990 and 2020, New Zealand almost doubled the total amount of energy it produced from renewable energy sources - hydro, geothermal and some solar PV and wind turbines.

Over this same time period our GHG emissions increased by about 25 percent. The increase in renewables didn’t result in less GHG emissions because we increased our total energy use by almost 50 percent, mostly by using fossil fuels. The largest fossil fuel increases were used in transport, agriculture, forestry and fisheries (approximately 60 percent increases for each).

These data clearly demonstrate that increasing renewable energy sources do not necessarily result in reduced GHG emissions.

The same MBIE data indicate that over this same time period, the amount of Losses and Own Use category for energy use more than doubled. As of 2020 almost 30 percent of all energy consumed in New Zealand fell into this category.

These data indicate that more renewable energy sources are historically associated with less energy actually being available to do work in society.

While the category Losses and Own Use is not a net energy analysis, the large increase in this category makes the call for a system-wide net energy analysis all the more urgent.

Net energy is the amount of energy available after the energy inputs to produce and deliver the energy is subtracted. There is considerable data available indicating that solar PV and wind turbines have a much lower net energy surplus than fossil fuels.

And there is further evidence that when the intermittency and storage requirements are engineered into a total renewable energy system, the net energy of the entire system declines sharply. Could the Losses and Other Uses increase over this 30-year period be an indication of things to come?

Despite the importance of net energy analysis in designing a national energy system which is intended to provide energy security and resilience, there is not a single mention of net energy surplus in the EA reference document.

So over the last 30 years, New Zealand has doubled its renewable energy capacity, and at the same time increased its GHG emissions and reduced the overall efficiency of the national energy system.

And we are now planning to more than double our renewable energy system yet again over the next 30 years, even as zero-emissions electricity by 2035 is being debated elsewhere. We need to ask if this is a good idea.

How can we expand New Zealand’s solar PV and wind turbines without using fossil fuels? We can’t.

How could we expand our solar PV and wind turbines without mining rare minerals and the hidden costs of clean energy they entail, further contributing to ecological destruction and often increasing social injustices? We can't.

Even if we could construct, deliver, install and maintain solar PV and wind turbines without generating more GHG emissions and destroying ecosystems and poor communities, this “renewable” infrastructure would have to be replaced in a few decades. But there are at least two major problems with this assumed scenario.

The rare earth minerals required for this replacement will already be exhausted by the initial build out. Recycling will only provide a limited amount of replacements.

The other challenge is that a mostly “renewable” energy system will likely have a considerably lower net energy surplus. So where, in 2060, will the energy come from to either mine or recycle the raw materials, and to rebuild, reinstall and maintain the next iteration of a renewable energy system?

There is currently no plan for this replacement. It is a serious misnomer to call these energy technologies “renewable”. They are not as they rely on considerable raw material inputs and fossil energy for their production and never ending replacement.

New Zealand is, of course, blessed with an unusually high level of hydro electric and geothermal power. New Zealand currently uses over 170 GJ of total energy per capita, 40 percent of which is “renewable”. This provides approximately 70 GJ of “renewable” energy per capita with our current population.

This is the average global per capita energy level from all sources across all nations, as calls for 100% renewable energy globally emphasize. Several nations operate with roughly this amount of total energy per capita that New Zealand can generate just from “renewables”.

It is worth reflecting on the 170 GJ of total energy use we currently consume. Different studies give very different results regarding what levels are necessary for a good life.

For a complex industrial society such as ours, 100 GJ pc is said to be necessary for a high levels of wellbeing, determined both subjectively (life satisfaction/ happiness measures), and objectively (e.g. infant mortality levels, female morbidity as an index of population health, access to nutritious food and educational and health resources, etc). These studies do not take into account the large amount of energy that is wasted either through inefficient technologies, or frivolous use, which effective decarbonization strategies seek to reduce.

Other studies that consider the minimal energy needed for wellbeing suggest a much lower level of per capita energy consumption is required. These studies take a different approach and focus on ensuring basic wellbeing is maintained, but not necessarily with all the trappings of a complex industrial society. Their results indicate a level of approximately 20 GJ per capita is adequate.

In either case, we in New Zealand are wasting a lot of energy, both in terms of the efficiency of our technologies (see the Losses and Own Use info above), and also in our uses which do not contribute to wellbeing (think of the private vehicle travel that could be done by active or public transport – if we had good infrastructure in place).

We in New Zealand need a national dialogue about our future. And energy availability is only one aspect. We need to discuss what our carrying capacity is, what level of consumption is sustainable for our population, and whether we wish to make adjustments in either our per capita consumption or our population. Both together determine whether we are on the sustainable side of carrying capacity. Currently we are on the unsustainable side, meaning our way of life cannot endure. Not a good look for being a good ancestor.

The current trajectory of the Government and Electricity Authority appears to be grossly unsustainable. At the very least they should be able to answer the questions posed here about the GHG emissions from implementing a totally renewable energy system, the net energy of such a system, and the related environmental and social consequences.

Public dialogue is critical to collectively working out our future. Allowing the current profit-driven trajectory to unfold is a recipe for disasters for our children and grandchildren.

Being silent on these issues amounts to complicity in allowing short-term financial interests and an addiction to convenience jeopardise a genuinely secure and resilient future. Let’s get some answers from the Government and Electricity Authority to critical questions about energy security.


Related News

View more

Sign Up for Electricity Forum’s Newsletter

Stay informed with our FREE Newsletter — get the latest news, breakthrough technologies, and expert insights, delivered straight to your inbox.

Electricity Today T&D Magazine Subscribe for FREE

Stay informed with the latest T&D policies and technologies.
  • Timely insights from industry experts
  • Practical solutions T&D engineers
  • Free access to every issue

Download the 2025 Electrical Training Catalog

Explore 50+ live, expert-led electrical training courses –

  • Interactive
  • Flexible
  • CEU-cerified