NB Power Smart Meters will replace aging analog meters, boosting billing accuracy, reducing leakage, and modernizing distribution as the EUB considers a $92 million rollout of 360,000 advanced meters for residential and commercial customers.
Key Points
NB Power Smart Meters replace analog meters, improving billing accuracy and reducing leakage in the electricity network.
✅ EUB reviewing $92M plan for 360,000 advanced meters
✅ Replaces 98,000 analog units; curbs unbilled kWh
✅ Improves billing accuracy and reduces system leakage
Home and business owners with old power meters in New Brunswick have been getting the equivalent of up to 10 days worth of electricity a year or more for free, a multi million dollar perk that will end quickly if the Energy and Utilities Board approves the adoption of smart meters, a move that in other provinces has prompted refusal fees for some holdouts.
Last week the EUB began deliberations over whether to allow NB Power to purchase and install 360,000 new generation smart meters for its residential and commercial customers as part of a $92 million upgrade of its distribution system, even as regulators elsewhere approve major rate changes that affect customer bills.
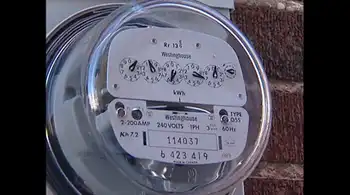
If approved, that will spell the end to about 98,000 aging electromagnetic or analog meters still used by about one quarter of NB Power customers. Those are the kind with a horizontal spinning silver disc and clock-face style dials that record consumption
NB Power lawyer John Furey told the energy and utilities board last week that the utility suspects it loses several million dollars a year to electricity consumed by customers that is not properly recorded by their old meters. It was a central issue in Furey's argument for smart meters amid broader debates over industrial subsidies and debt. (Roger Cosman/CBC)
The analog units, some more than 50 years old and installed back when the late Louis Robichaud and Richard Hatfield were premiers in the 1960's and 1970's - are suspected of doling out millions of kilowatt hours of free power to customers by failing to register all of the current that moves through them.
"Over time, analog meters slow down and they register lower consumption of electricity than is actually occurring," said NB Power lawyer John Furey last week about the widespread freeloading of power in New Brunswick caused by the old meters.
3 per cent missed
A 2010 report by the independent non-profit Electric Power Research Institute in Palo Alto, California and entered into evidence during NB Power's smart meter hearing said old spinning disc meters generally degrade over time and after 20 years typically fail to register nearly 3 per cent of the power that flows through them.
The average age of analog meters in New Brunswick is much older than that - 31 years - and more than 11,000 of the units are over the age of 40.
"Worn gears, corrosion, moisture, dust, and insects can all cause drag and result in an electromagnetic meter that does not capture the full consumption of the premises," said the report.
The sudden correction to full accounting and billing could naturally surprise these homeowners and even trigger consumer backlash in some cases
- Electric Power Research Institute report
About 94,000 NB residential customers and 3,900 commercial customers have an old meter, according to NB Power records. The group would receive about 40 million kilowatt hours of electricity for free this year ($5.1 million worth including HST) if the average unit failed to register 2 percent of the electricity flowing through it, while elsewhere some customers are receiving lump-sum credits on electricity bills.
That is about $41 in free power for the average residential customer and $322 for the average business.
But, according to the research, there would also be hundreds of customers with meters that have slowed considerably more than the average with 0.3 percent - or close to 300 in NB Power's case - not counting between 10 and 20 percent of the electricity customers are using.
NB Power senior Vice President Lori Clark told the EUB stopping the freeloading of power in New Brunswick caused by older meters is in everyone's interest. (Roger Cosman/CBC)
That's potentially $400 in free electricity in a year for a residential customer with average consumption.
"While the average meter might be only slightly slow a few could be significantly so," said the report.
"The sudden correction to full accounting and billing could naturally surprise these homeowners and result in questioning of a new meter, as seen in a shocking $666 bill reported by a Nova Scotia senior."
The report made the point analog meters can also run fast but called that "less common" meaning that if the EUB approves smart meters, tens of thousands of customers who lose an old meter to a new accurate model will experience higher bills.
'Leakage' reduction
NB Power acknowledges it does not know precisely how much power its older meters give away but said whether it is a little or a lot, ending the freebies is to everyone's benefit.
"It reduces our inefficiencies, reduces our leakage that we have in the system, so that we are picking up those unbilled kilowatt hours," said NB Power senior vice president Lori Clark about ending the free power many customers unknowingly enjoy.
Smart meter critics change tone on NB Power's new business case
NB Power's smart meter plan gets major boost with critical endorsements
"Customers benefit from reduced inefficiencies in our system. They benefit from reduced leakage in our system and the fact that those kilowatt hours are being properly billed to the customers that have consumed the kilowatt hours."
NB Power hopes to win approval of its plan to acquire smart meters by this spring to allow installation beginning in mid 2021, even as some utilities elsewhere have backed away from smart home network projects.
Related News