Utility dispute with FEMA unresolved

By Associated Press


CSA Z462 Arc Flash Training - Electrical Safety Essentials

Our customized live online or in‑person group training can be delivered to your staff at your location.

  • Live Online
  • 6 hours Instructor-led
  • Group Training Available
Regular Price:
$249
Coupon Price:
$199
Reserve Your Seat Today
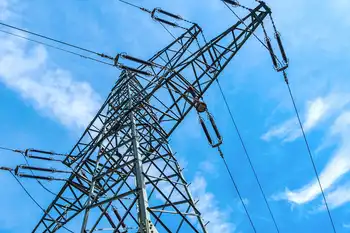
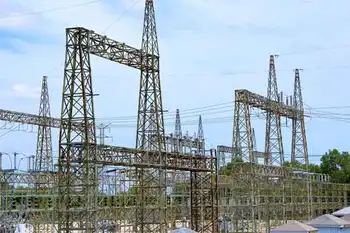
A group of electric utilities in Kansas has so far been unable to resolve differences with the Federal Emergency Management Agency over how to proceed with repairs to facilities damaged in December's ice storm.

The 26 Kansas utilities involved provide electric service to more than 300,000 residents. Several meetings between the municipal and cooperative electric utilities and FEMA have been aimed at resolving how to pay for replacing or repairing the damaged facilities.

The utilities contend they have line sections that need to be replaced, but FEMA disputes the extent of the damage, Stuart Lowry of Kansas Electric Cooperatives Inc. said.

Lowry said FEMA has proposed additional inspections to identify the damage more thoroughly.

"Our primary concern is to get these damaged systems back and operating at pre-disaster conditions very soon," said Colin Hansen of Kansas Municipal Utilities. "Unfortunately, the process outlined by FEMA does not get us to that point."

But FEMA said the utilities have not provided the agency with evidence that the facilities need replacing.

"It's the responsibility of the applicant to show us the damage," said Anita Westervelt, external affairs officer for FEMA. "We restore to predisaster design and conditions. We do not rebuild unless something is totally destroyed.

"We don't come to a disaster to not give people money," she added. "We come to give them every dollar that we can validate they're eligible for."

Westervelt said FEMA has paid about $52 million for repairs from the storm that hit much of Kansas on Dec. 6, 2007, and intensified on Dec. 10. More than 115,000 households lost power.

KEC said the state has estimated damage to be about $340 million for electric cooperatives in the state and that the money authorized so far did not return the electrical systems to pre-disaster condition.

Lowry said the required inspections could take up to a year, and that the detailed inspections could result in conductor breaks and outages.

"We have already provided FEMA with photographs, engineering studies, inspection reports, inventory reports, outage data and other information to document the extent of the damage, so we certainly don't welcome the additional delay the new inspections will cause," Lowry said.

But Westervelt said FEMA is governed by statutes and congressional mandates and that its requirements are reasonable.

"They think we should take their electrical engineering reports at face value," she said. "But by law, we cannot without validating."

Related News

Two-thirds of the U.S. is at risk of power outages this summer

Home Energy Independence reduces electricity costs and outage risks with solar panels, EV charging, battery storage, net metering, and smart inverters, helping homeowners offset tiered rates and improve grid resilience and reliability.


Key Points

Home Energy Independence pairs solar, batteries, and smart EV charging to lower bills and keep power on during outages.

✅ Offset rising electricity rates via solar and net metering

✅ Add battery storage for backup power and peak shaving

✅ Optimize EV charging to avoid tiered rate penalties


The Department of Energy recently warned that two-thirds of the U.S. is at risk of losing power this summer. It’s an increasingly common refrain: Homeowners want to be less reliant on the aging power grid and don’t want to be at the mercy of electric utilities due to rising energy costs and dwindling faith in the power grid’s reliability.

And it makes sense. While the inflated price of eggs and butter made headlines earlier this year, electricity prices quietly increased at twice the rate of overall inflation in 2022, even as studies indicate renewables aren’t making power more expensive overall, and homeowners have taken notice. In fact, according to Aurora Solar’s Industry Snapshot, 62% expect energy prices will continue to rise.

Homeowners aren’t just frustrated that electricity is pricey when they need it, they’re also worried it won’t be available at all when they feel the most vulnerable. Nearly half (48%) of homeowners are concerned about power outages stemming from weather events, or grid imbalances from excess solar in some regions, followed closely by outages due to cyberattacks on the power grid.

These concerns around reliability and cost are creating a deep lack of confidence in the power grid. Yet, despite these growing concerns, homeowners are increasingly using electricity to displace other fuel sources.

The electrification of everything
From electric heat pumps to electric stoves and clothes dryers, homeowners are accelerating the electrification of their homes. Perhaps the most exciting example is electric vehicle (EV) adoption and the need for home charging. With major vehicle makers committing to ambitious electric vehicle targets and even going all-electric in the future, EVs are primed to make an even bigger splash in the years to come.

The by-product of this electrification movement is, of course, higher electric bills because of increased consumption. Homeowners also risk paying more for every unit of energy they use if they’re part of a tiered pricing utility structure, where energy-insecure households often pay 27% more on electricity because customers are charged different rates based on the total amount of energy they use. Many new electric vehicle owners don’t realize this until they are deep into purchasing their new vehicle, or even when they open that first electric bill after the car is in their driveway.

Sure, this electrification movement can feel counterintuitive given the power grid concerns. But it’s actually the first step toward energy independence, and emerging models like peer-to-peer energy sharing could amplify that over time.

Balancing conflicting movements
The fact is that electrification is moving forward quickly, even among homeowners who are concerned about electricity prices and power grid reliability, and about why the grid isn’t yet 100% renewable in the U.S. This has the potential to lead to even more discontent with electric utilities and growing anxiety over access to electricity in extreme situations. There is a third trend, though, that can help reconcile these two conflicting movements: the growth of solar.

The popularity of solar is likely higher than you think: Nearly 77% of homeowners either have solar panels on their homes or are interested in purchasing solar. The Aurora Solar Industry Snapshot report also showed a nearly 40% year-over-year increase in residential solar projects across the U.S. in 2022, as the country moves toward 30% power from wind and solar overall, aligning with the Solar Energy Industries Association’s (SEIA) Solar Market Insight Report, which found, “Residential solar had a record year [in 2022] with nearly 6 GWdc of installations, representing 40% growth over 2021.”

It makes sense that finding ways to tamp down—even eliminate—growing bills caused by the electrification of homes is accelerating interest in solar, as more households weigh whether residential solar is worth it for their budgets, and residential solar installers are seeing this firsthand. The link between EVs and solar is a great proof point: Almost 80% of solar professionals said EV adoption often drives new interest in solar. 


Related News

View more

Can California Manage its Solar Boom?

California Duck Curve highlights midday solar oversupply and steep evening peak demand, stressing grid stability. Solutions include battery storage, demand response, diverse renewables like wind, geothermal, nuclear, and regional integration to reduce curtailment.


Key Points

A mismatch between midday solar surplus and evening demand spikes, straining the grid without storage and flexibility.

✅ Midday solar oversupply forces curtailment and wasted clean energy.

✅ Evening ramps require fast, fossil peaker plants to stabilize load.

✅ Batteries, demand response, regional trading flatten the curve.


California's remarkable success in adopting solar power, including a near-100% renewable milestone, has created a unique challenge: managing the infamous "duck curve." This distinctive curve illustrates a growing mismatch between solar electricity generation and the state's energy demands, creating potential problems for grid stability and ultimately threatening to slow California's progress in the fight against climate change.


The Shape of the Problem

The duck curve arises from a combination of high solar energy production during midday hours and surging energy demand in the late afternoon and evening when solar power declines. During peak solar hours, the grid often has an overabundance of electricity, and curtailments are increasing as a result, while as the sun sets, demand surges when people return home and businesses ramp up operations. California's energy grid operators must scramble to make up this difference, often relying on fast-acting but less environmentally friendly power sources.


The Consequences of the Duck Curve

The increasing severity of the duck curve has several potential consequences for California:

  • Grid Strain: The rapid ramp-up of power sources to meet evening demand puts significant strain on the electrical grid. This can lead to higher operational costs and potentially increase the risk of blackouts during peak demand times.
  • Curtailed Energy: To avoid overloading the grid, operators may sometimes have to curtail excess solar energy during midday, as rising curtailment reports indicate, essentially wasting clean electricity that could have been used to displace fossil fuel generation.
  • Obstacle to More Solar: The duck curve can make it harder to add new solar capacity, as seen in Alberta's solar expansion challenges, for fear of further destabilizing the grid and increasing the need for fossil fuel-based peaking plants.


Addressing the Challenge

California is actively seeking solutions to mitigate the duck curve, aligning with national decarbonization pathways that emphasize practicality. Potential strategies include:

  • Energy Storage: Deploying large-scale battery storage can help soak up excess solar electricity during the day and release it later when demand peaks, smoothing out the duck curve.
  • Demand Flexibility: Encouraging consumers to shift their energy use to off-peak hours through incentives and smart grid technologies can help reduce late-afternoon surges in demand.
  • Diverse Power Sources: While solar is crucial, a balanced mix of energy sources, including geothermal, wind, and nuclear, can improve grid stability and reduce reliance on rapid-response fossil fuel plants.
  • Regional Cooperation: Integrating California's grid with neighboring states can aid in balancing energy supply and demand across a wider geographical area.


The Ongoing Solar Debate

The duck curve has become a central point of debate about the future of California's energy landscape. While acknowledging the challenge, solar advocates argue for continued expansion, backed by measures like a bill to require solar on new buildings, emphasizing the urgent need to transition away from fossil fuels. Grid operators and some utility companies call for a more cautious approach, emphasizing grid reliability and potential costs if the problem isn't effectively managed.


Balancing California's Needs and its Green Ambitions

Finding the right path forward is essential; it will determine whether California can continue to lead the way in solar energy adoption while ensuring a reliable and affordable electricity supply. Successfully navigating the duck curve will require innovation, collaboration, and a strong commitment to building a sustainable energy system, as wildfire smoke impacts on solar continue to challenge generation predictability.


Related News

View more

New York and New England Need More Clean Energy. Is Hydropower From Canada the Best Way to Get it?

Canadian Hydropower Transmission delivers HVDC clean energy via New England Clean Energy Connect and Champlain Hudson Power Express, linking HydroQuébec to Maine and New York grids for renewable energy, decarbonization, and lower wholesale electricity rates.


Key Points

HVDC delivery of HydroQuébec power to New England and New York via NECEC and CHPE, cutting emissions and costs.

✅ 1,200 MW via NECEC; 1,000 MW via CHPE.

✅ HVDC routes: 145-mile NECEC and 333-mile CHPE.

✅ Debates: land impacts, climate justice, wholesale rates.


As the sole residents of unorganized territory T5 R7 deep within Maine's North Woods, Duane Hanson and his wife, Sally Kwan, have watched the land around them—known for its natural beauty, diverse wildlife and recreational fishing—transformed by decades of development. 

But what troubles them most is what could happen in the next few months. State and corporate officials are pushing for construction of a 53-mile-long power line corridor cutting right through the woods and abutting the wild lands surrounding Hanson's property. 

If its proponents succeed, Hanson fears the corridor may represent the beginning of the end of his ability to live "off the land" away from the noise of technology-obsessed modern society. Soon, that noise may be in his backyard. 

"I moved here to be in the pristine wilderness," said Hanson.
 
With his life in what he considers the last "wild" place left on the East Coast on the line, the stakes have never felt higher to Hanson—and many across New England, as well.

The corridor is part of the New England Clean Energy Connect, one of two major and highly controversial transmission line projects meant to deliver Canadian hydropower from the government-owned utility HydroQuébec, in a province that has closed the door on nuclear power, to New England electricity consumers. 

As New England states rush to green their electric grids and combat the accelerating climate crisis, the simultaneous push from Canada to expand the market for hydroelectric power from its vast water resources, including Manitoba's clean energy, has offered these states a critical lifeline at just the right moment. 

The other big hydropower transmission line project will deliver 1,000 megawatts of power, or enough to serve approximately one million residential customers, to the New York City metropolitan area, which includes the city, Long Island, and parts of the Hudson Valley, New Jersey, Connecticut and Pennsylvania. 

The 333-mile-long Champlain Hudson Power Express project will consist of two high voltage direct current cables running underground and underwater from Canada, beneath Lake Champlain and the Hudson River, to Astoria, Queens. 

There, the Champlain Hudson project will interconnect to a sector of the New York electricity grid where city and corporate officials say the hydropower supplied can help reduce the fossil fuels that currently comprise significantly more of the base load than in other parts of the state. Though New York has yet to finalize a contract with HydroQuébec over its hydropower purchase, developers plan to start construction on the $2.2 billion project in 2021 and say it will be operational in 2025. 

The New England project consists of 145 miles of new HVDC transmission line that will run largely above ground from the Canadian border, through Maine to Massachusetts. The $1 billion project, funded by Massachusetts electricity consumers, is expected to deliver 1,200 megawatts of clean energy to the New England energy grid, becoming the region's largest clean energy source. 

Central Maine Power, which will construct the Maine transmission corridor, says the project will decrease wholesale electric rates and create thousands of jobs. Company officials expect to receive all necessary permits and begin construction by the year's end, with the project completed and in service by 2020. 

With only months until developers start making both projects on-the-ground realities, they have seized public attention within, and beyond, their regions. 

Hanson is one among many concerned New England and New York residents who've joined the ranks of environmental activists in a contentious battle with public and corporate officials over the place of Canadian hydropower in their states' clean energy futures. 

Officials and transmission line proponents say importing Canadian hydropower offers an immediate and feasible way to help decarbonize electricity portfolios in New York and New England and to address existing transmission constraints that limit cross-border flows today, supporting their broader efforts to combat climate change. 

But some environmental activists say hydropower has a significant carbon footprint of its own. They fear the projects will make states look "greener" at the expense of the local environment, Indigenous communities, and ultimately, the climate. 

"We're talking about the most environmentally and economically just pathway" to decarbonization, said Annel Hernandez, associate director of the NYC Environmental Justice Alliance. "Canadian hydro is not going to provide that." 

To that end, environmental groups opposing Canadian hydropower say New York and New England should seize the moment to expedite local development of wind and solar power. 

Paul Gallay, president of the nonprofit environmental organization Riverkeeper—which withdrew its initial support for the Champlain Hudson Power Express last November— believes New York has the capacity to develop enough in-state renewable energy sources to meet its clean energy goals, without the new transmission line. 

Yet New York City's analysis shows clearly that Canadian hydropower is critical for its clean energy strategy, said Dan Zarrilli, director of OneNYC and New York City's chief climate policy adviser. 

"We need every bit of clean energy we can get our hands on," he said, to meet the city's goal of carbon neutrality by 2050 and help achieve the state's clean energy mandates. 

Removing Canadian hydropower from the equation, said Zarilli, would commit the city to the "unacceptable outcome" of burning more gas. The city's marginalized communities would likely suffer most from the resulting air pollution and associated health impacts. 

While the two camps debate Canadian hydropower's carbon footprint and what climate justice requires, this much is clear: When it comes to pursuing a zero-carbon future, there are no easy answers. 

Hydropower's Carbon Footprint
Many people take for granted that because hydropower production doesn't involve burning fossil fuels, it's a carbon-neutral endeavor. But that's not always the case, depending on where hydropower is sourced. 

Large-scale hydropower projects often involve the creation of hydroelectric dams and reservoirs, and, in some cases, repowering existing dams to generate clean electricity. The release and flow of water from the reservoir through the dam provides the energy necessary to generate hydropower, which long-distance power lines, or transmission lines, carry to its intended destination—in this case, New England and New York. 

The initial process of flooding land to create a hydroelectric reservoir can have a sizable carbon footprint, especially in heavily vegetated areas. It causes the vegetation and soil underwater to decompose, releasing carbon dioxide and methane—a greenhouse gas 84 times more potent over a 20-year period than carbon dioxide. 

Hydropower accounts for 60 percent of Canada's electricity generation, and HydroQuébec has planned to increase capacity to 37,000 MW in 2021, with the nation second only to China in the percentage of the world's total hydroelectricity it generates. By contrast, hydropower only accounts for seven percent of U.S. utility-scale electricity generation, making it a foreign concept to many Americans. 

As New England works to introduce substantial amounts of Canadian hydropower to its electricity grid, hydropower proponents are promoting it as a prime source for clean electricity, and new NB Power agreements are expanding regional transfers within Canada as well. 

Last fall, Central Maine Power formed its own political action committee, Clean Energy Matters, to advance the New England hydropower project. Together with HydroQuébec, the Maine utility has spent nearly $17 million campaigning for the project this year. 


Related News

View more

Alberta Carbon tax is gone, but consumer price cap on electricity will remain

Alberta Electricity Rate Cap stays despite carbon tax repeal, keeping the Regulated Rate Option at 6.8 cents/kWh. Levy funds cover market gaps as the UCP reviews NDP policies to maintain affordable utility bills.


Key Points

Program capping RRO power at 6.8 cents/kWh, using levy funds to offset market prices while the UCP reviews policy.

✅ RRO cap fixed at 6.8 cents/kWh for eligible customers

✅ Levy funds pay generators when market prices exceed the cap

✅ UCP reviewing NDP policies to ensure affordable rates


Alberta's carbon tax has been cancelled, but a consumer price cap on electricity — which the levy pays for — is staying in place for now.

June electricity rates are due out on Monday, about four days after the new UCP government did away with the carbon charge on natural gas and vehicle fuel.

Part of the levy's revenue was earmarked by the previous NDP government to keep power prices at or below 6.8 cents per kilowatt hour under new electricity rules set by the province.

"The Regulated Rate Option cap of 6.8 cents/kWh was implemented by the previous government and currently remains in effect. We are reviewing all policies put in place by the former government and will make decisions that ensure more affordable electricity rates for job-creators and Albertans," said a spokesperson for Alberta's energy ministry in an emailed statement.

Albertans with regulated rate contracts and all City of Medicine Hat utility customers only pay that amount or less, though some Alberta ratepayers have faced deferral-related arrears.

If the actual market price rises above that, the difference is paid to generators directly from levy funds, a buffer that matters as experts warn prices are set to soar later this year.

The government has paid more than $55 million to utilities over the past year ending in March 2019, due to that electricity price cap being in place.

Alberta Energy says the price gap program will continue, at least for the time being, amid electricity policy changes being considered.


Related News

View more

Wind Denmark - Danish electricity generation sets a new green record

Denmark 2019 electricity CO2 intensity shows record-low emissions as renewable energy surges, wind power dominates, offshore wind expands, and coal phase-out accelerates Denmark's energy transition and grid decarbonization, driven by higher CO2 prices and flexibility.


Key Points

It is 135 g CO2/kWh, a record low enabled by wind power growth, offshore wind, and a sharp coal decline.

✅ Average emissions fell to 135 g CO2/kWh, the lowest on record

✅ Wind and solar supplied 49.9% of national electricity use

✅ Coal consumption dropped 46% as CO2 allowance prices rose


Danish electricity producers set a new green record in 2019, when an average produced kilowatt-hour emitted 135 gr CO2 / kWh.

It is the lowest CO2 emission ever measured in Denmark and about one-seventh of what the electricity producers emitted in 1990.

Never has a kilowatt-hour produced emitted as little CO2 as it did in 2019. And that's according to Energinet's recently published annual Environmental Report on Danish electricity generation and cogeneration, two primary causes.

One reason is that more green power has been produced because the Horns Rev 3 offshore wind farm, which can produce electricity for 425,000 households, was commissioned in 2019. The other is that Danish coal consumption fell by 46 percent from 2018 to 2019, as coal phase-out plans gathered pace across the sector. the dramatic decline in coal consumption is partly due a significant increase in the price of CO2 quotas, and thus also the price of CO2 emissions.

'Historically, 135 gr CO2 / kWh is a really, really low figure, showing the impressive green travel that the Danish electricity system has been on. In 1990, a kilowatt-hour produced emitted over 1000 grams of CO2, ie about seven times as much as today, 'says Hanne Storm Edlefsen, area manager in Energinet Power Systems Responsibility.

Wind energy is the dominant form of electricity generation in Denmark, a pattern the UK wind beat coal in 2016 when shifting away from fossil fuels.

17.1 TWh. Danish wind turbines and solar cells generated so much electricity in 2019, corresponding to 49.9 per cent. of Danish electricity consumption, reflecting broader EU wind and solar growth trends as well. An increase of 15 per cent. The wind turbines alone produced 16 TWh, which is not only a new green record, but also puts a thick line that wind energy is by far the most dominant form of electricity generation in Denmark.

'Thanks to our large wind resources, turbines are by far the largest supplier of renewable energy in Denmark, and this will be for many years to come. The large price drop in new wind energy in recent years - for both onshore and offshore winds - will ensure that wind energy will drive a large part of the growth in renewable energy in the coming years, as new wind generation records are set in markets like the UK, 'says Soren Klinge, electricity market manager at Wind Denmark.

Conversely, total electricity generation from fossil and bio-based fuels decreased by 26 PJ (petajoule ed.), Corresponding to 34 per cent. from 2018 to 2019, mirroring renewables overtaking coal in Germany. Nevertheless, net electricity generation was just under 30 TWh both years.

'It is worth noting that while fossil fuels are being phased out, Denmark maintains its annual net production of electricity. The green, so to speak, replaces the black. It once again underpins that green conversion, high security of supply and an affordable electricity price can go hand in hand, 'says Hanne Storm Edlefsen.

Danish power system is ready for a green future

Including trade in electricity with neighboring countries, 1 kWh in a Danish outlet generates 145 gr CO2 / kWh.

'There has been a very significant development in the Danish electricity system in recent years, where the electricity system can now be operated solely on the renewable energy. It is a remarkable development, also from an international perspective where low-carbon progress stalled in the UK in 2019, that one would not have thought possible for just a few years ago, 'he says.

More than expected have phased out coal

The electricity from the Danish sockets will be greener , predicts Energinet's environmental report , which expects CO2 intensity in the coming years. This is explained by an expectation of increased electrification of energy consumption, together with a continued expansion with wind and solar.

'Wind energy is the cornerstone of the green transition. With the commissioning of the Kriegers Flak offshore wind farm and several major onshore wind turbine projects within the next few years, we can well expect that only the wind's share of electricity consumption will exceed 50 per cent hopefully as early as 2021,' concludes Soren Klinge.


Related News

View more

Parsing Ontario's electricity cost allocation

Ontario Global Adjustment and ICI balance hydro rates, renewable cost shift, and peak demand. Class A and Class B customers face demand response decisions amid pandemic occupancy uncertainty and volatile GA charges through 2022.


Key Points

A pricing model where GA costs and ICI peak allocation shape Class A/B bills, driven by renewables cost shifts.

✅ Renewable cost shift trims GA; larger Class A savings expected.

✅ Class A peak strategy returns; occupancy uncertainty persists.

✅ Class B faces volatile GA; limited levers beyond efficiency.


Ontario’s large commercial electricity customers can approach the looming annual decision about their billing structure for the 12 months beginning July 1 with the assurance of long-term relief on a portion of their costs, amid changes coming for electricity consumers that could affect planning. That’s to be weighed against uncertainties around energy demand and whether a locked-in cost allocation formula that looked favourable in pre-pandemic times will remain so until June 30, 2022.

“The biggest unknown is we just don’t know when the people are coming back,” Jon Douglas, director of sustainability with Menkes Property Management Services, reflected during a webinar sponsored by the Building Owners and Managers Association (BOMA) of Greater Toronto last week. “The occupancy in our office buildings this fall, and going into the new year, could really impact the outcome of the decision.”

After a year of operational upheaval and more modifications to provincial electricity pricing policies, BOMA Toronto’s regularly scheduled workshop ahead of the June 15 deadline for eligible customers to opt into the Industrial Conservation Initiative (ICI) program had a lot of ground to cover. Notably, beginning in January, all commercial customers have seen a reduction in the global adjustment (GA) component of their monthly hydro bills after the Ontario government shifted costs associated with contracted non-hydroelectric renewable supply to reduce the burden on industrial ratepayers from electricity rates to the general provincial account — a move that trims approximately $258 million per month from the total GA charged to industrial and commercial customers. However, they won’t garner the full benefit of that until 2022 since they’re currently repaying about $333 million in GA costs that were deferred in April, May and June of 2020.

Renewable cost shift pares the global adjustment
For now, Ontario government officials estimate the renewable cost shift equates to a 12 per cent discount relative to 2020 prices, even as typical bills may rise about 2% as fixed pricing ends in some cases. Once last year’s GA deferral is repaid at the end of 2021, they project the average Class A customer participating in the ICI program should realize a 16 per cent saving on the total hydro bill, while Class B customers paying the GA on a volumetric per kilowatt-hour (kWh) basis will see a slightly more moderate 15 per cent decrease.

“This is the biggest change to electricity pricing that’s happened since the introduction of ICI,” Tim Christie, director of electricity policy, economics and system planning for Ontario’s Ministry of Energy, Northern Development and Mines, told online workshop attendees. “The government is funding the out-of-market costs of renewables. It does tail off into the 2030s as those contracts (for wind, solar and biomass generation) expire, but over the next eight-ish years, it’s pretty steady at around just over $3 billion per year.”

Extrapolating from 2020 costs, he pegged average electricity costs at roughly 9.1 cents/kWh for Class A commercial customers and 13.2 cents/kWh for Class B, a point of concern for Ontario manufacturers facing high rates as well. However, energy management specialists suggest actual 2021 numbers haven’t proved that out.

“In commercial buildings, we’re averaging 10 to 12 cents for Class A in 2021, and we’re seeing more than that for about 14, 15 cents for Class B,” reported Scott Rouse, managing partner with the consulting firm, Energy@Work.

GA costs for Class B customers dropped nearly 30 per cent in the first four months of 2021 compared to the last four months of 2020, when they averaged 11.8 cents/kWh. Thus far, though, there have been significant month-to-month fluctuations, with a low of 5.04 cents/kWh in February and a high of 10.9 cents/kWh in April contributing to the four-month average of 8.3 cents/kWh.

“In 2020, system-wide GA very often averaged more than $1 billion per month,” Rouse said. “This February it dropped to $500 million, which was really quite surprising. So it is a very volatile cost.”

Although welcome, the renewable cost shift does alter the payback on energy-saving investments, particularly for demand response mechanisms like energy storage. When combined with pandemic-related uncertainty and a series of policy and program reversals alongside calls to clean up Ontario’s hydro policy in recent years, the industry’s appetite for some more capital-intensive technologies appears to be flagging.

“Volatility puts a pause on some of the innovation,” said Terry Flynn, general manager with BentallGreenOak and chair of BOMA Toronto’s energy committee. “It could be a leading edge, but it might be a bleeding edge that won’t bear any fruit because the way the commodity costs are structured will change.”

“There’s kind of a wait-and-see approach on some of these bigger investments,” Douglas concurred.

Industrial Conservation Initiative underpins commercial class divide
Turning to the ICI, Class A customers — defined as those with average monthly energy demand of at least 1 megawatt (MW) — encountered some unexpected changes to the program rules during 2020. Meanwhile, Class B customers — encompassing the vast share of commercial properties smaller than about 350,000 square feet — confront the persistent reality of electricity cost allocation that offloads the burden from larger players onto them.

Through the ICI, participating Class A customers pay a share of the global adjustment that’s prorated to their energy use during the five hours of the period from May 1 to April 30 when the highest overall system demand is recorded. This gives Class A customers the opportunity to lock in a favourable factor for calculating their share of monthly system-wide global adjustment costs if they can successful project and curtail energy loads during those five hours of peak demand. On the flipside, Class B customers pay the remainder of those system-wide costs, on a straightforward per-kWh basis, once Class A payments have been reconciled.

“Class B has sometimes been regarded as the forgotten middle child of the customer classes in Ontario where all the shifted costs in the system kind of pile up,” acknowledged Mark Olsheski, vice president, energy and environment, with Sussex Strategy Group. “Likewise, there can be big unpredictable and uncontrollable swings in the global adjustment rate from month to month and, outside of pure energy efficiency, there really is precious little opportunity or empowerment for a Class B customer to take actions to lower their bills.”

Nevertheless, COVID-19 presents a few extra hiccups for Class A customers this year. Conventionally, late May is when they receive notification of the cost allocation factor that would be used to determine their GA for the upcoming July 1 to June 30 period. This year, though, all current ICI participants will retain the factor they secured by responding to the five hours of peak demand during the 12 months from May 1, 2019 to April 30, 2020 after the Ontario government placed a temporary halt on the peak demand response aspect of the program last summer. Regardless, eligible ICI participants must formally opt into the program by June 15 or they will be billed as Class B customers.

Peak chasing resumes for summer 2021
Since peak demand hours conventionally occur from June to September, Class A customers will once again be studying forecasts intently and preparing to respond via Peak Perks as the heat wave season sets in. That should help alleviate some of the system stresses that arose last summer — prompting policy-makers to reject lobbying for a continued pause on peak demand response.

“The policy rationale was to allow consumers to focus on their operations when recovering from COVID as opposed to reducing peaks. The other issue was that we did not expect the peaks to be high last summer given COVID shutdowns,” Christie recounted. “But due to some hot weather, more people at home and also the lack of ICI response, we saw peaks we haven’t seen in many, many years come up last summer. So the peak hiatus has ended and this summer we’ll be back to responding to ICI as per normal.”

Among Class A customers, owners/managers of office and retail facilities generally have the most to lose from a billing formula tied to the energy demand of more densely occupied buildings in the summer of 2019. However, they could be much more competitively positioned for 2022-23 if their buildings remain below full occupancy and energy demand stays lower than usual this summer.

“Where we can improve is the IESO (Independent Electricity System Operator) and the LDCs (local distribution companies) need to help customers get their real-time data, especially in light of the phantom demand issue, interpret their bills and their Class A versus B scenarios much more easily and comprehensively,” urged Lee Hodgkinson, vice president, technical services, sustainability and ESG, with Dream Unlimited. “ I look for APIs (application programming interface) and direct data flow from the LDCs to the building owners so that we can access that data really easily.”

Given Class A’s historic advantages, few eligible ICI participants are expected to migrate out to Class B. From a sustainability perspective, there’s perhaps more cause to question how the ICI’s 1-MW threshold encourages strategies to move in the other direction.

“You could jack up demand in some buildings and get them into Class A basically by firing up the chillers on the weekend and then pouring cooling outside to get rid of it,” Douglas noted. “That has nothing to do with climate change strategy or sustainability, but it’s a cost- saving strategy, and, sometimes, when you look at the math, it’s hundreds of thousands of dollars you can save.”

Brian Hewson, vice president, consumer protection and industry performance with the Ontario Energy Board (OEB), confirmed the OEB is currently scrutinizing the discrepancy that leaves Class B as the only consumer group with no flexibility to curtail energy load during higher-priced periods, and will be providing advice to the Ministry of Energy. In the interim, that status does, at least, simplify tactics.

“Just reduce your kWh and it doesn’t matter what time of day because you’re paying that fixed rate for 24 hours a day. So if you can curb your demand at night, you get a big bang for your dollar,” Rouse advised.

“We do talk about rates a lot, but if you’re not using it, you’re not paying for it,” Flynn agreed. “A lot of our focus is still on really to try to reduce the number of kilowatts that we use. That seems to be the best thing to do.”


Related News

View more

Sign Up for Electricity Forum’s Newsletter

Stay informed with our FREE Newsletter — get the latest news, breakthrough technologies, and expert insights, delivered straight to your inbox.

Electricity Today T&D Magazine Subscribe for FREE

Stay informed with the latest T&D policies and technologies.
  • Timely insights from industry experts
  • Practical solutions T&D engineers
  • Free access to every issue

Download the 2025 Electrical Training Catalog

Explore 50+ live, expert-led electrical training courses –

  • Interactive
  • Flexible
  • CEU-cerified