Third turbine for farm brings smiles

By McClatchy Tribune News


Substation Relay Protection Training

Our customized live online or in‑person group training can be delivered to your staff at your location.

  • Live Online
  • 12 hours Instructor-led
  • Group Training Available
Regular Price:
$699
Coupon Price:
$599
Reserve Your Seat Today
It was a good day to be in the wind-power business.

With wind gusts as high as 40 mph, Glenn Cook, who recently erected his third wind turbine at Cider Hill Farm, said his three turbines generated as much energy in 24 hours as he would typically produce in one week. As communities like Newburyport and Newbury mull the potential of wind power for their communities and work to set up rules to govern them, Cook is ahead of the game.

Almost one year after Cider Hill Farm first erected two wind turbines to help supply the farm with electricity, Cook is praising his now three turbines - the third was added in January - as well as the recent addition of solar panels.

"I love them; I absolutely love them," Cook said. "I would love to be producing 100 percent of our electricity someday through renewable resources."

Right now, between the turbines and the solar panels, that total is closer to about 30 percent. Calling his turbines a "pioneering" project, Cook said they are producing slightly less than what he had expected. A computer-generated model showing the wind speeds at the farm over-estimated what the wind resources would be, Cook said. Cook had hoped to see production at about 700 to 800 kilowatts hours of electricity a month. The turbines have been giving him closer to 600 in the winter.

In the summer, that will drop to about 400 kilowatt hours or less. "I knew they would produce much more in the winter than they do in the summer," he said. "That being said, I love having them. They are still contributing a lot to our bills."

Cook said the turbine model he has, a Bergey, does particularly well in Vermont or in really high locations, such as mountaintops. "Today is a particularly good day for the turbines," Cook said, with the strong wind gusts. Cook checks the meters and sends the turbine readings to the Massachusetts Technology Collaborative once a month. Cider Hill Farm first erected a 120-foot-tall tower last January.

In May, it placed a second, identical tower about 80 feet away from the first. This past January, it placed a third turbine at the base of the hill. A portion of the cost to install the turbines was funded by a Massachusetts Technology Collaborative alternative-energy grant. The solar panels were funded with a grant from the Massachusetts Department of Agricultural Resource's Agricultural Environmental Enhancement Program.

The Cooks installed the solar panels in November. Those are producing even more than he expected, Cook said. The panels produce about 900 kilowatt hours during the winter. Last month, with the days growing longer, Cook said he saw about 1,200 kilowatt hours.

The 56 panels were put up on the main barn by the well-known farm store.

"Everybody will see them," Cook said.

Homeowners would probably get half the number of panels, about 25 to 30, to tend to their electrical needs, Cook said. Last month, the farm had a savings of $180 just from the solar panels, Cook said, an investment they will keep getting results from over the next 20 to 30 years. Cook said he plans to spend the next few months installing a wood-fired boiler for his greenhouses - something that will save him money in fuel costs.

Although the turbines have been set up for a while, the Cooks still get phone calls and visits from people wanting to see them or hear more about the farm's plans.

Eventually, Cook said customers might even be able to visit the space where the meters for the turbines are held to see how the readings are done. "There's still a lot of interest," he said.

Related News

Major U.S. utilities spending more on electricity delivery, less on power production

U.S. Utility Spending Shift highlights rising transmission and distribution costs, grid modernization, and smart meters, while generation expenses decline amid fuel price volatility, capital and labor pressures, and renewable integration across the power sector.


Key Points

A decade-long trend where utilities spend more on delivery and grid upgrades, and less on electricity generation costs.

✅ Delivery O&M, wires, poles, and meters drive rising costs

✅ Generation spending declines amid fuel price changes and PPI

✅ Grid upgrades add reliability, resilience, and renewable integration


Over the past decade, major utilities in the United States have been spending more on delivering electricity to customers and less on producing that electricity, a shift occurring as electricity demand is flat across many regions.

After adjusting for inflation, major utilities spent 2.6 cents per kilowatthour (kWh) on electricity delivery in 2010, using 2020 dollars. In comparison, spending on delivery was 65% higher in 2020 at 4.3 cents/kWh, and residential bills rose in 2022 as inflation persisted. Conversely, utility spending on power production decreased from 6.8 cents/kWh in 2010 (using 2020 dollars) to 4.6 cents/kWh in 2020.

Utility spending on electricity delivery includes the money spent to build, operate, and maintain the electric wires, poles, towers, and meters that make up the transmission and distribution system. In real 2020 dollar terms, spending on electricity delivery increased every year from 1998 to 2020 as utilities worked to replace aging equipment, build transmission infrastructure to accommodate new wind and solar generation amid clean energy transition challenges that affect costs, and install new technologies such as smart meters to increase the efficiency, reliability, resilience, and security of the U.S. power grid.

Spending on power production includes the money spent to build, operate, fuel, and maintain power plants, as well as the cost to purchase power in cases where the utility either does not own generators or does not generate enough to fulfill customer demand. Spending on electricity production includes the cost of fuels including natural gas prices alongside capital, labor, and building materials, as well as the type of generators being built.

Other utility spending on electricity includes general and administrative expenses, general infrastructure such as office space, and spending on intangible goods such as licenses and franchise fees, even as electricity sales declined in recent years.

The retail price of electricity reflects the cost to produce and deliver power, the rate of return on investment that regulated utilities are allowed, and profits for unregulated power suppliers, and, as electricity prices at 41-year high have been reported, these components have drawn increased scrutiny.

In 2021, demand for consumer goods and the energy needed to produce them has been outpacing supply, though power demand sliding in 2023 with milder weather has also been noted. This difference has contributed to higher prices for fuels used by electric generators, especially natural gas. The increased cost for fuel, capital, labor, and building materials, as seen in the U.S. Bureau of Labor Statistics’ Producer Price Index, is increasing the cost of power production for 2021. U.S. average electricity prices have been higher every month of this year compared with 2020, according to our Monthly Electric Power Industry Report.


Related News

View more

Rising Solar and Wind Curtailments in California

California Renewable Energy Curtailment highlights grid congestion, midday solar peaks, limited battery storage, and market constraints, with WEIM participation and demand response programs proposed to balance supply-demand and reduce wasted solar and wind generation.


Key Points

It is the deliberate reduction of solar and wind output when grid limits or low demand prevent full integration.

✅ Grid congestion restricts transmission capacity

✅ Midday solar peaks exceed demand, causing surplus

✅ Storage, WEIM, and demand response mitigate curtailment


California has long been a leader in renewable energy adoption, achieving a near-100% renewable milestone in recent years, particularly in solar and wind power. However, as the state continues to expand its renewable energy capacity, it faces a growing challenge: the curtailment of excess solar and wind energy. Curtailment refers to the deliberate reduction of power output from renewable sources when the supply exceeds demand or when the grid cannot accommodate the additional electricity.

Increasing Curtailment Trends

Recent data from the U.S. Energy Information Administration (EIA) highlights a concerning upward trend in curtailments in California. In 2024, the state curtailed a total of 3,102 gigawatt-hours (GWh) of electricity generated from solar and wind sources, surpassing the 2023 total of 2,660 GWh. This represents a 32.4% increase from the previous year. Specifically, 2,892 GWh were from solar, and 210 GWh were from wind, marking increases of 31.2% and 51.1%, respectively, compared to the first nine months of 2023.

Causes of Increased Curtailment

Several factors contribute to the rising levels of curtailment:

  1. Grid Congestion: California's transmission infrastructure has struggled to keep pace with the rapid growth of renewable energy sources. This congestion limits the ability to transport electricity from generation sites to demand centers, leading to curtailment.

  2. Midday Solar Peaks: Amid California's solar boom, solar energy production typically peaks during the midday when electricity demand is lower. This mismatch between supply and demand results in excess energy that cannot be utilized, necessitating curtailment.

  3. Limited Energy Storage: While battery storage technologies are advancing, California's current storage capacity is insufficient to absorb and store excess renewable energy for later use. This limitation exacerbates curtailment issues.

  4. Regulatory and Market Constraints: Existing market structures and regulatory frameworks may not fully accommodate the rapid influx of renewable energy, leading to inefficiencies and increased curtailment.

Economic and Environmental Implications

Curtailment has significant economic and environmental consequences. For renewable energy producers, curtailed energy represents lost revenue and undermines the economic viability of new projects. Environmentally, curtailment means that clean, renewable energy is wasted, and the grid may rely more heavily on fossil fuels to meet demand, counteracting the benefits of renewable energy adoption.

Mitigation Strategies

To address the rising curtailment levels, California is exploring several strategies aligned with broader decarbonization goals across the U.S.:

  • Grid Modernization: Investing in and upgrading transmission infrastructure to alleviate congestion and improve the integration of renewable energy sources.

  • Energy Storage Expansion: Increasing the deployment of battery storage systems to store excess energy during peak production times and release it during periods of high demand.

  • Market Reforms: Participating in the Western Energy Imbalance Market (WEIM), a real-time energy market that allows for the balancing of supply and demand across a broader region, helping to reduce curtailment.

  • Demand Response Programs: Implementing programs that encourage consumers to adjust their energy usage patterns, such as shifting electricity use to times when renewable energy is abundant.

Looking Ahead

As California continues to expand its renewable energy capacity, addressing curtailment will be crucial to ensuring the effectiveness and sustainability of its energy transition. By investing in grid infrastructure, energy storage, and market reforms, the state can reduce curtailment levels and make better use of its renewable energy resources, while managing challenges like wildfire smoke impacts on solar output. These efforts will not only enhance the economic viability of renewable energy projects but also contribute to California's 100% clean energy targets by maximizing the use of clean energy and reducing reliance on fossil fuels.

While California's renewable energy sector faces challenges related to curtailment, proactive measures and strategic investments can mitigate these issues, as scientists continue to improve solar and wind power through innovation, paving the way for a more sustainable and efficient energy future.


Related News

View more

Hydro One will keep running its U.S. coal plant indefinitely, it tells American regulators

Hydro One-Avista Merger outlines a utility acquisition shaped by Washington regulators, Colstrip coal plant depreciation, and plans for renewables, clean energy, and emissions cuts, while Montana reviews implications for jobs, ratepayers, and a 2027 closure.


Key Points

A utility deal setting Colstrip depreciation and renewables, without committing to an early coal plant closure.

✅ Washington sets 2027 depreciation for Colstrip units

✅ Montana reviews jobs, ratepayer impacts, community fund

✅ Avista seeks renewables; no binding shutdown commitment


The Washington power company Hydro One is buying will be ready to close its huge coal-fired generating station ahead of schedule, thanks to conditions put on the corporate merger by state regulators there.

Not that we actually plan to do that, the company is telling other regulators in Montana, where coal unit retirements are under debate, the huge coal-fired generating station in question employs hundreds of people. We’ll be in the coal business for a good long time yet.

Hydro One, in which the Ontario government now owns a big minority stake, is still working on its purchase of Avista, a private power utility based in Spokane. The $6.7-billion deal, which Hydro One announced in July, includes a 15 per cent share in two of the four generating units in a coal plant in Colstrip, Montana, one of the biggest in the western United States. Avista gets most of its electricity from hydro dams and gas but uses the Colstrip plant when demand for power is high and water levels at its dams are low.

#google#

Colstrip’s a town of fewer than 2,500 people whose industries are the power plant and the open-pit mines that feed it about 10 million tonnes of coal a year. Two of Colstrip’s generators, older ones Avista doesn’t have any stake in, are closing in 2022. The other two will be all that keep the town in business.

In Washington, they don’t like the coal plant and its pollution. In Montana, the future of Colstrip is a much bigger concern. The companies have to satisfy regulators in both places that letting Hydro One buy Avista is in the public interest.

Ontario proudly closed the last of our coal plants in 2014 and outlawed new ones as environmental menaces, and Alberta's coal phase-out is now slated to finish by 2023. When Hydro One said it was buying Avista, which makes about $100 million in profit a year, Premier Kathleen Wynne said she hoped Ontario’s “value system” would spread to Avista’s operations.

The settlement is “an important step towards bringing together two historic companies,” Hydro One’s chief executive Mayo Schmidt said in announcing it.

The deal has approval from the Washington Utilities and Transportation Commission staff but is subject to a vote by the group’s three commissioners. It doesn’t commit Avista to closing anything at Colstrip or selling its share. But Avista and Hydro One will budget as if the Colstrip coal burners will close in 2027, instead of running into the 2040s as their owners had once planned, a timeline that echoes debates over the San Juan Generating Station in New Mexico.

In accounting terms, they’ll depreciate the value of their share of the plant to zero over the next nine years, reflecting what they say is the end of the plant’s “useful life.” Another of Colstrip’s owners, Puget Sound Energy, has previously agreed with Washington regulators that it’ll budget for a Colstrip closure in 2027 as well.

Avista and Hydro One will look for sources of 50 megawatts of renewable electricity, including independent power projects where feasible, in the next four years and another 90 megawatts to supplement Avista’s supply once the Colstrip plant eventually closes, they promise in Washington. They’ll put $3 million into a “community transition fund” for Colstrip.

The money will come from the companies’ profits and cash, the agreement says. “Hydro One will not seek cost recovery for such funds from ratepayers in Ontario,” it says specifically.

“Ontario has always been a global leader in the transition away from dirty coal power and towards clean energy,” said Doug Howell, an anti-coal campaigner with the Sierra Club, which is a party to the agreement. “This settlement continues that tradition, paving the way for the closure of the largest single source of climate pollution in the American West by 2027, if not earlier.”

Montanans aren’t as thrilled. That state has its own public services commission, doing its own examination of the corporate merger, which has asked Hydro One and Avista to explain in detail why they want to write off the value of the Colstrip burners early. The City of Colstrip has filed a petition saying it wants in on Montana hearings because “the potential closure of (Avista’s units) would be devastating to our community.”

Don’t get too worked up, an Avista vice-president urged the Montana commission just before Easter.

“Just because an asset is depreciated does not mean that one would otherwise remove that asset from service if the asset is still performing as intended,” Jason Thackston testified in a session that dealt only with what the deal with Washington state would mean to Colstrip. We’re talking strictly about an accounting manoeuvre, not an operational commitment.

Six joint owners will have to agree to close the Colstrip generators and there’s “no other tacit understanding or unstated agreement” to do that, he said.

Besides Washington and Montana, state regulators in Idaho, including those overseeing the Idaho Power settlement process, Alaska and Oregon and multiple federal authorities have to sign off on the deal before it can happen. Hydro One hopes it’ll be done in the second half of this year.


Related News

View more

Learn how fees and usage impacts your electricity bill in new online CER tool

CER Interactive Electricity Bill Tool compares provincial electricity prices, fees, taxes, and usage. Explore household appliance costs, hydroelectric generation, and consumption trends across Canada with interactive calculators and a province-by-province breakdown.


Key Points

An online CER report with calculators comparing electricity prices, fees, and usage to explain household energy costs.

✅ Province-by-province bill, price, and consumption comparison

✅ Calculator for appliance and electronics energy costs

✅ Explains fees, taxes, regulation, and generation sources


Canadians have a new way to assess their electricity bill in a new, interactive online report released by the Canada Energy Regulator (CER).

The report titled What is in a residential electricity bill? features a province-to-province comparison of electricity bills, generation and consumption. It also explains electricity prices across the country, including how Calgary electricity prices have changed, allowing people to understand why costs vary depending on location, fees, regulation and taxes.  

Learn how fees and usage impacts your electricity bill in new online CER tool
Interactive tools allow people to calculate the cost of household appliances and electronic use for each province and territory, and to understand how Ontario rate increases may affect monthly bills. For example, an individual can use the tools to find out that leaving a TV on for 24-hours in Quebec costs $5.25 per month, while that same TV on for a whole day would cost $12.29 per month in Saskatchewan, $20.49 per month in the Northwest Territories, and $15.30 per month in Nova Scotia.

How Canadians use energy varies as much as how provinces and territories produce it, especially in regions like Nunavut where unique conditions influence costs. Millions of Canadians rely on electricity to power their household appliances, charge their electronics, and heat their homes. Provinces with abundant hydro-electric resources like Quebec, B.C., Manitoba, and Newfoundland and Labrador use electricity for home heating and tend to consume the most electricity.

By gathering data from various sources, this report is the first Canadian publication that features interactive tools to allow for a province-by-province comparison of electricity bills while highlighting different elements within an electricity bill, a helpful context as Canada faces a critical supply crunch in the years ahead.

The CER monitors energy markets and assesses Canadian energy requirements and trends, including clean electricity regulations developments that shape pricing. This report is part of a portfolio of publications on energy supply, demand and infrastructure that the CER publishes regularly as part of its ongoing market monitoring.

"No matter where you go in the country, Canadians want to know how much they pay for power and why, especially amid price spikes in Alberta this year," says lead author Colette Craig. "This innovative, interactive report really explains electricity bills to help everyone understand electricity pricing and consumption across Canada."

Quick Facts

  • Quebec ranks first in electricity consumption per capita at 21.0 MW.h, followed by Saskatchewan at 20.0 MW.h, Newfoundland and Labrador at 19.3 MW.h.
  • About 95% of Quebec's electricity is produced from hydroelectricity.
  • Provinces that use electricity for home heating tend to consume the most electricity.
  • Canada's largest consuming sector for electricity was industrial at 238 TW.h. The residential and commercial sectors consumed 168 TW.h and 126 TW.h, respectively.
  • In 2018, Canada produced 647.7 terawatt hours (TW.h) of electricity. More than half of the electricity in Canada (61%) is generated from hydro sources. The remainder is produced from a variety of sources, such as fossil fuels (natural gas and petroleum), nuclear, wind, coal, biomass, solar.
  • Canada is a net exporter of electricity. In 2019, net exports to the U.S. electricity market totaled 47.0 TW.h.
  • The total value of Canada's electricity exports was $2.5 billion Canadian dollars and the value of imports was $0.6 billion Canadian dollars, resulting in 2019 net exports of $1.9 billion.
  • All regions in Canada are reflected in this report but it does not include data that reflects the COVID-19 lockdown and its effects on residential electricity bills.


Related News

View more

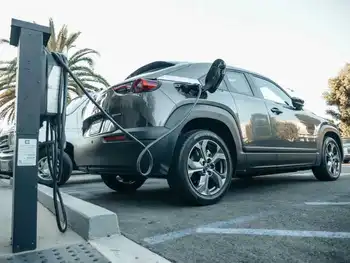
Atlantic Canadians less charged up to buy electric vehicle than rest of Canada

Atlantic Canada EV adoption lags, a new poll finds, as fewer buyers consider electric vehicles amid limited charging infrastructure, lower provincial rebates, and affordability pressures in Nova Scotia and Newfoundland compared to B.C. and Quebec.


Key Points

Atlantic Canada EV adoption reflects demand, shaped by rebates, charging access, costs, and the regional energy mix.

✅ Poll shows lowest purchase intent in Atlantic Canada

✅ Lack of rebates and charging slows EV consideration

✅ Income and energy mix affect affordability and benefits


Atlantic Canadians are the least likely to buy a car, truck or SUV in the next year and the most skittish about going electric, according to a new poll. 

Only 31 per cent of Nova Scotians are looking at buying a new or used vehicle before December 2021 rolls around. And just 13 per cent of Newfoundlanders who are planning to buy are considering an electric vehicle. Both those numbers are the lowest in the country. Still, 47 per cent of Nova Scotians considering buying in the next year are thinking about electric options, according to the numbers gathered online by Logit Group and analyzed by Halifax-based Narrative Research. That compares to 41 per cent of Canadians contemplating a vehicle purchase within the next year, with 54 per cent of them considering going electric. 

“There’s still a high level of interest,” said Margaret Chapman, chief operating officer at Narrative Research.  

“I think half of people who are thinking about buying a vehicle thinking about electric is pretty significant. But I think it’s a little lower in Atlantic Canada compared to other parts of the country probably because the infrastructure isn’t quite what it might be elsewhere. And I think also it’s the availability of vehicles as well. Maybe it just hasn’t quite caught on here to the extent that it might have in, say, Ontario or B.C., where the highest level of interest is.” 


Provincial rebates
Provincial rebates also serve to create more interest, she said, citing New Brunswick's rebate program as an example in the region. 

“There’s a $7,500 rebate on top of the $5,000 you get from the feds in B.C. But in Nova Scotia there’s no provincial rebate,” Chapman said. “So I think that kind of thing actually is significant in whether you’re interested in buying an electric vehicle or not.” 

The survey was conducted online Nov. 11–13 with 1,231 Canadian adults. 

Of the people across Canada who said they were not considering an electric vehicle purchase, 55 per cent said a provincial rebate would make them more likely to consider one, she said.  

In Nova Scotia, that number drops to 43 per cent. 

Nova Scotia families have the lowest median after-tax income in the country, according to numbers released earlier this year.  

The national median in 2018 was $61,400, according to Statistics Canada. Nova Scotia was at the bottom of the pack with $52,200, up from $51,400 in 2017. 

So big price tags on electric vehicles might put them out of reach for many Nova Scotians, and a recent cost-focused survey found similar concerns nationwide. 

“I think it’s probably that combination of cost and infrastructure,” Chapman said. 

“But you saw this week in the financial update from the federal government that they’re putting $150 million into new charging station, so were some of that cash to be spread in Atlantic Canada, I’m sure there would be an increase in interest … The more charging stations around you see, you think ‘Alright, it might not be so hard to ensure that I don’t run out of power for my car.’ All of that stuff I think will start to pick up. But right now it is a little bit lagging in Atlantic Canada, and in Labrador infrastructure still lags despite a government push in N.L. to expand EVs.” 


'Simple dollars and cents'
The lack of a provincial government rebate here for electric vehicles definitely factors into the equation, said Sean O’Regan, president and chief executive officer of O'Regan's Automotive Group.  

“Where you see the highest adoption are in the provinces where there are large government rebates,” he said. “It’s a simple dollars and cents (thing). In Quebec, when you combine the rebates it’s up to over $10,000, if not $12,000, towards the car. If you can get that kind of a rebate on a car, I don’t know that it would matter much what it was – it would help sell it.” 

A lot of people who want to buy electric cars are trying to make a conscious decision about the environment, O’Regan said. 

While Nova Scotia Power is moving towards renewable energy, he points out that much of our electricity still comes from burning coal and other fossil fuels, and N.L. lags in energy efficiency as the region works to improve.  

“So the power that you get is not necessarily the cleanest of power,” O’Regan said. “The green advantage is not the same (in Nova Scotia as it is in provinces that produce a lot of hydro power).” 

Compared to five years ago, the charging infrastructure here is a lot better, he said. But it doesn’t compare well to provinces including Quebec and B.C., though Newfoundland recently completed its first fast-charging network for electric car owners. 

“Certainly (with) electric cars – we're selling more and more and more of them,” O'Regan said, noting the per centage would be in the single digits of his overall sales. “But you're starting from zero a few years ago.” 

The highest number of people looking at buying electric cars was in B.C., with 57 per cent of those looking at buying a car saying they’d go electric, and even in southern Alberta interest is growing; like Bob Dylan in 1965 at the Newport Folk Festival.  

“The trends move from west to east across Canada,” said Jeff Farwell, chief executive officer of the All EV Canada electric car store in Burnside.  

“I would use the example of the craft beer market. It started in B.C. about 15 years before it finally went crazy in Nova Scotia. And if you look at Vancouver right now there’s (electric vehicles) everywhere.” 


Expectations high
Farwell expects electric vehicle sales to take off faster in Atlantic Canada than the craft beer market. “A lot faster.” 

His company also sells used electric vehicles in Prince Edward Island and is making moves to set up in Moncton, N.B. 

He’s been talking to Nova Scotia’s Department of Energy and Mines about creating rebates here for new and used electric vehicles. 

 “I guess they’re interested, but nothing’s happened,” Farwell said.  

Electric vehicles require “a bit of a lifestyle change,” he said. 

“The misconception is it takes a lot longer to charge a vehicle if it’s electric and gas only takes me 10 minutes to fill up at the gas station,” Farwell said.  

“The reality is when I go home at night, I plug my vehicle in,” he said. “I get up in the morning and I unplug it and I never have to think about it. It takes two seconds.”  


Related News

View more

Ottawa sets out to protect its hydro heritage

Ottawa Hydro Substation Heritage Designation highlights Hydro Ottawa's 1920s architecture, Art Deco facades, and municipal utility history, protecting key voltage-reduction sites in Glebe, Carling-Merivale, Holland, King Edward, and Old Ottawa South.


Key Points

A city plan to protect Hydro Ottawa's 1920s substations for architecture, utility role, and civic electrical heritage.

✅ Protects five operating voltage-reduction sites citywide

✅ Recognizes Art Deco and early 20th century utility architecture

✅ Allows emergency demolition to ensure grid safety


The city of Ottawa is looking to designate five hydro substations built nearly a century ago as heritage structures, a move intended to protect the architectural history of Ottawa's earliest forays into the electricity business, even as Ottawa electricity consumption has shifted in recent years.

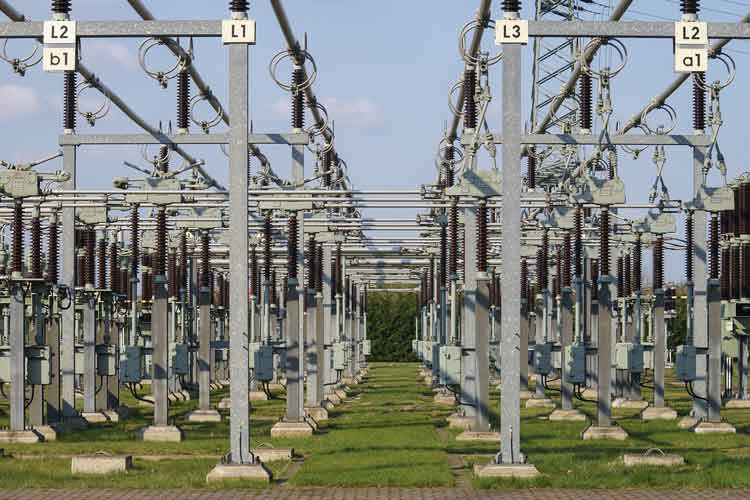
All five buildings are still used by Hydro Ottawa to reduce the voltage coming from transmission lines before the electricity is transmitted to homes and businesses, and when severe weather causes outages, Sudbury Hydro crews work to reconnect service across communities.

Electricity came to Ottawa in 1882 when two carbon lamps were installed on LeBreton Flats, heritage planner Anne Fitzpatrick told the city's built heritage subcommittee on Tuesday. It became a lucrative business, and soon a privately owned monopoly that drew public scrutiny similar to debates over retroactive charges in neighboring jurisdictions.

In 1905, city council held a special meeting to buy the electrical company, which led to a dramatic drop in electricity rates for residents, a contrast with recent discussions about peak hydro rates for self-isolating customers.

The substations are now owned by Hydro Ottawa, which agreed to the heritage designations on the condition it not be prevented from emergency demolitions if it needs to address incidents such as damaging storms in Ontario while it works to "preserve public safety and the continuity of critical hydro electrical services."

Built in 1922, the substation at the intersection of Glebe and Bronson avenues was the first to be built by the new municipal electrical department, long before modern battery storage projects became commonplace on Ontario's grid.

The largest of the substations being protected dates back to 1929 and is found at the corner of Carling Avenue and Merivale Road. It was built to accommodate a growing population in areas west of downtown including Hintonburg and Mechanicsville.

The substation on Holland Avenue near the Queensway is different from the others because it was built in 1924 to serve the Ottawa Electric Railway Company. The streetcar company operated from 1891 to 1959, and urban electrical infrastructure can face failures such as the Hydro-Québec manhole fire that left thousands without power.

This substation on King Edward Avenue was built in 1931 and designed by architect William Beattie, who also designed York Street Public School in Lowertown and the substation on Carling Avenue. 

The last substation to be built in a 'bold and decorative style' is at 39 Riverdale Ave. in Old Ottawa South, according to city staff. It was designed in an Art Deco style by prominent architect J. Albert Ewart, who was also behind the Civic Hospital and nearby Southminster Church on Bank Street.


Related News

View more

Sign Up for Electricity Forum’s Newsletter

Stay informed with our FREE Newsletter — get the latest news, breakthrough technologies, and expert insights, delivered straight to your inbox.

Electricity Today T&D Magazine Subscribe for FREE

Stay informed with the latest T&D policies and technologies.
  • Timely insights from industry experts
  • Practical solutions T&D engineers
  • Free access to every issue

Download the 2025 Electrical Training Catalog

Explore 50+ live, expert-led electrical training courses –

  • Interactive
  • Flexible
  • CEU-cerified