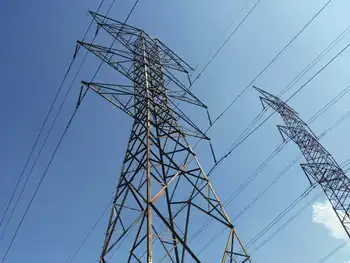
Alternate energy costs pressure power rates

By The Oregonian


High Voltage Maintenance Training Online

Our customized live online or in‑person group training can be delivered to your staff at your location.

  • Live Online
  • 12 hours Instructor-led
  • Group Training Available
Regular Price:
$599
Coupon Price:
$499
Reserve Your Seat Today
Big investments in renewable energy could mean higher electric bills, hitting households and businesses during high unemployment and a weak economy.

Oregon's biggest electric companies, PacifiCorp and Portland General Electric, filed for rate increases recently with state utility regulators.

Both cited renewable energy projects as the reason. If approved by the Oregon Public Utility Commission, the raises would take effect in early 2010, The Oregonian said.

PacifiCorp wants a $92.1 million increase, or 9.1 percent, which would add an average of $5.12 to a residential customers monthly bill, which is at about $82.85 for 950 kilowatt-hours per month.

PGE's investment in renewable energy at Biglow Canyon translates to a request for a 2.3 percent increase for retail customers, totaling $41.3 million.

But PGE's prices may decrease slightly because prices for power are falling, resulting in an offsetting filing for a $46.8 million decrease, PGE said.

Steve Corson of PGE said the impact of the two filings on the average, 900-kilowatt-hour customer would be a few cents a month, to the customer's advantage.

Some groups say rate hikes resulting from the shift to alternative energy sources will become common as utility companies build wind farms and solar systems to meet state guidelines.

Costs associated with renewables, primarily wind, are high, said Michael Early, executive director of Industrial Customers of Northwest Utilities, tagged with some of the steepest hikes.

"We have a renewable energy portfolio, but it doesn't come without a cost."

Under PacifiCorp's request, industrial customers would get some of the biggest rate jumps at 13.7 percent.

The rate case is the first for PacifiCorp since 2006, when the electric utility requested an increase of 13.2 percent and got about 5 percent.

Since 2006, Oregon's portion of the company's investments in electric plants and other capital projects has grown by $500 million, said Bill Griffith, director of pricing.

PacifiCorp has invested in two natural gas generating plants in Washington and Utah and three new wind facilities in Wyoming.

Griffith said industrial customers are being asked to pay more because they have the most need for more electricity.

"Their lights are always on," Griffith said. "Most of the cost is generation and transmission, and that's a larger proportion of the industrial customers' bill."

But to Early, who represents 38 manufacturers, the extra burden doesn't match the flat growth of the industrial sector.

"The industrial load is not growing," Early said. "If there's growth, it's coming from other sectors. It's a bad time for any rate increase. The long-term implication for the economy and the manufacturing sector is difficult."

In addition, PacifiCorp wants an increase in its authorized profit margins from 10 percent to 11 percent.

Bob Jenks, executive director of the Citizens' Utility Board, said it was unlikely the state utility commission would approve the profit increase.

"We think it's an outrage considering the state of the economy," Jenks said.

Portland General Electric raised rates by 5.6 percent starting this year. The average monthly bill for a PGE customer using 900 kilowatt-hours of electricity grew from $88.21 to $93.59.

Related News

Analysis: Why is Ontario’s electricity about to get dirtier?

Ontario electricity emissions forecast highlights rising grid CO2 as nuclear refurbishments and the Pickering closure drive more natural gas, limited renewables, and delayed Quebec hydro imports, pending advances in storage and transmission upgrades.


Key Points

A projection that Ontario's grid CO2 will rise as nuclear units refurbish or retire, increasing natural gas use.

✅ Nuclear refurbs and Pickering shutdown cut zero-carbon baseload

✅ Gas plants fill capacity gaps, boosting GHG emissions

✅ Quebec hydro imports face cost, transmission, and timing limits


Ontario's energy grid is among the cleanest in North America — but the province’s nuclear plans mean that some of our progress will be reversed over the next decade.

What was once Canada’s largest single source of greenhouse-gas emissions is now a solar-power plant. The Nanticoke Generating Station, a coal-fired power plant in Haldimand County, was decommissioned in stages from 2010 to 2013 — and even before the last remaining structures were demolished earlier this year, Ontario Power Generation had replaced its nearly 4,000 megawatts with a 44-megawatt solar project in partnership with the Six Nations of the Grand River Development Corporation and the Mississaugas of the Credit First Nation.

But neither wind nor solar has done much to replace coal in Ontario’s hydro sector, a sign of how slowly Ontario is embracing clean power in practice across the province. At Nanticoke, the solar panels make up less than 2 per cent of the capacity that once flowed out to southern Ontario over high-voltage transmission lines. In cleaning up its electricity system, the province relied primarily on nuclear power — but the need to extend the nuclear system’s lifespan will end up making our electricity dirtier again.

“We’ve made some pretty great strides since 2005 with the fuel mix,” says Terry Young, vice-president of corporate communications at the Independent Electricity System Operator, the provincial agency whose job it is to balance supply and demand in Ontario’s electricity sector. “There have been big changes since 2005, but, yes, we will see an increase because of the closure of Pickering and the refurbs coming.”

“The refurbs” is industry-speak for the major rebuilds of both the Darlington and Bruce nuclear-power stations. The two are both in the early stages of major overhauls intended to extend their operating lives into the 2060s: in the coming years, they’ll be taken offline and rebuilt. (The Pickering nuclear plant will not be refurbished and will shut down in 2024.)

The catch is that, as the province loses its nuclear capacity in increments, Ontario will be short of electricity in the coming years and the IESO will need to find capacity elsewhere to make sure the lights stay on. And that could mean burning a lot more natural gas — and creating more greenhouse-gas emissions.

According to the IESO’s planning assumptions, electricity will be responsible for 11 megatonnes of greenhouse-gas emissions annually by 2035 (last year, it was three megatonnes). That’s the “reference case” scenario: if conservation and efficiency policies shave off some electricity demand, we could get it down to something like nine megatonnes. But if demand is higher than expected, it could be as high as 13 megatonnes — more than quadruple Ontario’s 2018 emissions.

Even in the worst-case scenario, the province’s emissions from electricity would still be less than half of what they were in 2005, before the province began phasing out its coal generation. But it’s still a reversal of a trend that both Liberals and Progressive Conservatives have boasted about — the Liberals to justify their energy policies, the PCs to justify their hostility to a federal carbon tax.

Young emphasized that technology can change and that the IESO’s planning assumptions are just that: projections based on the information available today. A revolution in electricity storage could make it possible to store the province’s cleaner power sources overnight for use during the day, but that’s still only in the realm of speculation — and the natural-gas infrastructure exists in the real world, today.

Ontario Power Generation — the Crown corporation that operates many of the province’s power plants, including Pickering and Darlington — recently bought four gas plants, two of them outright (two it already owned in part). All were nearly complete or already operational, so the purchase itself won’t change the province’s emissions prospects. Rather, OPG is simply looking to maintain its share of the electricity market after the Pickering shutdown.

“It will allow us to maintain our scale, with the upcoming end of Pickering’s commercial operations, so that we can continue our role as the driver of Ontario’s lower carbon future,” Neal Kelly, OPG’s director of media, issues, and management, told TVO.org via email. “Further, there is a growing need for flexible gas fired generation to support intermittent wind and solar generation.”

The shift to more gas-fired generation has been coming for a while, and critics say that Ontario has missed an opportunity to replace the lost Pickering capacity with something cleaner. MPP Mike Schreiner, leader of the Green party, has argued for years that Ontario should have pursued an agreement with Quebec to import clean hydroelectricity.

“To me, it’s a cost-effective solution, and it’s a zero-emissions solution,” Schreiner says. “Regardless of your position on sources of electricity, I think everyone could agree that waterpower from Quebec is going to be less expensive.”

Quebec is eager to sell Ontario its surplus hydro power, but not everyone agrees that importing power would be cheaper. A study published by the Ontario Chamber of Commerce (and commissioned by Ontario Power Generation) calls the claim a “myth” and states that upgrading electric-transmission wires between Ontario and Quebec would cost $1.2 billion and take 10 years, while some estimates suggest fully greening Ontario's grid would cost far more overall.

With Quebec imports seemingly a non-starter and major changes to Ontario’s nuclear fleet already underway, there’s only one path left for this province’s greenhouse-gas emissions: upwards.


Related News

View more

India is now the world’s third-largest electricity producer

India Electricity Production 2017 surged to 1,160 BU, ranking third globally; rising TWh output with 334 GW capacity, strong renewables and thermal mix, 7% CAGR in generation, and growing demand, investments, and FDI inflows.


Key Points

India's 2017 power output reached 1,160 BU, third globally, supported by 334 GW capacity, rising renewables, and 7% CAGR.

✅ 1,160 BU generated; third after China and the US

✅ Installed capacity 334 GW; 65% thermal, rising renewables

✅ Generation CAGR ~7%; demand, FDI, investments rising


India now generates around 1,160.1 billion units of electricity in financial year 2017, up 4.72% from the previous year, and amid surging global electricity demand that is straining power systems. The country is behind only China which produced 6,015 terrawatt hours (TWh. 1 TW = 1,000,000 megawatts) and the US (4,327 TWh), and is ahead of Russia, Japan, Germany, and Canada.


India’s electricity production grew 34% over seven years to 2017, and the country now produces more energy than Japan and Russia, which had 27% and 8.77% more electricity generation capacity installed, respectively, than India seven years ago.

India produced 1,160.10 billion units (BU) of electricity–one BU is enough to power 10 million households (one household using average of about 3 units per day) for a month–in financial year (FY) 2017. Electricity production stood at 1,003.525 BU between April 2017-January 2018, according to a February 2018 report by India Brand Equity Foundation (IBEF), a trust established by the commerce ministry.

#google#

With a production of 1,423 BU in FY 2016, India was the third largest producer and the third largest consumer of electricity in the world, behind China (6,015 BU) and the United States (4,327 BU).

With an annual growth rate of 22.6% capacity addition over a decade to FY 2017, renewables beat other power sources–thermal, hydro and nuclear. Renewables, however, made up only 18.79% of India’s energy, up 68.65% since 2007, and globally, low-emissions sources are expected to cover most demand growth in the coming years. About 65% of installed capacity continues to be thermal.

As of January 2018, India has installed power capacity of 334.4 gigawatt (GW), making it the fifth largest installed capacity in the world after European Union, China, United States and Japan, and with much of the fleet coal-based, imported coal volumes have risen at times amid domestic supply constraints.

The government is targeting capacity addition of around 100 GW–the current power production of United Kingdom–by 2022, as per the IBEF report.


Electricity generation grew at 7% annually

India achieved a 34.48% growth in electricity production by producing 1,160.10 BU in 2017 compared to 771.60 BU in 2010–meaning that in these seven years, electricity production in India grew at a compound annual growth rate (CAGR) of 7.03%, while thermal power plants' PLF has risen recently amid higher demand and lower hydro.


Generation capacity grew at 10% annually

Of 334.5 GW installed capacity as of January 2018–up 60% from 132.30 GW in 2007–thermal installed capacity was 219.81 GW. Hydro and renewable energy installed capacity totaled 44.96 GW and 62.85 GW, respectively, said the report.

The CAGR in installed capacity over a decade to 2017 was 10.57% for thermal power, 22.06% for renewable energy–the fastest among all sources of power–2.51% for hydro power and 5.68% for nuclear power.


Growing demand, higher investments will drive future growth

Growing population and increasing penetration of electricity connections, along with increasing per-capita usage would provide further impetus to the power sector, said the report.

Power consumption is estimated to increase from 1,160.1 BU in 2016 to 1,894.7 BU in 2022, as per the report, though electricity demand fell sharply in one recent period.

Increasing investment remained one of the driving factors of power sector growth in the country.

Power sector has a 100% foreign direct investment (FDI) permit, which boosted FDI inflows in the sector.

Total FDI inflows in the power sector reached $12.97 billion (Rs 83,713 crore) during April 2000 to December 2017, accounting for 3.52% of FDI inflows in India, the report said.


Related News

View more

WY Utility's First Wind Farm Faces Replacement

Foote Creek I Wind Farm Repowering upgrades Wyoming turbines with new nacelles, towers, and blades, cutting 68 units to 12 while sustaining 41.6 MW, under PacifiCorp and Rocky Mountain Power's Energy Vision 2020 plan.


Key Points

Replacement at Foote Creek Rim I, cutting to 12 turbines while sustaining about 41.6 MW using modern 2-4.2 MW units.

✅ 12 turbines replace 68, output steady near 41.6 MW

✅ New nacelles, towers, blades; taller 500 ft turbines

✅ Part of PacifiCorp Energy Vision 2020 and Gateway West


A Wyoming utility company has filed a permit to replace its first wind farm—originally commissioned in 1998, composed of over 65 turbines—amid new gas capacity competing with nuclear in Ohio, located at Foote Creek Rim I. The replacement would downsize the number of turbines to 12, which would still generate roughly the same energy output.

According to the Star Tribune, PacifiCorp’s new installation would involve new nacelles, new towers and new blades. The permit was filed with Carbon County.


New WY Wind Farm

The replacement wind turbines will stand more than twice as tall as the old: Those currently installed stand 200 feet tall, whereas their replacements will tower closer to 500 feet. Though this move is part of the company’s overall plan to expand its state wind fleet as some utilities respond to declining coal returns in the Midwest, the work going into the Foote Creek site is somewhat special, noted David Eskelsen, spokesperson for Rocky Mountain Power, the western arm of PacifiCorp.

“Foote Creek I repowering is somewhat different from the repowering projects announced in the (Energy Vision) 2020 initiative,” he said. “Foote Creek is a complete replacement of the existing 68 foundations, towers, turbine nacelles and rotors (blades).”

Currently, the turbines at Foote Creek have 600 kilowatts capacity each; the replacements’ maximum production ranges from 2 megawatts to 4.2 megawatts each, with the total output remaining steady at 41.4 megawatts, a scale similar to a 30-megawatt wind expansion in Eastern Kings, though there will be a slight capacity increase to 41.6 megawatts, according to the Star Tribune.

As part of the wind farm repowering initiative, PacifiCorp is to become full owner and operator of the Foote Creek site. When the farm was originally built, an Oregon-based water and electric board was 21 percent owner; 37 percent of the project’s output was tied into a contract with the Bonneville Power Administration.

Otherwise, PacifiCorp is moving to further expand its state wind fleet in line with initiatives like doubling renewable electricity by 2030 in Saskatchewan, with the addition of three new wind farms—to be located in Carbon, Albany and Converse counties—which may add up to 1,150 megawatts of power.

According to PacifiCorp, the company has more than 1,000 megawatts of owned wind generation capability, along with long-term purchase agreements for more than 600 megawatts from other wind farms owned by other entities. Energy Vision 2020 refers to a $3.5 billion investment and company move that is looking to upgrade the company's existing wind fleet with newer technology, adding 1,150 megawatts of new wind resources by 2020 and a a new 140-mile Gateway West transmission segment in Wyoming, comparable to a transmission project in Missouri just energized.


Related News

View more

COVID-19: Daily electricity demand dips 15% globally, says report

COVID-19 Impact on Electricity Demand, per IEA data, shows 15% global load drop from lockdowns, with residential use up, industrial and service sectors down; fossil fuel generation fell as renewables and photovoltaics gained share.


Key Points

An overview of how lockdowns cut global power demand, boosted residential use, and increased the renewable share.

✅ IEA review shows at least 15% dip in daily global electricity load

✅ Lockdowns cut commercial and industrial demand; homes used more

✅ Fossil fuels fell as renewables and PV generation gained share


The daily demand for electricity dipped at least 15 per cent across the globe, according to Global Energy Review 2020: The impacts of the COVID-19 crisis on global energy demand and CO2 emissions, a report published by the International Energy Agency (IEA) in April 2020, even as global power demand surged above pre-pandemic levels.

The report collated data from 30 countries, including India and China, that showed partial and full lockdown measures adopted by them were responsible for this decrease.

Full lockdowns in countries — including France, Italy, India, Spain, the United Kingdom where daily demand fell about 10% and the midwest region of the United States (US) — reduced this demand for electricity.


Reduction in electricity demand after lockdown measures (weather corrected)


Source: Global Energy Review 2020: The impacts of the COVID-19 crisis on global energy demand and CO2 emissions, IEA


Drivers of the fall

There was, however, a spike in residential demand for electricity as a result of people staying and working from home. This increase in residential demand, though, was not enough to compensate for reduced demand from industrial and commercial operations.

The extent of reduction depended not only on the duration and stringency of the lockdown, but also on the nature of the economy of the countries — predominantly service- or industry-based — the IEA report said.

A higher decline in electricity demand was noted in countries where the service sector — including retail, hospitality, education, tourism — was dominant, compared to countries that had industrial economies.

The US, for example — where industry forms only 20 per cent of the economy — saw larger reductions in electricity demand, compared to China, where power demand dropped as the industry accounts for more than 60 per cent of the economy.

Italy — the worst-affected country from COVID-19 — saw a decline greater than 25 per cent when compared to figures from last year, even as power demand held firm in parts of Europe during later lockdowns.

The report said the shutting down of the hospitality and tourism sectors in the country — major components of the Italian economy — were said to have had a higher impact, than any other factor, for this fall.


Reduced fossil fuel dependency

Almost all of the reduction in demand was reportedly because of the shutting down of fossil fuel-based power generation, according to the report. Instead, the share of electricity supply from renewables in the entire portfolio of energy sources, increased during the pandemic, reflecting low-carbon electricity lessons observed during COVID-19.

This was due to a natural increase in wind and photovoltaic power generation compared to 2019 along with a drop in overall electricity demand that forced electricity producers from non-renewable sources to decrease their supplies, before surging electricity demand began to strain power systems worldwide.

The Power System Operation Corporation of India also reported that electricity production from coal — India’s primary source of electricity — fell by 32.2 per cent to 1.91 billion units (kilowatt-hours) per day, in line with India's electricity demand decline reported during the pandemic, compared to the 2019 levels.


Related News

View more

Biden calls for 100 percent clean electricity by 2035. Here’s how far we have to go.

Biden Clean Energy Plan 2035 accelerates carbon-free electricity with renewables, nuclear, hydropower, and biomass, invests $2T in EVs, grid and energy efficiency, and tightens fuel economy standards beyond the Clean Power Plan.


Key Points

A $2T U.S. climate plan for carbon-free power by 2035, boosting renewables, nuclear, EVs, efficiency, and grid upgrades.

✅ Targets a zero-carbon electric grid nationwide by 2035

✅ Includes renewables, nuclear, hydropower, and biomass in standard

✅ Funds EVs, grid modernization, weatherization, and fuel economy rules


This month the Democratic presumptive presidential nominee, Joe Biden, outlined an ambitious plan, including Biden’s solar plan to expand clean energy, for tackling climate change that shows how far the party has shifted on the issue since it controlled the White House.

President Barack Obama’s Clean Power Plan had called for the electricity sector to cut its carbon pollution 32 percent by 2030, and did not lay out a trajectory for phasing out oil, coal or natural gas production.

This year, Democratic 2020 hopefuls such as Sen. Bernie Sanders (I-Vt.) went much further, suggesting the United States should derive all of its electricity from renewable sources by 2030, moving to 100% renewables as part of a $16.3 trillion plan to wean the nation away from fossil fuels. Many other congressional Democrats have embraced the Green New Deal — the nonbinding resolution calling for a carbon-free power sector by 2030 and more energy efficient buildings and vehicles, along with a massive investment in electric vehicles and high-speed rail.

Last year, 38 percent of U.S. electricity generated came from clean sources, according to a Washington Post analysis of data from the U.S. Energy Information Administration, and in April renewables hit a record 28% nationwide.

Biden’s new plan, which carries a price tag of $2 trillion, would eliminate carbon emissions from the electric sector by 2035, impose stricter gas mileage standards, fund investments to weatherize millions of homes and commercial buildings, and upgrade the nation’s transportation system. To reach its 2035 carbon-free electricity goal, the campaign includes wind, solar and several forms of energy, acknowledging why the grid isn’t yet 100% renewable while balancing reliability, that are not always counted in state renewable portfolio standards, such as nuclear, hydropower and biomass.

“A great appeal of the Biden proposal is that it is much closer to targeting carbon directly, which is the ultimate enemy, and plays fewer favorites with particular technologies,” said Michael Greenstone, who directs the University of Chicago’s Energy Policy Institute. “This will reduce the costs to consumers and give more carbon bang for the buck.”

But some environmentalists, such as Friends of the Earth President Erich Pica, question the idea of including more controversial carbon-free technologies. “There is no role for nuclear in a least-cost, low carbon world. Including these dinosaurs in a clean energy standard is going to incentivize industry efforts to keep aging, dangerous facilities online,” Pica said in an email.

Hydropower, which relies on a system of moving water that constantly recharges, is defined as renewable by the Environmental Protection Agency. Biomass is often considered as carbon neutral because even though it releases carbon dioxide when it is burned, the plants capture nearly the same amount of CO2 while growing.


Both forms of energy have come under fire for their environmental impacts, however. Damming streams and rivers can destroy fish habitat and make it more difficult for them to spawn, and it also seems unlikely that hydropower will expand its current 6 percent share of the nation’s electrical grid.

Many experts argue that classifying biomass energy as carbon neutral provides an incentive to cut down trees that would otherwise remain standing and sequester carbon. “If burning this wood were good for the climate, then we should not recycle paper, we should burn it,” noted Tim Searchinger, a research scholar at the Princeton School of Public and International Affairs.

Illinois lead the nation in the amount of electricity generated from nuclear power

More than half of the country — 30 states, Washington, and three territories — have adopted a renewable portfolio standard (RPS), according to the National Conference of State Legislatures, and seven states and one territory have set renewable energy goals. While 14 states, along with the District, Puerto Rico and the Virgin Islands, have established requirements of 50 percent or more carbon-free electricity, nearly as many have set theirs at 15 percent or less.

Maine Gov. Janet Mills (D), who has called for 100% renewable electricity in the state, has pushed clean electricity aggressively since taking office in 2019, lifting a wind energy moratorium imposed by her predecessor and signing bills aimed at expanding the state’s carbon-free energy sources. Biomass accounts for a quarter of the state’s electricity, more than any other state.

New York has one of the country’s most ambitious climate targets, which it scaled up last year. It aims to obtain 70 percent of its power from renewable sources within a decade, a period when renewables surpassed coal in U.S. generation, and eliminate carbon altogether by 2040, even as the state is in the process of shutting down a major nuclear plant near New York City, Indian Point, which is slated to cease operating on April 30, 2021.

... while other states are weakening theirs

Last year, Ohio weakened its renewable energy standard from a target of 12.5 percent in 2027 to 8.5 percent by 2026, even as renewables topped coal nationwide for the first time in over a century, without setting any future goals, and jettisoned its energy efficiency standard. West Virginia — which established modest renewable requirements in 2009 — repealed them altogether in 2015, the year they were set to take effect.


Related News

View more

How waves could power a clean energy future

Wave Energy Converters can deliver marine power to the grid, with DOE-backed PacWave enabling offshore testing, robust designs, and renewable electricity from oscillating waves to decarbonize coastal communities and replace diesel in remote regions.


Key Points

Wave energy converters are devices that transform waves' oscillatory motion into electricity for the grid or loads.

✅ DOE's PacWave enables full-scale, grid-connected offshore testing.

✅ Multiple designs convert oscillating motion into torque and power.

✅ Ideal for islands, microgrids, and replacing diesel generation.


Waves off the coast of the U.S. could generate 2.64 trillion kilowatt hours of electricity per year — that’s about 64% of last year’s total utility-scale electricity generation in the U.S. We won’t need that much, but one day experts do hope that wave energy will comprise about 10-20% of our electricity mix, alongside other marine energy technologies under development today.

“Wave power is really the last missing piece to help us to transition to 100% renewables, ” said Marcus Lehmann, co-founder and CEO of CalWave Power Technologies, one of a number of promising startups focused on building wave energy converters.

But while scientists have long understood the power of waves, it’s proven difficult to build machines that can harness that energy, due to the violent movement and corrosive nature of the ocean, combined with the complex motion of waves themselves, even as a recent wave and tidal market analysis highlights steady advances.

″Winds and currents, they go in one direction. It’s very easy to spin a turbine or a windmill when you’ve got linear movement. The waves really aren’t linear. They’re oscillating. And so we have to be able to turn this oscillatory energy into some sort of catchable form,” said Burke Hales, professor of cceanography at Oregon State University and chief scientist at PacWave, a Department of Energy-funded wave energy test site off the Oregon Coast. Currently under construction, PacWave is set to become the nation’s first full-scale, grid-connected test facility for these technologies, a milestone that parallels U.K. wind power lessons on scaling new industries, when it comes online in the next few years.

“PacWave really represents for us an opportunity to address one of the most critical barriers to enabling wave energy, and that’s getting devices into the open ocean,” said Jennifer Garson, Director of the Water Power Technologies Office at the U.S. Department of Energy.

At the beginning of the year, the DOE announced $25 million in funding for eight wave energy projects to test their technology at PacWave, as offshore wind forecasts underscore the growing investor interest in ocean-based energy. We spoke with a number of these companies, which all have different approaches to turning the oscillatory motion of the waves into electrical power.

Different approaches
Of the eight projects, Bay Area-based CalWave received the largest amount, $7.5 million. 

″The device we’re testing at PacWave will be a larger version of this,” said Lehmann. The x800, our megawatt-class system, produces enough power to power about 3,000 households.”

CalWave’s device operates completely below the surface of the water, and as waves rise and fall, surge forward and backward, and the water moves in a circular motion, the device moves too. Dampers inside the device slow down that motion and convert it into torque, which drives a generator to produce electricity, a principle mirrored in some wind energy kite systems as they harvest aerodynamic forces.

“And so the waves move the system up and down. And every time it moves down, we can generate power, and then the waves bring it back up. And so that oscillating motion, we can turn into electricity just like a wind turbine,” said Lehmann.

Another approach is being piloted by Seattle-based Oscilla Power, which was awarded $1.8 million from the DOE, and is getting ready to deploy its wave energy converter off the coast of Hawaii, at the U.S. Navy Wave Energy Test site.

Oscilla Power’s device is composed of two parts. One part floats on the surface and moves with the waves in all directions — up and down, side to side and rotationally. This float is connected to a large, ring-shaped structure which hangs below the surface, and is designed to stay relatively steady, much like how underwater kites leverage a stable reference to generate power. The difference in motion between the float and the ring generates force on the connecting lines, which is used to rotate a gearbox to drive a generator.

″The system that we’re deploying in Hawaii is what we call the Triton-C. This is a community-scale system,” said Balky Nair, CEO of Oscilla Power. “It’s about a third of the size of our flagship product. It’s designed to be 100 kilowatt rated, and it’s designed for islands and small communities.”

Nair is excited by wave energy’s potential to generate electricity in remote regions, which currently rely on expensive and polluting diesel imports to meet their energy needs when other renewables aren’t available, and similar tidal energy for remote communities efforts in Canada point to viable models. Before wave energy is adopted at-scale, many believe we’ll see wave energy replacing diesel generators in off-the-grid communities.

A third company, C-Power, based in Charlottesville, Virginia, was awarded more than $4 million to test its grid-scale wave energy converter at PacWave. But first, the company wants to commercialize its smaller scale system, the SeaRAY, which is designed for lower-power applications. 

″Think about sensors in the ocean, research, metocean data gathering, maybe it’s monitoring or inspection,” said C-Power CEO Reenst Lesemann on the initial applications of his device.

The SeaRAY consists of two floats and a central body, the nacelle, which contains the drivetrain. As waves pass by, the floats bob up and down, rotating about the nacelle and turning their own respective gearboxes which power the electric generators.

Eventually, C-Power plans to scale up its SeaRAY so that it’s capable of satellite communications and deep water deployments, before building a larger system, called the StingRAY, for terrestrial electricity generation.

Meanwhile, one Swedish company, Eco Wave Power, is taking another approach completely, eschewing offshore technologies in favor of simpler wave power devices that can be installed on breakwaters, piers, and jetties.

“All the expensive conversion machinery, instead of being inside the floaters like in the competing technologies, is on land just like a regular power station. So basically this enables a very low installation, operation, and maintenance cost,” explained CEO Inna Braverman.


Related News

View more

Sign Up for Electricity Forum’s Newsletter

Stay informed with our FREE Newsletter — get the latest news, breakthrough technologies, and expert insights, delivered straight to your inbox.

Electricity Today T&D Magazine Subscribe for FREE

Stay informed with the latest T&D policies and technologies.
  • Timely insights from industry experts
  • Practical solutions T&D engineers
  • Free access to every issue

Live Online & In-person Group Training

Advantages To Instructor-Led Training – Instructor-Led Course, Customized Training, Multiple Locations, Economical, CEU Credits, Course Discounts.

Request For Quotation

Whether you would prefer Live Online or In-Person instruction, our electrical training courses can be tailored to meet your company's specific requirements and delivered to your employees in one location or at various locations.