California Community Choice Aggregators are reshaping electricity markets with renewable energy, solar and wind sourcing, competitive rates, and customer choice, challenging PG&E, SDG&E, and Southern California Edison while advancing California's clean power goals.
Key Points
Local governments that buy power, often cleaner and cheaper, while utilities handle delivery and billing.
✅ Offer higher renewable mix than utilities at competitive rates
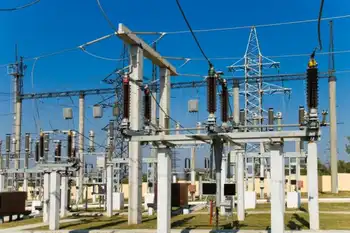
✅ Utilities retain transmission and billing responsibilities
✅ Rapid expansion threatens IOU market share across California
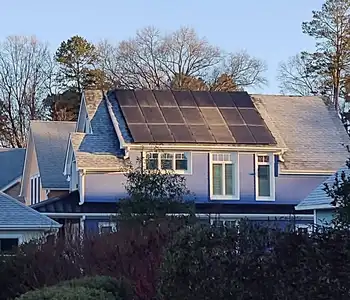
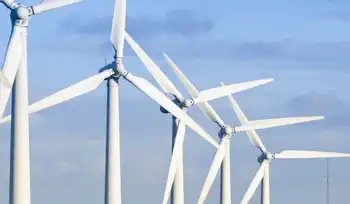
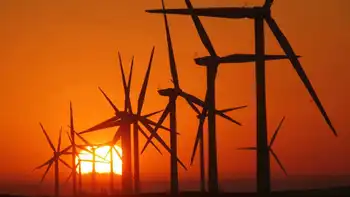
Nearly 2 million electricity customers in California may not know it, but they’re part of a revolution. That many residents and businesses are getting their power not from traditional utilities, but via new government-affiliated entities known as community choice aggregators. The CCAs promise to deliver electricity more from renewable sources, such as solar and wind, even as California exports its energy policies across Western states, and for a lower price than the big utilities charge.
The customers may not be fully aware they’re served by a CCA because they’re still billed by their local utility. But with more than 1.8 million accounts now served by the new system and more being added every month, the changes in the state’s energy system already are massive.
Faced for the first time with real competition, the state’s big three utilities have suddenly become havens of innovation. They’re offering customers flexible options on the portion of their power coming from renewable energy, amid a broader review to revamp electricity rates aimed at cleaning the grid, and they’re on pace to increase the share of power they get from solar and wind power to the point where they are 10 years ahead of their deadline in meeting a state mandate.
#google#
But that may not stem the flight of customers. Some estimates project that by late this year, more than 3 million customers will be served by 20 CCAs, and that over a longer period, Pacific Gas & Electric, Southern California Edison, and San Diego Gas & Electric could lose 80% of their customers to the new providers.
Two big customer bases are currently in play: In Los Angeles and Ventura counties, a recently launched CCA called the Clean Power Alliance is hoping by the end of 2019 to serve nearly 1 million customers. Unincorporated portions of both counties and 29 municipalities have agreed in principle to join up.
Meanwhile, the city of San Diego is weighing two options to meet its goal of 100% clean power by 2035, as exit fees are being revised by the utilities commission: a plan to be submitted by SDG&E, or the creation of a CCA. A vote by the City Council is expected by the end of this year. A city CCA would cover 1.4 million San Diegans, accounting for half SDG&E’s customer demand, according to Cody Hooven, the city’s chief sustainability officer.
Don’t expect the big companies to give up their customers without a fight. Indeed, battle lines already are being drawn at the state Public Utilities Commission, where a recent CPUC ruling sided with a community energy program over SDG&E, and local communities.
“SDG&E is in an all-out campaign to prevent choice from happening, so that they maintain their monopoly,” says Nicole Capretz, who wrote San Diego’s climate action plan as a city employee and now serves as executive director of the Climate Action Campaign, which supports creation of the CCA.
California is one of seven states that have legalized the CCA concept, even as regulators weigh whether the state needs more power plants to ensure reliability. (The others are New York, New Jersey, Massachusetts, Ohio, Illinois and Rhode Island.) But the scale of its experiment is likely to be the largest in the country, because of the state’s size and the ambition of its clean-power goal, which is for 50% of its electricity to be generated from renewable sources by 2030.
California created its system via legislative action in 2002. Assembly Bill 117 enabled municipalities and regional governments to establish CCAs anywhere that municipal power agencies weren’t already operating. Electric customers in the CCA zones were automatically signed up, though they could opt out and stay with their existing power provider. The big utilities would retain responsibility for transmission and distribution lines.
The first CCA, Marin Clean Energy, began operating in 2010 and now serves 470,000 customers in Marin and three nearby counties.
The new entities were destined to come into conflict with the state’s three big investor-owned utilities. Their market share already has fallen to about 70%, from 78% as recently as 2010, and it seems destined to keep falling. In part that’s because the CCAs have so far held their promise: They’ve been delivering relatively clean power and charging less.
The high point of the utilities’ hostility to CCAs was the Proposition 16 campaign in 2009. The ballot measure was dubbed the “Taxpayers Right to Vote Act,” but was transparently an effort to smother CCAs in the cradle. PG&E drafted the measure, got it on the ballot, and contributed all of the $46.5 million spent in the unsuccessful campaign to pass it.
As recently as last year, PG&E and SDG&E were lobbying in the legislature for a bill that would place a moratorium on CCAs. The effort failed, and hasn’t been revived this year.
Rhetoric similar to that used by PG&E against Marin’s venture has surfaced in San Diego, where a local group dubbed “Clear the Air” is fighting the CCA concept by suggesting that it could be financially risky for local taxpayers and questioning whether it will be successful in providing cleaner electricity. Whether Clear the Air is truly independent of SDG&E’s parent, Sempra Energy, is questionable, as at least two of its co-chairs are veteran lobbyists for the company.
SDG&E spokeswoman Helen Gao says the utility supports “customers’ right to choose an energy provider that best meets their needs” and expects to maintain a “cooperative relationship” with any provider chosen by the city.
Related News