California fossil fuel grid reliability plan addresses heat wave demand, rolling blackouts, and grid stability by temporarily procuring gas generation while accelerating renewables, storage, and transmission to meet clean energy and carbon-neutral targets by 2045.
Key Points
A stop-gap policy to prevent blackouts by buying fossil power while fast-tracking renewables, storage, and grid upgrades.
✅ Temporary procurement of gas to avoid rolling blackouts
✅ Accelerates renewables, storage, transmission permitting
✅ Aims for carbon neutrality by 2045 without new gas plants
California wants to quit fossil fuels. Just not yet Faced with a fragile electrical grid and the prospect of summertime blackouts, the state agreed to put aside hundreds of millions of dollars to buy power from fossil fuel plants that are scheduled to shut down as soon as next year.
That has prompted a backlash from environmental groups and lawmakers who say Democratic Gov. Gavin Newsom’s approach could end up extending the life of gas plants that have been on-track to close for more than a decade and could threaten the state’s goal to be carbon neutral by 2045.
“The emphasis that the governor has been making is ‘We’re going to be Climate Leaders; we’re going to do 100 percent clean energy; we’re going to lead the nation and the world,’” said V. John White, executive director of the Sacramento-based Center for Energy Efficiency and Renewable Technologies, a non-profit group of environmental advocates and clean energy companies. “Yet, at least a part of this plan means going the opposite direction.”
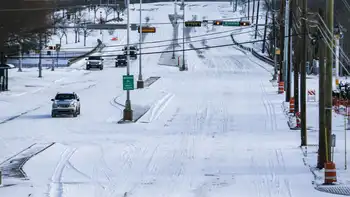
That plan was a last-minute addition to the state’s energy budget, which lawmakers in the Democratic-controlled Legislature reluctantly passed. Backers say it’s necessary to avoid the rolling blackouts like the state experienced during a heat wave in 2020. Critics see a muddled strategy on energy, and not what they expected from a nationally ambitious governor who has made climate action a centerpiece of his agenda.
The legislation, which some Democrats labeled as “lousy” and “crappy,” reflects the reality of climate change. Heat waves are already straining power capacity, and the transition to cleaner energy isn’t coming fast enough to meet immediate needs in the nation’s most populous state.
Officials have warned that outages would be possible this summer, as the grid faces heat wave tests again, with as many as 3.75 million California homes losing power in a worst-case scenario of a West-wide heat wave and insufficient electrical supplies, particularly in the evenings.
It’s also an acknowledgment of the political reality that blackout politics are hazardous to elected officials, even in a state dominated by one party.
Newsom emphasized that the money to prop up the power grid, part of a larger $4.3 billion energy spending package, is meant as a stop-gap measure. The bill allows the Department of Water Resources to spend $2.2 billion on “new emergency and temporary generators, new storage systems, clean generation projects, and funding on extension of existing generation operations, if any occur,” the governor said in a statement after signing the bill.
“Action is needed now to maintain reliable energy service as the State accelerates the transition to clean energy,” Newsom said.
Following the signing, the governor called for the state California Air Resources Board to add a set of ambitious goals to its 2022 Scoping Plan, which lays out California’s path for reducing carbon emissions.
Among Newsom’s requested changes is a move away from fossil fuels, asking state agencies to prepare for an energy transition that avoids the need for new natural gas plants.
Alex Stack, a spokesman for the governor, said in a statement that California has been a global leader in reducing pollution and exporting energy policies across Western states, and pointed to Newsom’s recent letter to the Air Resources Board as well as one sent to President Joe Biden outlining how states can work with the federal government to combat climate change.
“California took action to streamline permitting for clean energy projects to accelerate the build out of clean energy that is needed to meet our climate goals and help maintain reliability in the face of extreme heat, wildfires, and drought,” Stack said.
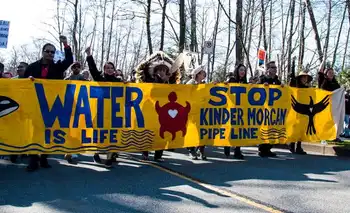
But the prospect of using state money on fossil fuel power, even in the short term, has raised ire among the state’s many environmental advocacy groups, and raised questions about whether California will be able to achieve its goals.
“What is so frustrating about an energy bill like this is that we are at crunch time to meet these goals,” said Mary Creasman, CEO of California Environmental Voters. “And we’re investing a scale of funding into things that exacerbate those goals.”
Emmanuelle Chriqui and Mary Creasman speak during the 2021 Environmental Media Association IMPACT Summit at Pendry West Hollywood on September 2, 2021 in West Hollywood, California. | Jesse Grant/Getty Images for Environmental Media Association
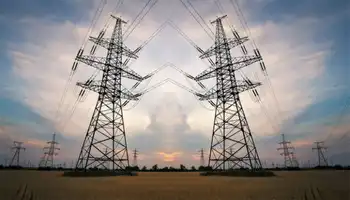
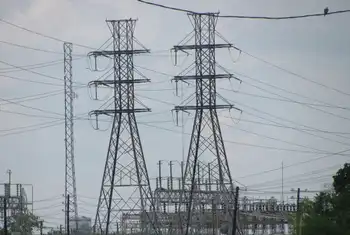
With climate change-induced drought and high temperatures continuing to ravage the West, California anticipates the demand on the grid will only continue to grow. Despite more than a decade of bold posturing and efforts to transition to solar, wind and hydropower, the state worries it doesn’t have enough renewable energy sources on hand to keep the power on in an emergency right now, amid a looming shortage that will test reliability.
The specter of power outages poses a hazard to Newsom, and Democrats in general, especially ahead of November. While the governor is widely expected to sail to reelection, rolling blackouts are a serious political liability — in 2003, they were the catalyst for recalling Democratic Gov. Gray Davis. A lack of power isn’t just about people sweating in the dark, said Steven Maviglio, a longtime Democratic consultant who served as communications director for Davis, it can affect businesses, travel and have an outsized impact on the economy.
It behooves any state official to keep the power on, but, unlike Davis, Newsom is under serious pressure to make sure the state also adheres to its climate goals.
“Gavin Newsom’s brand is based on climate change and clean air, so it’s a little more difficult for him to say ‘well that’s not as important as keeping the power on,’” Maviglio said.
The same bill effectively ends local government control over those projects, for the time being. It hopes to speed up the state’s production of renewable energy sources by giving exclusive authority over the siting of those projects to a single state agency for the next seven years.
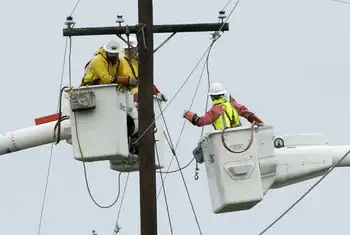
Environmental advocates say the state is now scrambling to address an issue they’ve long known was coming. In 2010, California officials set a schedule to retire a number of coastal gas plants that rely on what’s known as once-through cooling systems, which are damaging to the environment, especially marine life, even as regulators weigh more power plants to maintain reliability today. Many of those plants have been retired since 2010, but others have received extensions.
The remaining plants have various deadlines for when they must cease operations, with the soonest being the end of 2023.
Also at issue is the embattled Diablo Canyon nuclear power plant, California’s largest electricity source. The Pacific Gas & Electric-owned plant is scheduled to close in 2025, but the strain on the grid has officials considering the possibility of seeking an extension. Newsom said earlier this spring he would be open to extending the life of the plant. Doing so would also require federal approval.
Al Muratsuchi stands and talks into a microphone with a mask on.
Assemblyman Al Muratsuchi speaks during an Assembly session in Sacramento, Calif., on Jan. 31, 2022. | Rich Pedroncelli/AP Photo
The International Brotherhood of Electrical Workers 1245, a labor union, sees the energy package as a way to preserve Diablo Canyon, and jobs at the plant.
“The value to 1245 PG&E members at Diablo Canyon is clear — funding to keep the plant open,” the union said of the bill.
Assemblymember Al Muratsuchi (D-Los Angeles) criticized the bill as “crappy” when it came to the floor in late June, describing it as “a rushed, unvetted and fossil-fuel-heavy response” to the state’s need to bolster the grid.
“The state has had over 12 years to procure and bring online renewable energy generation to replace these once through cooling gas power plants,” Muratsuchi said. “Yet, the state has reneged on its promise to shut down these plants, not once, but twice already.”
Not all details of the state’s energy budget are final. Lawmakers still have $3.8 billion to allocate when they return on Aug. 1 for the final stretch of the year.
Creasman, at California Environmental Voters, said she wants lawmakers to set specific guidelines for how and where it will spend the $2.2 billion when they return in August to dole out the remaining money in the budget. Newsom and legislators also need to ensure that this is the last time California has to spend money on fossil fuel, she said.
“Californians deserve to see what the plan is to make sure we’re not in this position again of having to choose between making climate impacts worse or keeping our lights on,” Creasman said. “That’s a false choice.”
Related News