CSA Z462 Arc Flash Training – Electrical Safety Compliance Course
Our customized live online or in‑person group training can be delivered to your staff at your location.

- Live Online
- 6 hours Instructor-led
- Group Training Available
Regular Price:
$249
Coupon Price:
$199
MADRID
—
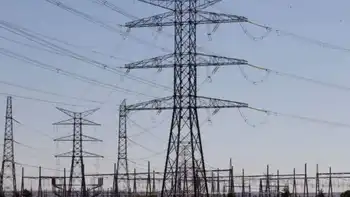
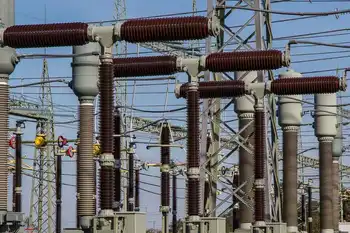
Spain Electricity Prices surge to record highs as the wholesale market hits €339.84/MWh, driven by gas costs and CO2 permits, impacting PVPC regulated tariffs, free-market contracts, and household energy bills, OMIE data show.
What You Need to Know
Rates in Spain's wholesale market that shape PVPC tariffs and free-market bills, moving with gas prices and CO2 costs.
New peak €339.84/MWh, fifth breach of €300 threshold.
Max price 20:00-21:00 at €375/MWh; low 04:00-05:00 at €267.99/MWh.
PVPC tariff exposed; 11M users direct, 17M free-market users referenced.
Cost drivers: high gas and record CO2 prices intensify EU energy inflation.
Electricity in Spain's wholesale market will rise in price once more as European electricity prices continue to surge. Once again, it will set a historical record in Spain, reaching €339.84/MWh. With this figure, it is already the fifth time that the threshold of €300 has been exceeded.
This new high is a 6.32 per cent increase on today’s average price of €319.63/MWh, which is also a historic record, while Germany's power prices nearly doubled over the past year. Monday’s energy price will make it 682.65 per cent higher than the corresponding date in 2020, when the average was €43.42.
According to data published by the Iberian Energy Market Operator (OMIE), Monday’s maximum will be between the hours of 8pm and 9pm, reaching €375/MWh, a pattern echoed by markets where Electric Ireland price hikes reflect wholesale volatility. The cheapest will be from 4am to 5am, at €267.99.
The prices of the ‘pool’ have a direct effect on the regulated tariff – PVPC – to which almost 11 million consumers in the country are connected, and serve as a reference for the other 17 million who have contracted their supply in the free market, where rolling back prices is proving difficult across Europe.
These spiraling prices in recent months, which have fueled EU energy inflation, are being blamed on high gas prices in the markets, and carbon dioxide (CO2) emission rights, both of which reached record highs this year.
According to an analysis by Facua-Consumidores en Acción, if the same rates were maintained for the rest of the month, the last invoice of the year would reach €134.45 for the average user. That would be 94.1 per cent above the €69.28 for December 2020, while U.S. residential electricity bills rose about 5% in 2022 after inflation adjustments.
The average user’s bill so far this year has increased by 15.1 per cent compared to 2018, as US electricity prices posted their largest jump in 41 years. Thus, compared to the €77.18 of three years ago, the average monthly bill now reaches €90.87 euros. However, the Government continues to insist that this year households will end up paying the same as in 2018.
As Ruben Sanchez, the general secretary of Facua commented, “The electricity bill for December would have to be negative for President Sanchez, and Minister Ribera, to fulfill their promise that this year consumers will pay the same as in 2018 once the CPI has been discounted”.
Related News
Related News
Ukraine Resumes Electricity Exports
Ukraine Electricity Exports resume as the EU grid links stabilize; ENTSO-E caps, megawatt capacity, renewables,…
View more

Top Senate Democrat calls for permanent renewable energy, storage, EV tax credits
Clean Energy Tax Incentives could expand under Democratic proposals, including ITC, PTC, and EV tax…
View more
Nigeria's Electricity Crisis
Nigeria Electricity Crisis undermines energy access as aging grid, limited generation, and transmission losses cause…
View more
Canada's Ambitious Electric Vehicle Goals
Canada 2035 Gasoline Car Ban accelerates EV adoption, zero-emission transport, and climate action, with charging…
View more
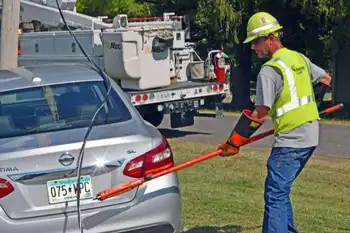
Ameren, Safe Electricity urge safety near downed lines
Downed Power Line Vehicle Safety: Follow stay-in-the-car protocol, call 911, avoid live wires and utility…
View more
Toronto Cleans Up After Severe Flooding
Toronto Flood Cleanup details the citywide response to storm damage after heavy rain, stressing drainage…
View more
Sign Up for Electricity Forum’s Newsletter
Stay informed with our FREE Newsletter — get the latest news, breakthrough technologies, and expert insights, delivered straight to your inbox.
Electricity Today T&D Magazine Subscribe for FREE

Stay informed with the latest T&D policies and technologies.
- Timely insights from industry experts
- Practical solutions T&D engineers
- Free access to every issue

