IEC-PETL Electricity Agreement streamlines grid management, debt settlement, and bank guarantees, shifting power supply, transmission, and distribution to PETL via IEC-built sub-stations, bolstering energy cooperation, utility billing, and payment assurance in PA areas.
Key Points
A 15-year deal transferring PA grid operations to PETL, settling legacy debt, and securing payments with bank guarantees.
✅ NIS 915 million repaid in 48 installments.
✅ PETL assumes distribution, O&M, and sub-station ownership.
✅ 15-year, NIS 2.8b per year supply and services contract.
The Palestinian Authority will pay Israel Electric NIS 915 million and take over management of its grid through Palestinian electricity supplier PETL.
The Israel Electric Corporation (IEC) (TASE: ELEC.B22) and Palestinian electricity supplier PETL have signed a draft commercial agreement under which the Palestinian Authority's (PA) debt of almost NIS 1 billion will be repaid. The agreement also transfers actual management of the supply of electricity to Palestinian customers from IEC to the Palestinian electricity authority, enabling consideration of distributed solutions such as a virtual power plant program in future planning.
Up until now, the IEC was unable to actually collect debts for electricity from Palestinian customers, because the connection with them was through the PA. Responsibility for collection will now be exclusively in Palestinian hands, with the PA providing hundreds of millions of shekels in bank guarantees for future debts. The agreement, which is valid for 15 years, amounts to an estimated NIS 2.8 billion a year, as of now.
IEC will sell electricity and related services to PETL through four high-tension sub-stations built by IEC for PETL and through high and low-tension connection points, similar to large interconnector projects like the Lake Erie Connector, for the purpose of distribution and supply of the electricity by PETL or an entity on its behalf to consumers in PA territory. PETL will have sole operational and maintenance responsibility for distribution and supply and ownership of the four sub-stations.
NIS 915 million in 48 payments
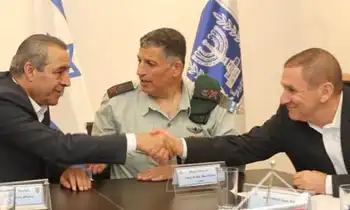
According to the IEC announcement, the settlement was reached following negotiations following the signing of an agreement in principle in September 2016 by the minister of finance, the government coordinator of activities in the territories, and the Palestinian minister for civilian affairs. The parties reached commercial understandings yesterday that made possible today's signing of the first commercial document of its kind regulating commercial relations - the sales of electricity - between the parties. The agreement will go into effect after it is approved by the IEC board of directors, the Public Utilities Authority (electricity), reflecting regulatory oversight akin to Ontario industrial electricity pricing consultations, and the IDF Chief Electrical Staff Officer. Representatives of IEC, the Ministry of Finance, the Public Utilities Authority (electricity), the government coordinator of activities in the territories, the civilian authority, the PA government, and PETL took part in the negotiations.
The agreement also settles the PA's historical debt to IEC. The PA will begin payment of NIS 915 million in debt for consumption of electricity before September 2016 to IEC Jerusalem District Ltd. in 48 equal installments after the final signing, as stipulated in the agreement in principle signed by the Israeli government and the PA on September 13, 2016.
The PA's debt for electricity amounted to almost NIS 2 billion in 2016. The initial spadework for the current debt settlement was accomplished in that year, after the parties reached understandings on writing off NIS 500 million of the Palestinian debt. The PA paid NIS 600 million in October 2016, and the remainder will be paid now.
It was also reported that an arrangement of securities and guarantees to ensure payment to IEC under the agreement had been settled, including the past debt. IEC will obtain a bank guarantee and a PA guarantee, in addition to the existing collection mechanisms at the company's disposal.
Minister of Finance Moshe Kahlon said, "Signing the commercial agreement is a historic step completing the agreement signed by the governments in September 2016. Strengthening economic cooperation between Israel and the PA is above all an Israeli security interest. The agreement will ensure future payments to the IEC and reinforce its financial position. I congratulate the negotiating teams for the completion of their task."
Minister of National Infrastructure, Energy, and Water Resources Dr. Yuval Steinitz said, "In my meeting last year with Palestinian Prime Minister Rami Hamdallah in Jenin, we agreed that it was necessary to settle the debt and formalize relations between IEC and the PA. The settlement signed today is a breakthrough, both in the measures for payment of the Palestinian debt to IEC and Israel and in arranging future relations to prevent more debts from emerging in the future. With the signing of the agreement, we will be able to make progress with the Palestinians in developing a modern electrical grid, aligning with regional initiatives like the Cyprus electricity highway, according to the model of the sub-station we inaugurated in Jenin."
IEC chairperson Yiftah Ron Tal said, "This is a historic event. In this agreement, IEC is correcting for the first time a historical distortion of accumulated debt without guarantees, ability to collect it, or control over the amount of debt. This anchor agreement not only constitutes an unprecedented financial achievement; it also constitutes an important milestone in regulating electricity commercial relations between the Israeli and Palestinian electric companies, comparable to cross-border efforts such as the Ireland-France interconnector in Europe."
Related News