Power system upgrades keep AC flowing

By Boston Globe


CSA Z462 Arc Flash Training - Electrical Safety Essentials

Our customized live online or in‑person group training can be delivered to your staff at your location.

  • Live Online
  • 6 hours Instructor-led
  • Group Training Available
Regular Price:
$249
Coupon Price:
$199
Reserve Your Seat Today
SomethingÂ’s missing from the recent mini heat wave: problems with power.

Temperatures boiling over into the mid-90s have helped push demand for electricity to its highest levels so far this year. And yet, despite the hottest days, which peaked at 95 degrees at Logan International Airport, power grid and local utility company officials said handling the heat has been a relative breeze.

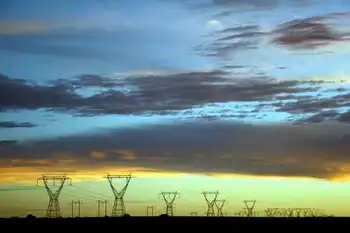
Power grid officials said they learned some hard lessons from the summers of 2001 and 2002, when a number of heat-related outages plagued Greater Boston. Part of the problem was an outdated delivery system weakened by the closing of several older power plants. Since then, new transmission lines have been built, old ones have been upgraded, and new generating plants have come online.

“Clearly we were in a much more vulnerable position back then,’’ said Gordon van Welie, head of ISO New England, the organization in Holyoke that runs the regional power grid.

Close to $4 billion has been invested in upgrades to the grid and more is coming, van Welie said. Currently, the grid can generate roughly 32,000 megawatts of power — a 21.5 percent increase from 26,336 megawatts in 2001 — with one megawatt being enough to power 700 to 1,000 homes. That increased capacity improves reliability and lessens the chances of an outage for the 6.5 million households and businesses in New England served by the grid.

Some of that increase in capacity comes from three transmission line projects NStar completed in 2006 and 2007.

“They essentially increased our ability to import power into our service area by about 1,800 megawatts,’’ said Werner Schweiger, senior vice president of operations for NStar, which serves 1.1 million electric customers in Massachusetts. Now, outages experienced by NStar customers are shorter and less frequent than in 2001. Then, the average outage was 100 minutes, and there was one about every 9.5 months. The time between outages now averages 15 months, and they last an average of 76 minutes.

National Grid also has made significant improvements to the way it gets power to its 1.2 million Massachusetts electric customers. It has reinforced approximately 4,000 miles of overhead power lines, and now can isolate portions of a line experiencing a problem, said spokeswoman Deborah Drew. The number and frequency of outages have also dropped, Drew said. In 2008, the average customer experienced an outage a year that lasted roughly 118 minutes, down from 2005, when customers experienced 1.6 outages a year that lasted about 176 minutes.

Energy analyst Mary Novak, from Lexington economic forecasting firm IHS Global Insight, said the summerÂ’s mild weather, recent emphasis on becoming more energy efficient, and even the recession have helped suppress electricity use.

“Electricity use is actually quite closely tied to the number of employees (at work),’’ Novak said. “If you’re not there sitting in your office, you don’t need the lights turned on.’’

Add in upgrades to the power system in recent years, Novak said, and the grid is “probably a little overbuilt.’’

According to van Welie, there has been about a 6 percent drop in electricity use compared with this period last year.

“What that translates into, from a system operator point of view, is a much more comfortable situation,’’ he said.

ISO New England was predicting that the day’s demand for power would top out at 26,010 megawatts — far shy of the record 28,130 megawatts set on August 2, 2006.

Even so, grid officials and utility workers said the recent temperatures prompted them to ramp up their game. At NStar, workers held four conference calls — three more than usual — to track power delivery.

“We spend the entire year preparing for peak demand,’’ said Schweiger. “On days like today, over in our control center we have our engineers teamed up with our operators, and they spend the day monitoring our assets.’’

Related News

EIA: Pennsylvania exports the most electricity, California imports the most from other states

U.S. Electricity Trade by State, 2013-2017 highlights EIA grid patterns, interstate imports and exports, cross-border flows with Canada and Mexico, net exporters and importers, and market regions like ISOs and RTOs shaping consumption and generation.


Key Points

Brief EIA overview of interstate and cross-border power flows, ranking top net importers and exporters.

✅ Pennsylvania was the largest net exporter, averaging 59 million MWh.

✅ California was the largest net importer, averaging 77 million MWh.

✅ Top cross-border: NY, CA, VT, MN, MI imports; WA, TX, CA, NY, MT exports.


According to the U.S. Energy Information Administration (EIA) State Electricity Profiles, from 2013 to 2017, Pennsylvania was the largest net exporter of electricity, while California was the largest net importer.

Pennsylvania exported an annual average of 59 million megawatt-hours (MWh), while California imported an average of 77 million MWh annually.

Based on the share of total consumption in each state, the District of Columbia, Maryland, Massachusetts, Idaho and Delaware were the five largest power-importing states between 2013 and 2017, highlighting how some clean states import 'dirty' electricity as consumption outpaces local generation. Wyoming, West Virginia, North Dakota, Montana and New Hampshire were the five largest power-exporting states. Wyoming and West Virginia were net power exporting states between 2013 and 2017.

New York, California, Vermont, Minnesota and Michigan imported the most electricity from Canada or Mexico on average from 2013 to 2017, reflecting the U.S. look to Canada for green power during that period. Similarly, Washington, Texas, California, New York, and Montana exported the most electricity to Canada or Mexico, on average, during the same period.

Electricity routinely flows among the Lower 48 states and, to a lesser extent, between the United States and Canada and Mexico. From 2013 to 2017, Pennsylvania was the largest net exporter of electricity, sending an annual average of 59 million megawatthours (MWh) outside the state. California was the largest net importer, receiving an average of 77 million MWh annually.

Based on the share of total consumption within each state, the District of Columbia, Maryland, Massachusetts, Idaho, and Delaware were the five largest power-importing states between 2013 and 2017. Wyoming, West Virginia, North Dakota, Montana, and New Hampshire were the five largest power-exporting states. States with major population centers and relatively less generating capacity within their state boundaries tend to have higher ratios of net electricity imports to total electricity consumption, as utilities devote more to electricity delivery than to power production in many markets.

Wyoming and West Virginia were net power exporting states (they exported more power to other states than they consumed) between 2013 and 2017. Customers residing in these two states are not necessarily at an economic disadvantage or advantage compared with customers in neighboring states when considering their electricity bills and fees and market dynamics. However, large amounts of power trading may affect a state’s revenue derived from power generation.

Some states also import and export electricity outside the United States to Canada or Mexico, even as Canada's electricity exports face trade tensions today. New York, California, Vermont, Minnesota, and Michigan are the five states that imported the most electricity from Canada or Mexico on average from 2013 through 2017. Similarly, Washington, Texas (where electricity production and consumption lead the nation), California, New York, and Montana are the five states that exported the most electricity to Canada or Mexico, on average, for the same period.

Many states within the continental United States fall within integrated market regions, referred to as independent system operators or regional transmission organizations. These integrated market regions allow electricity to flow freely between states or parts of states within their boundaries.

EIA’s State Electricity Profiles provide details about the supply and disposition of electricity for each state, including net trade with other states and international imports and exports, and help you understand where your electricity comes from more clearly.


Related News

View more

IAEA Warns of Nuclear Risks from Russian Attacks on Ukraine Power Grids

Ukraine nuclear safety risks escalate as IAEA warns of power grid attacks threatening reactor cooling, diesel generators, and Zaporizhzhia oversight, prompting UN calls for demilitarized zones to prevent radioactive releases and accidents.


Key Points

Escalating threats from grid attacks and outages that jeopardize reactor cooling, IAEA oversight, and public safety.

✅ Power grid strikes threaten reactor cooling systems.

✅ Emergency diesel generators are last defense lines.

✅ Calls grow for demilitarized zones around plants.


In early February 2025, Rafael Grossi, Director General of the International Atomic Energy Agency (IAEA), expressed grave concerns regarding the safety of Ukraine's nuclear facilities amid ongoing Russian attacks on the country's power grids, as Kyiv warned of a difficult winter without power after deadly strikes on energy infrastructure. Grossi's warnings highlight the escalating risks to nuclear safety and the potential for catastrophic accidents.

The Threat to Nuclear Safety

Ukraine's nuclear infrastructure, including the Zaporizhzhia Nuclear Power Plant—the largest in Europe—relies heavily on a stable power supply to maintain critical cooling systems and other safety measures. Russian military operations targeting Ukraine's energy infrastructure have led to power outages, and created hazards akin to those highlighted in downed power line safety guidance during emergency repairs, jeopardizing the safe operation of these facilities. Grossi emphasized that such disruptions could result in severe nuclear accidents if cooling systems fail.

IAEA's Response and Actions

In response to these threats, the IAEA has been actively involved in monitoring and assessing the situation. Grossi visited Kyiv to inspect electrical substations and discuss safety measures with Ukrainian officials. He underscored the necessity of ensuring uninterrupted power to nuclear plants and the critical role of emergency diesel generators as a last line of defense, and noted that maintaining staffing continuity, including measures such as staff living on site at critical facilities, may be necessary. The IAEA has also postponed the rotation of its mission at the Zaporizhzhia plant due to security concerns, as reported by Reuters.

International Concerns and Diplomatic Efforts

The international community has expressed deep concern over the potential for nuclear accidents in Ukraine, echoing earlier grid overseer warnings about systemic risks in other crises that stress energy systems. The United Nations and various countries have called for the establishment of a demilitarized zone around nuclear facilities to prevent military activities that could compromise their safety. Diplomatic efforts are ongoing to facilitate dialogue between Russia and Ukraine, aiming to ensure the protection of nuclear sites and the safety of surrounding populations.

The Zaporizhzhia Nuclear Power Plant

The Zaporizhzhia Nuclear Power Plant, located in southeastern Ukraine, has been under Russian control since early in the conflict, with Rosatom cooperation agreements reflecting broader nuclear policy priorities that frame Moscow's approach to the sector. The plant consists of six reactors and has been a focal point of international concern due to its size and the potential consequences of any incident. The IAEA has been working to maintain oversight and ensure the plant's safety amid the ongoing conflict.

Potential Consequences of Nuclear Accidents

A nuclear accident at any of Ukraine's nuclear facilities could have catastrophic consequences, including the release of radioactive materials, displacement of populations, and long-term environmental damage, with communities potentially facing weeks without electricity and basic services in the aftermath. The proximity of these plants to densely populated areas further amplifies the risks. The international community continues to monitor the situation closely, emphasizing the need for immediate action to safeguard nuclear facilities.

The ongoing conflict in Ukraine has introduced unprecedented challenges to nuclear safety. The IAEA's warnings and actions underscore the critical need for international cooperation to protect nuclear facilities from the dangers posed by military activities. Ensuring the safety of these sites is paramount to prevent potential disasters that could have far-reaching humanitarian and environmental impacts, and sustained attention to nuclear workers' safety concerns helps maintain operational readiness under strain.


Related News

View more

Metering Pilot projects may be good example for Ontario utilities

Ontario Electricity Pricing Pilot Projects explore alternative rates beyond time-of-use, with LDCs and the Ontario Energy Board testing dynamic pricing, demand management, smart-meter billing, and residential customer choice to enhance service and energy efficiency.


Key Points

Ontario LDC trials testing alternatives to time-of-use rates to improve billing, demand response, and efficiency.

✅ Data shared across LDCs and Ontario Energy Board provincewide

✅ Tests dynamic pricing, peak/off-peak plans, demand management

✅ Insights to enhance customer choice, bills, and energy savings


The results from three electricity pilot projects being offered in southern Ontario will be valuable to utility companies across the province.

Ontario Energy Minister Glenn Thibeault was in Barrie on Tuesday to announce the pilot projects, which will explore alternative pricing plans for electricity customers from three different utility companies, informed by the electricity cost allocation framework guiding rate design.

"Everyone in the industry is watching to see how the pilots deliver.", said Wendy Watson, director of communications for Greater Sudbury Utilities.

"The data will be shared will all the LDCs [local distribution companies] in the province, and probably beyond...because the industry tends to share that kind of information."

Most electricity customers in the province are billed using time-of-use rates, including options like the ultra-low overnight rates that lower costs during off-peak periods, where the cost of electricity varies depending on demand.

The Ontario Energy Board said in a media release that the projects will give residential customers more choice in how much they pay for electricity at different times, reflecting changes for Ontario electricity consumers that expand plan options.

Pilot projects can help improve service

Watson says these kinds of projects give LDCs the chance to experiment and explore new ways of delivering their service, including demand-response initiatives like the Peak Perks program that encourage conservation.

"Any pilot project is a great way to see if in practice if the theory proves out, so I think it's great that the province is supporting these LDCs," she says.

GSU recently completed its own pilot project, the Home Energy Assessment and Retrofit (HEAR) program, which focused on customers who use electric baseboards to heat their homes, amid broader provincial support for electric bills to ease costs."We installed some measures, like programmable thermostats and a few other pieces of equipment into their house," Watson says. "We also made some recommendations about other things that they could do to make their homes more energy efficient."

At the end of the program, GSU provided customers with a report so that they could the see the overall impact on their energy consumption.

Watson says a report on the results of the HEAR program will be released in the near future, for other LDCs interested in new ways to improve their service.

"We think it's incumbent on every LDC...to see what ideas that they can come up with and get approved so they can best serve their customers."


Related News

View more

US January power generation jumps 9.3% on year: EIA

US January power generation climbed to 373.2 TWh, EIA data shows, with coal edging natural gas, record wind output, record nuclear generation, rising hydro, and stable utility-scale solar amid higher Henry Hub prices.


Key Points

US January power generation hit 373.2 TWh; coal led gas, wind and nuclear set records, with solar edging higher.

✅ Coal 31.8% share; gas 29.4%; coal output 118.7 TWh, gas 109.6 TWh.

✅ Wind hit record 26.8 TWh; nuclear record 74.6 TWh.

✅ Total generation 373.2 TWh, highest January since 2014.


The US generated 373.2 TWh of power in January, up 7.9% from 345.9 TWh in December and 9.3% higher than the same month in 2017, Energy Information Administration data shows.

The monthly total was the highest amount in January since 377.3 TWh was generated in January 2014.

Coal generation totaled 118.7 TWh in January, up 11.4% from 106.58 TWh in December and up 2.8% from the year-ago month, consistent with projections of a coal-fired generation increase for the first time since 2014. It was also the highest amount generated in January since 132.4 TWh in 2015.

For the second straight month, more power was generated from coal than natural gas, as 109.6 TWh came from gas, up 3.3% from 106.14 TWh in December and up 19.9% on the year.

However, the 118.7 TWh generated from coal was down 9.6% from the five-year average for the month, due to the higher usage of gas and renewables and a rising share of non-fossil generation in the overall mix.

#google#

Coal made up 31.8% of the total US power generation in January, up from 30.8% in December but down from 33.8% in January 2017.

Gas` generation share was at 29.4% in the latest month, with momentum from record gas-fired electricity earlier in the period, down from 30.7% in December but up from 26.8% in the year-ago month.

In January, the NYMEX Henry Hub gas futures price averaged $3.16/MMBtu, up 13.9% from $2.78/MMBtu averaged in December but down 4% from $3.29/MMBtu averaged in the year-ago month.


WIND, NUCLEAR GENERATION AT RECORD HIGHS

Wind generation was at a record-high 26.8 TWh in January, up 29.3% from 22.8 TWh in December and the highest amount on record, according to EIA data going back to January 2001. Wind generated 7.2% of the nation`s power in January, as an EIA summer outlook anticipates larger wind and solar contributions, up from 6.6% in December and 6.1% in the year-ago month.

Utility-scale solar generated 3.3 TWh in January, up 1.3% from 3.1 TWh in December and up 51.6% on the year. In January, utility-scale solar generation made up 0.9% of US power generation, during a period when solar and wind supplied 10% of US electricity in early 2018, flat from December but up from 0.6% in January 2017.

Nuclear generation was also at a record-high 74.6 TWh in January, up 1.3% month on month and the highest monthly total since the EIA started tracking it in January 2001, eclipsing the previous record of 74.3 TWh set in July 2008. Nuclear generation made up 20% of the US power in January, down from 21.3% in December and 21.4% in the year-ago month.

Hydro power totaled 25.4 TWh in January, making up 6.8% of US power generation during the month, up from 6.5% in December but down from 8.2% in January 2017.


Related News

View more

How Energy Use Has Evolved Throughout U.S. History

U.S. Energy Transition traces the shift from coal and oil to natural gas, nuclear power, and renewables like wind and solar, driven by efficiency, grid modernization, climate goals, and economic innovation.


Key Points

The U.S. Energy Transition is the shift from fossil fuels to cleaner power, driven by tech, policy, and markets.

✅ Shift from coal and oil to gas, nuclear, wind, and solar

✅ Enabled by grid modernization, storage, and efficiency

✅ Aims to cut emissions while ensuring reliability and affordability


The evolution of energy use in the United States is a dynamic narrative that reflects technological advancements, economic shifts, environmental awareness, and societal changes over time. From the nation's early reliance on wood and coal to the modern era dominated by oil, natural gas, and renewable sources, the story of energy consumption in the U.S. is a testament to innovation and adaptation.

Early Energy Sources: Wood and Coal

In the early days of U.S. history, energy needs were primarily met through renewable resources such as wood for heating and cooking. As industrialization took hold in the 19th century, coal emerged as a dominant energy source, fueling steam engines and powering factories, railways, and urban growth. The widespread availability of coal spurred economic development and shaped the nation's infrastructure.

The Rise of Petroleum and Natural Gas

The discovery and commercialization of petroleum in the late 19th century transformed the energy landscape once again. Oil quickly became a cornerstone of the U.S. economy, powering transportation, industry, and residential heating, and informing debates about U.S. energy security in policy circles. Concurrently, natural gas emerged as a significant energy source, particularly for heating and electricity generation, as pipelines expanded across the country.

Electricity Revolution

The 20th century witnessed a revolution in electricity generation and consumption, and understanding where electricity comes from helps contextualize how systems evolved. The development of hydroelectric power, spurred by projects like the Hoover Dam and Tennessee Valley Authority, provided clean and renewable energy to millions of Americans. The widespread electrification of rural areas and the proliferation of appliances in homes and businesses transformed daily life and spurred economic growth.

Nuclear Power and Energy Diversification

In the mid-20th century, nuclear power emerged as a promising alternative to fossil fuels, promising abundant energy with minimal greenhouse gas emissions. Despite concerns about safety and waste disposal, nuclear power plants became a significant part of the U.S. energy mix, providing a stable base load of electricity, even as the aging U.S. power grid complicates integration of variable renewables.

Renewable Energy Revolution

In recent decades, the U.S. has seen a growing emphasis on renewable energy sources such as wind, solar, and geothermal power, yet market shocks and high fuel prices alone have not guaranteed a rapid green revolution, prompting broader policy and investment responses. Advances in technology, declining costs, and environmental concerns have driven investments in clean energy infrastructure and policies promoting renewable energy adoption. States like California and Texas lead the nation in wind and solar energy production, demonstrating the feasibility and benefits of transitioning to sustainable energy sources.

Energy Efficiency and Conservation

Alongside shifts in energy sources, improvements in energy efficiency and conservation have played a crucial role in reducing per capita energy consumption and greenhouse gas emissions. Energy-efficient appliances, building codes, and transportation innovations have helped mitigate the environmental impact of energy use while reducing costs for consumers and businesses, and weather and economic factors also influence demand; for example, U.S. power demand fell in 2023 on milder weather, underscoring the interplay between efficiency and usage.

Challenges and Opportunities

Looking ahead, the U.S. faces both challenges and opportunities in its energy future, as recent energy crisis effects ripple across electricity, gas, and EVs alike. Addressing climate change requires further investments in renewable energy, grid modernization, and energy storage technologies. Balancing energy security, affordability, and environmental sustainability remains a complex task that requires collaboration between government, industry, and society.

Conclusion

The evolution of energy use throughout U.S. history reflects a continuous quest for innovation, economic growth, and environmental stewardship. From wood and coal to nuclear power and renewables, each era has brought new challenges and opportunities in meeting the nation's energy needs. As the U.S. transitions towards a cleaner and more sustainable energy future, leveraging technological advancements and embracing policy solutions, amid debates over U.S. energy dominance, will be essential in shaping the next chapter of America's energy story.


Related News

View more

5,000 homes would be switched to geothermal energy free of charge

Manitoba NDP Geothermal Conversion Program offers full-cost heat pump installation for 5,000 homes, lowering electricity bills, funding contractor training and rebates, and cutting greenhouse gas emissions via geothermal energy administered by Efficiency Manitoba.


Key Points

A plan funding 5,000 home heat pump conversions to cut electricity bills, reduce emissions, and expand installer capacity.

✅ Covers equipment and installation for 5,000 homes

✅ Cuts electricity bills up to 50% vs electric heat

✅ Administered by Efficiency Manitoba; trains contractors


An NDP government would cover the entire cost for 5,000 families to switch their homes to geothermal energy, New Democrats have promised.

If elected on Oct. 3, the NDP will pay for the equipment and installation of new geothermal systems at 5,000 homes, St. James candidate Adrien Sala announced outside a St. Boniface home that previously made the switch. 

The homes that switch to geothermal energy could save as much as 50 per cent on their electricity bills, Sala said.

"It will save you money, it will grow our economy and it will reduce greenhouse gas emissions. And I think we can safely call that a win, win, win," Sala said.

Geothermal energy is derived from heat that is generated within the Earth.

The NDP said each conversion to geothermal heating and cooling would cost an estimated $26,000, and comes as new turbine investments advance in Manitoba, and it would take four years to complete all 5,000 conversions.

The program would be administered through Efficiency Manitoba, the Crown corporation responsible for conserving energy, as Manitoba Hydro's new president navigates changes at the utility. The NDP estimates it will cost $32.5 million annually over the four years, at a time of red ink at Manitoba Hydro as new power generation needs loom. Some of that money would support the training of more contractors who could install geothermal systems.


Subsidies get low pickup: NDP
Sala wouldn't say Wednesday which homeowners or types of homes would be eligible.

He said the NDP's plan would be a first in Canada, even as Ontario's energy plan seeks to address growing demand elsewhere.

"What we've seen elsewhere is where other jurisdictions have used a strict subsidy model, where they try to reduce the cost of geothermal, and while Ontario reviews a halt to natural gas generation to cut emissions, approaches differ across provinces. We really haven't seen a lot of uptake in those other jurisdictions," Sala said.

"This is an attempt at dealing with one of those key barriers for homeowners."

Efficiency Manitoba runs a subsidy program for geothermal energy through ground source heat pumps, supporting using more electricity for heat across the province, valued at up to $2.50 per square foot. It is estimated a 1,600 sq. ft. home switching from an electric furnace to geothermal will receive a rebate of around $4,000 and save around $900 annually on their electricity bills, the Crown corporation said.anitoba homeProgressive Conservative spokesperson Shannon Martin questioned how NDP Leader Wab Kinew can afford his party's numerous election promises.

"He will have no choice but to raise taxes, and history shows the NDP will raise them all," said Martin, the McPhillips MLA who isn't seeking re-election.

Wednesday's announcement was the first for the NDP in which Kinew wasn't present. The party has criticized the Progressive Conservatives for leader Heather Stefanson showing up for only a few announcements a week.

Sala said Kinew was busy preparing for the debate later in the day.

"This stuff is near and dear to Wab's heart, and frankly, I think he's probably hurting that he's not here with us right now."


Related News

View more

Sign Up for Electricity Forum’s Newsletter

Stay informed with our FREE Newsletter — get the latest news, breakthrough technologies, and expert insights, delivered straight to your inbox.

Electricity Today T&D Magazine Subscribe for FREE

Stay informed with the latest T&D policies and technologies.
  • Timely insights from industry experts
  • Practical solutions T&D engineers
  • Free access to every issue

Download the 2025 Electrical Training Catalog

Explore 50+ live, expert-led electrical training courses –

  • Interactive
  • Flexible
  • CEU-cerified