Canada Clean Electricity drives a net-zero grid by 2035, scaling renewables like wind, solar, and hydro, with storage, smart grids, interprovincial transmission, and electrification of vehicles, buildings, and industry to cut emissions and costs.
Key Points
Canada Clean Electricity is a shift to a net-zero grid by 2035 using renewables, storage, and smart grids to decarbonize
✅ Doubles non-emitting generation for electrified transport and heating
✅ Expands wind, solar, hydro with storage and smart-grid balancing
✅ Builds interprovincial lines and faster permitting with Indigenous partners
By Merran Smith and Mark Zacharias
Canada is an electricity heavyweight. In addition to being the world’s sixth-largest electricity producer and third-largest electricity exporter in the global electricity market today, Canada can boast an electricity grid that is now 83 per cent emission-free, not to mention residential electricity rates that are the cheapest in the Group of Seven countries.
Indeed, on the face of it, the country’s clean electricity system appears poised for success. With an abundance of sunshine and blustery plains, Alberta and Saskatchewan, the Prairie provinces most often cited for wind and solar, have wind- and solar-power potential that rivals the best on the continent. Meanwhile, British Columbia, Manitoba, Quebec, and Newfoundland and Labrador have long excelled at generating low-cost hydro power.
So it would only be natural to assume that Canada, with this solid head start and its generous geography, is already positioned to provide enough affordable clean electricity to power our much-touted net-zero and economic ambitions.
But the reality is that Canada, like most countries, is not yet prepared for a world increasingly committed to carbon neutrality, in part because demand for solar electricity has lagged, even as overall momentum grows.
The federal government’s forthcoming Clean Electricity Standard – a policy promised by the governing Liberals during the most recent election campaign and restated for an international audience by Prime Minister Justin Trudeau at the United Nations’ COP26 climate summit – would require all electricity in the country to be net zero by 2035 nationwide, setting a new benchmark. But while that’s an encouraging start, it is by no means the end goal. Electrification – that is, hooking up our vehicles, heating systems and industry to a clean electricity grid – will require Canada to produce roughly twice as much non-emitting electricity as it does today in just under three decades.
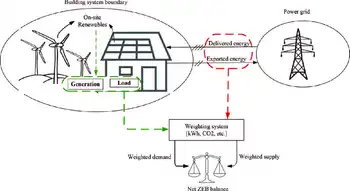
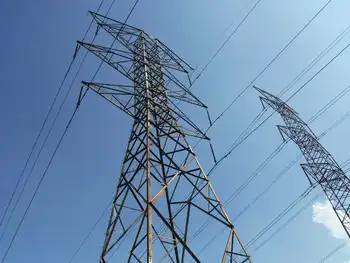
This massive ramp-up in clean electricity will require significant investment from governments and utilities, along with their co-operation on measures and projects such as interprovincial power lines to build an electric, connected and clean system that can deliver benefits nationwide. It will require energy storage solutions, smart grids to balance supply and demand, and energy-efficient buildings and appliances to cut energy waste.
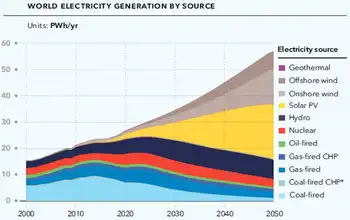
While Canada has mostly relied on large-scale hydroelectric and nuclear power in the past, newer sources of electricity such as solar, wind, geothermal, and biomass with carbon capture and storage will, in many cases, be the superior option going forward, thanks to the rapidly falling costs of such technology and shorter construction times. And yet Canada added less solar and wind generation in the past five years than all but three G20 countries – Indonesia, Russia and Saudi Arabia, with some experts calling it a solar power laggard in recent years. That will need to change, quickly.
In addition, Canada’s Constitution places electricity policy under provincial jurisdiction, which has produced a patchwork of electricity systems across the country that use different energy sources, regulatory models, and approaches to trade and collaboration. While this model has worked to date, given our low consumer rates and high power reliability, collaborative action and a cohesive vision will be needed – not just for a 100-per-cent clean grid by 2035, but for a net-zero-enabling one by 2050.
Right now, it takes too long to move a clean power project from the proposal stage to operation – and far too long if we hope to attain a clean grid by 2035 and a net-zero-enabling one by 2050. This means that federal, provincial, territorial and Indigenous governments must work with rural communities and industry stakeholders to accelerate the approvals, financing and construction of clean energy projects and provide investor certainty.
In doing so, Canada can set a course to carbon neutrality while driving job creation and economic competitiveness, a transition many analyses deem practical and profitable in the long run. Our closest trading partners and many of the world’s largest companies and investors are demanding cleaner goods. A clean grid underpins clean production, just as it underpins our climate goals.
The International Energy Agency estimates that, for the world to reach net zero by 2050, clean electricity generation worldwide must increase by more than 2.5 times between today and 2050. Countries are already plotting their energy pathways, and there is much to learn from each other.
Consider South Australia. The state currently gets 62 per cent of its electricity from wind and solar and, combined with grid-scale battery storage, has not lost a single hour of electricity in the past five years. South Australia expects 100 per cent of its electricity to come from renewable sources before 2030. An added bonus given today’s high energy prices: Annual household electricity costs have declined there by 303 Australian dollars ($276) since 2018.
The transition to clean energy is not about sacrificing our way of life – it’s about improving it. But we’ll need the power to make it happen. That work needs to start now.
Merran Smith is the executive director of Clean Energy Canada, a program at the Morris J. Wosk Centre for Dialogue at Simon Fraser University in Vancouver. Mark Zacharias is a special adviser at Clean Energy Canada and visiting professor at the Simon Fraser University School of Public Policy.
Related News