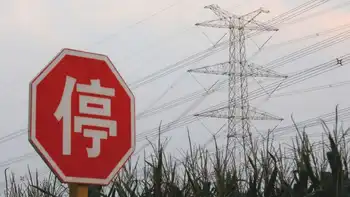
Planners downplay new power line for Toronto

By Toronto Star


Electrical Testing & Commissioning of Power Systems

Our customized live online or in‑person group training can be delivered to your staff at your location.

  • Live Online
  • 12 hours Instructor-led
  • Group Training Available
Regular Price:
$599
Coupon Price:
$499
Reserve Your Seat Today
Picture a city with one big electric wire coming in from the east, and another from the west. That's Toronto.

For years, planners said it wasn't enough to supply the city core. If one wire went down, the other would have trouble supplying enough power to keep the central city's lights on.

Worse, the city itself was split into an eastern and western zone with almost no connection between them. If one wire failed, power from the other couldn't move across the city to back it up.

A third wire was essential, the planners said – and they mapped out a route for a new line running down the Don Valley, along Pape Ave. and into the Portlands.

The July blackout further underlined the city's power vulnerability. But electricity planners now insist that no third line is needed.

"We're not really contemplating it any more," says Ben Chin, vice president of the OPA. "It's not in the works."

Chin points to two major projects that have lessened the need for a third line. The gas-fired Portlands Energy Centre gives Toronto a significant local source of power, Chin notes. Although Portlands by itself, at 550 megawatts, can supply only a fraction of Toronto's peak demand of up to 5,000 megawatts.

Bolstering the new supply, Hydro One has installed a high capacity power line, burrowing under Front St., that connects the eastern and western halves of the city. If lines go down in one neighbourhood, power can now flow more freely across the city to back it up.

Conservation programs now getting under way should also reduce the need for a third line, Chin says.

The Independent Electricity System Operator, a provincial agency that runs the wholesale electricity market, cautiously agrees.

"We're not seeing the same sort of pressure we saw a couple of years ago," says vice president Terry Young.

But the IESO's latest assessment of reliability hedges its bets on Toronto, carefully outlining some specific conditions that must be met to ensure a reliable supply for Toronto, should the third line not be built.

And the Toronto Board of Trade is apprehensive about the decision to walk away from the third line. Chief executive Carol Wilding said the city is likely to see more outages in the future.

"With aging infrastructure and rising demand, Toronto stands to experience more incidents like the blackout of July 5," Wilding said in an e-mail.

"More frequent and lengthy power outages would damage the Toronto region's reputation as a place to invest, and drive businesses to consider locating in other jurisdictions. The development of a third transmission line ensuring reliable electricity supply to Toronto is a necessary component of the city's future economic growth."

Blair Peberdy, vice president of Toronto Hydro, shares some of Wilding's concerns. "There needs to be a more secure supply in Toronto," says Peberdy.

But city councillors asked Toronto Hydro to come up with other plans after seeing strong local opposition to the proposed high-voltage line along Pape Ave.

The utility responded to the request from its sole shareholder by proposing its "500-500" plan. It wants to slice the city's demand for power by 500 megawatts – about 10 per cent – while building 500 megawatts of generating capacity within the city.

The Ontario Clean Air Alliance has said 300 megawatts could come from small scale "combined heat and power" plants: small natural gas plants, with the heat exhausted by the turbines being captured and used to heat nearby buildings, or supply industries with steam.

Hospitals, schools, shopping malls and condominiums could host the plants, it suggests.

Toronto Hydro had hoped to build a wind farm off the Scarborough Bluffs, but that has run into turbulence: The province has proposed banning near-shore wind developments across the province.

While conservation and generation are Toronto Hydro's first priority, the utility won't categorically reject the need for a third line.

"Should that not be sufficient, then other options would have to be explored," Peberdy said.

Related News

Parked Electric Cars Earn $1,530 From Europe's Power Grids

Vehicle-to-Grid Revenue helps EV owners earn income via V2G, demand response, and ancillary services by exporting stored energy, supporting grid balancing, smart charging, and renewable integration with two-way charging infrastructure.


Key Points

Income EV owners earn by selling battery power to the grid for balancing, response, and flexibility services.

✅ Earn up to about $1,530 annually in Denmark trials

✅ Requires V2G-compatible EVs and two-way smart chargers

✅ Provides ancillary services and supports renewable integration


Electric car owners are earning as much as $1,530 a year just by parking their vehicle and feeding excess power back into the grid, effectively selling electricity back to the grid under V2G schemes.

Trials in Denmark carried out by Nissan and Italy’s biggest utility Enel Spa showed how batteries inside electric cars could, using vehicle-to-grid technology, help balance supply and demand at times and provide a new revenue stream for those who own the vehicles.

Technology linking vehicles to the grid marks another challenge for utilities already struggling to integrate wind and solar power into their distribution system. As the use of plug-in cars spreads, grid managers will have to pay closer attention and, with proper management, to when motorists draw from the system and when they can smooth variable flows.

For example, California's grid stability efforts include leveraging EVs as programs expand.

“If you blindingly deploy in the market a massive number of electric cars without any visibility or control over the way they impact the electricity grid, you might create new problems,” said Francisco Carranza, director of energy services at Nissan Europe in an interview with Bloomberg New Energy Finance.


While the Tokyo-based automaker has trials with more than 100 cars across Europe, only those in Denmark are able to earn money by feeding power back into the grid. There, fleet operators collected about 1,300 euros ($1,530) a year using the two-way charge points, said Carranza.

Restrictions on accessing the market in the U.K. means the company needs to reach about 150 cars before they can get paid for power sent back to the grid. That could be achieved by the end of this year, he said.

“It’s feasible,” he said. “It’s just a matter of finding the appropriate business model to deploy the business wide-scale.’’

Electric car demand globally is expected to soar, challenging state power grids and putting further pressure on grid operators to find new ways of balancing demand. Power consumption from vehicles will grow to 1,800 terawatt-hours in 2040 from just 6 terawatt-hours now, according to Bloomberg New Energy Finance.


Related News

View more

Thermal power plants’ PLF up on rising demand, lower hydro generation

India Coal Power PLF rose as capacity utilisation improved on rising peak demand and hydropower shortfall; thermal plants lifted plant load factor, IPPs lagged, and generation beat program targets amid weak rainfall and slower snowmelt.


Key Points

Coal plant load factor in India rose in May on higher demand and weak hydropower, with generation beating targets.

✅ PLF rose to 65.3% as demand climbed

✅ Hydel generation fell 14% YoY on poor rainfall

✅ IPP PLF at 57.8%, below 60% debt comfort


Capacity utilisation levels of coal-based power plants improved in May because of a surge in electricity demand and lower generation from hydroelectric sources. The plant load factor (PLF) of thermal power plants went up to 65.3% in the month, 1.7 percentage points higher than the year-ago period.

While PLFs of central and state government-owned plants were 75.5% and 64.5%, respectively, the same for independent power producers (IPPs) stood at 57.8%, even as coal and electricity shortages eased across the market. Though PLFs of IPPs were higher than May 2017 levels, it failed to cross the 60% mark, which eases debt servicing capabilities of power generation assets.

Thermal power plants generated 96,580 million units (MU) in May, 4% more than the programme set for the month and 5.2% higher than last year, partly supported by higher imported coal volumes in the market. On the other hand, hydel plants produced 10,638 MU, 10% lower than the target, reflecting a 14% decline from last year.

#google#

Peak demand of power on the last day of the month was 1,62,132 MW, 4.3% higher than the demand registered in the same day a year ago, underscoring India's position as the third-largest electricity producer globally.

According to sources, hydropower plants have been generating lesser than expected electricity due to inadequate rainfall and snow melting at a slower pace than previous years, even as the US reported a power generation jump year on year. Data for power generation from renewable sources have not been made available yet.


Related News

View more

Scottish Wind Delivers Equivalent Of 98% Of Country’s October Electricity Demand

Scotland Wind Energy October saw renewables supply the equivalent of 98 percent of electricity demand, as onshore wind outpaced National Grid needs, cutting emissions and powering households, per WWF Scotland and WeatherEnergy.


Key Points

A monthly update showing Scottish onshore wind met the equivalent of 98% of electricity demand in October.

✅ 98% of monthly electricity demand equivalent met by wind

✅ 16 days exceeded total national demand, per data

✅ WWF Scotland and WeatherEnergy cited; lower emissions


New figures publicized by WWF Scotland have revealed that wind energy generated the equivalent of 98% of the country’s electricity demand in October, or enough electricity to power millions of Scottish homes across the country.

Scotland has regularly been highlighted as a global wind energy leader, and over the last few years has repeatedly reported record-breaking months for wind generation. Now, it’s all very well and good to say that Scottish wind delivered 98% of the country’s electricity demand, but the specifics are a little different — hence why WWF Scotland always refers to it as wind providing “the equivalent of 98%” of Scotland’s electricity demand. That’s why it’s worth looking at the statistics provided by WWF Scotland, sourced from WeatherEnergy, part of the European EnergizAIR project:

  • National Grid demand for the month – 1,850,512 MWh
  • What % of this could have been provided by wind power across Scotland – 98%
  • Best day – 23rd October 2018, generation was 105,900.94 MWh, powering 8.72m homes, 356% of households. Demand that day was 45,274.5MWh – wind generation was 234% of that.
  • Worst day – 18th October 2018 when generation was 18,377.71MWh powering 1,512,568 homes, 62% of households. Demand that day was 73,628.5MWh – wind generation was 25%
  • How many days generation was over 100% of households – 27
  • How many days generation was over 100% of demand – 16

“What a month October proved to be, with wind powering on average 98 per cent of Scotland’s entire electricity demand for the month, at a time when wind became the UK’s main power source and exceeding our total demand for a staggering 16 out of 31 days,” said Dr Sam Gardner, acting director at WWF Scotland.

“These figures clearly show wind is working, it’s helping reduce our emissions and is the lowest cost form of new power generation. It’s also popular, with a recent survey also showing more and more people support turbines in rural areas. That’s why it’s essential that the UK Government unlocks market access for onshore wind at a time when we need to be scaling up electrification of heat and transport.”

Alex Wilcox Brooke, Weather Energy Project Manager at Severn Wye Energy Agency, added: “Octobers figures are a prime example of how reliable & consistent wind production can be, with production on 16 days outstripping national demand.”


Related News

View more

Bomb Cyclone Leaves Half a Million Without Power in Western Washington

Western Washington Bomb Cyclone unleashed gale-force winds, torrential rain, and coastal flooding, causing massive power outages from Seattle to Tacoma; storm surge, downed trees, and blocked roads hindered emergency response and infrastructure repairs.


Key Points

A rapidly deepening storm with severe winds, rain, flooding, and major power outages across Western Washington.

✅ Rapid barometric pressure drop intensified the system

✅ Gale-force winds downed trees and power lines

✅ Coastal flooding and storm surge disrupted transport


A powerful "bomb cyclone" recently hit Western Washington, causing widespread destruction across the region. The intense storm left more than half a million residents without power, similar to B.C. bomb cyclone outages seen to the north, with outages affecting communities from Seattle to Olympia. This weather phenomenon, marked by a rapid drop in atmospheric pressure, unleashed severe wind gusts, heavy rain, and flooding, causing significant disruption to daily life.

The bomb cyclone, which is a rapidly intensifying storm, typically features a sharp drop in barometric pressure over a short period of time. This creates extreme weather conditions, including gale-force winds, torrential rain, and coastal flooding, as seen during California storm impacts earlier in the season. In Western Washington, the storm struck just as the region was beginning to prepare for the winter season, catching many off guard with its strength and unpredictability.

The storm's impact was immediately felt as high winds downed trees, power lines, and other infrastructure. By the time the worst of the storm had passed, utility companies had reported widespread power outages, with more than 500,000 customers losing electricity. The outages were particularly severe in areas like Seattle, Tacoma, and the surrounding communities. Crews worked tirelessly in difficult conditions to restore power, but many residents faced extended outages, underscoring US grid climate vulnerabilities that complicate recovery efforts, with some lasting for days due to the scope of the damage.

The power outages were accompanied by heavy rainfall, leading to localized flooding. Roads were inundated, making it difficult for first responders and repair crews to reach affected areas. Emergency services were stretched thin as they dealt with downed trees, blocked roads, and flooded neighborhoods. In some areas, floodwaters reached homes, forcing people to evacuate. In addition, several schools were closed, and public transportation services were temporarily halted, leaving commuters stranded and businesses unable to operate.

As the storm moved inland, its effects continued to be felt. Western Washington’s coastal regions were hammered by high waves and storm surges, further exacerbating the damage. The combination of wind and rain also led to hazardous driving conditions, prompting authorities to advise people to stay off the roads unless absolutely necessary.

While power companies worked around the clock to restore electricity, informed by grid resilience strategies that could help utilities prepare for future events, challenges persisted. Fallen trees and debris blocked access to repair sites, and the sheer number of outages made it difficult for crews to restore power quickly. Some customers were left in the dark for days, forced to rely on generators, candles, and other makeshift solutions. The storm's intensity left a trail of destruction, requiring significant resources to address the damages and rebuild critical infrastructure.

In addition to the immediate impacts on power and transportation, the bomb cyclone raised important concerns about climate change and the increasing frequency of extreme weather events. Experts note that storms like these are becoming more common, with rapid intensification leading to more severe consequences and compounding pressures such as extreme-heat electricity costs for households. As the planet warms, scientists predict that such weather systems will continue to grow in strength, posing greater challenges to cities and regions that are not always prepared for such extreme events.

In the aftermath of the storm, local governments and utility companies faced the daunting task of not only restoring services but also assessing the broader impact of the storm on communities. Many areas, especially those hit hardest by flooding and power outages, will require substantial recovery efforts. The devastation of the bomb cyclone highlighted the vulnerability of infrastructure in the face of rapidly changing weather patterns and water availability, as seen in BC Hydro drought adaptations nearby, and reinforced the need for greater resilience in the face of future storms.

The storm's impact on the Pacific Northwest is a reminder of the power of nature and the importance of preparedness. As Western Washington recovers, there is a renewed focus on strengthening infrastructure, including expanded renewable electricity to diversify supply, improving emergency response systems, and ensuring that communities are better equipped to handle the challenges posed by increasingly severe weather events. For now, residents remain hopeful that the worst is behind them and are working together to rebuild and prepare for whatever future storms may bring.

The bomb cyclone has left an indelible mark on Western Washington, but it also serves as a call to action for better preparedness, more robust infrastructure, and a greater focus on combating climate change to mitigate the impact of such extreme weather in the future.


Related News

View more

Top Senate Democrat calls for permanent renewable energy, storage, EV tax credits

Clean Energy Tax Incentives could expand under Democratic proposals, including ITC, PTC, and EV tax credits, boosting renewable energy, energy storage, and grid modernization within a broader infrastructure package influenced by Green New Deal goals.


Key Points

Federal incentives like ITC, PTC, and EV credits that cut costs and speed renewables, storage, and grid upgrades.

✅ Proposes permanence for ITC, PTC, and EV tax credits

✅ Could accelerate solar, wind, storage, and grid upgrades

✅ Passage depends on bipartisan infrastructure compromise


The 115th U.S. Congress has not even adjourned for the winter, and already a newly resurgent Democratic Party is making demands that reflect its majority status in the U.S. House come January.

Climate appears to be near the top of the list. Last Thursday, Senator Chuck Schumer (D-NY), the Democratic Leader in the Senate, sent a letter to President Trump demanding that any infrastructure package taken up in 2019 include “policies and funding to transition to a clean energy economy and mitigate the risks that the United States is already facing due to climate change.”

And in a list of policies that Schumer says should be included, the top item is “permanent tax incentives for domestic production of clean electricity and storage, energy efficient homes and commercial buildings, electric vehicles, and modernizing the electric grid.”

In concrete terms, this could mean an extension of the Investment Tax Credit (ITC) for solar and energy storage, the Production Tax Credit (PTC) for wind and the federal electric vehicle (EV) tax credit program as well.


Pressure from the Left

This strong statement on climate change, clean energy and infrastructure investment comes as at least 30 incoming members of the U.S. House of Representatives have signed onto a call for the creation of a committee to explore a “Green New Deal” and to move the nation to 100% renewable energy by 2030.*

It also comes as Schumer has come under fire by activists for rumors that he plans to replace Senator Maria Cantwell (D-Washington) with coal state Democrat Joe Manchin (D-West Virginia) as the top Democrat on the Senate Energy and Natural Resources Committee.

As such, one possible way to read these moves is that centrist leaders like Schumer are responding to pressure from an energized and newly elected Left wing of the Democratic Party. It is notable that Schumer’s program includes many of the aims of the Green New Deal, while avoiding any explicit use of that phrase.


Implications of a potential ITC extension

The details of levels and timelines are important here, particularly for the ITC.

The ITC was set to expire at the end of 2016, but was extended in legislative horse-trading at the end of 2015 to a schedule where it remains at 30% through the end of 2019 and then steps down for the next three years, and disappears entirely for residential projects. Since that extension the IRS has issued guidance around the use of co-located energy storage, as well as setting a standard under which PV projects can claim the ITC for the year that they begin construction.

This language around construction means that projects can start work in 2019, complete in 2023 and still claim the 30% ITC, and this may be why we at pv magazine USA are seeing an unprecedented boom in project pipelines across the United States.

Of course, if the ITC were to become permanent some of those projects would be pushed out to later years. But as we saw in 2016, despite an extension of the ITC many projects were still completed before the deadline, leading to the largest volume of PV installed in the United States in any one year to date.

This means that if the ITC were extended by the end of 2020, we could see the same thing all over again – a boom in projects created by the expected sunset, and then after a slight lull a continuation of growth.

Or it is possible that a combination of raw economics, increased investor and utility interest, and accelerating renewable energy mandates will cause solar growth rates to continue every year, and that any changes in the ITC will only be a bump against a larger trend.

While the basis for expiration of the EV tax credit is the number of vehicles sold, not any year, both the battery storage and EV industries, which many see at an inflection point, could see similar effects if the ITC and EV tax credits are made permanent.


Will consensus be reached?

It is also unclear that any such infrastructure package will be taken up by Republicans, or that both parties will be able to come to a compromise on this issue. While the U.S. Congress passed an infrastructure bill in 2017, given the sharp and growing differences between the two parties, and divergent trade approaches such as the 100% tariff on Chinese-made EVs, it is not clear that they will be able to come to a meaningful compromise during the next two years.


Related News

View more

Solar PV and wind power in the US continue to grow amid favourable government plans

US Renewable Power Outlook 2030 projects surging capacity, solar PV and wind growth, grid modernization, and favorable tax credits, detailing market trends, CAGR, transmission expansion, and policy drivers shaping clean energy generation and consumption.


Key Points

A forecast of US power capacity, generation, and consumption, highlighting solar, wind, tax credits, and grid modernization.

✅ Targets 48.4% renewable capacity share by 2030

✅ Strong growth in solar PV and onshore wind installations

✅ Investment and tax credits drive grid and transmission upgrades


GlobalData’s latest report, ‘United States Power Market Outlook to 2030, Update 2021 – Market Trends, Regulations, and Competitive Landscape’ discusses the power market structure of the United States and provides historical and forecast numbers for capacity, generation and consumption up to 2030. Detailed analysis of the country’s power market regulatory structure, competitive landscape and a list of major power plants are provided. The report also gives a snapshot of the power sector in the country on broad parameters of macroeconomics, supply security, generation infrastructure, transmission and distribution infrastructure, about a quarter of U.S. electricity from renewables in recent years, electricity import and export scenario, degree of competition, regulatory scenario, and future potential. An analysis of the deals in the country’s power sector is also included in the report.

Renewable power held a 19% share of the US’s total power capacity in 2020, and in that year renewables became the second-most prevalent source in the U.S. electricity mix by generation; this share is expected to increase significantly to 48.4% by 2030. Favourable policies introduced by the US Government will continue to drive the country’s renewable sector, particularly solar photovoltaics (PV) and wind power, with wind now the most-used renewable source in the U.S. generation mix. Installed renewable capacity* increased from 16.5GW in 2000 to 239.2GW in 2020, growing at a compound annual growth rate (CAGR) of 14.3%. By 2030, the cumulative renewable capacity is expected to rise to 884.6GW, growing at a CAGR of 14% from 2020 to 2030. Despite increase in prices of renewable equipment, such as solar modules, in 2021, the US renewable sector will show strong growth during the 2021 to 2030 period as this increase in equipment prices are short term due to supply chain disruptions caused by the Covid-19 pandemic.

The expansion of renewable power capacity during the 2000 to 2020 period has been possible due to the introduction of federal schemes, such as Production Tax Credits, Investment Tax Credits and Manufacturing Tax Credits. These have massively aided renewable installations by bringing down the cost of renewable power generation and making it at par with power generated from conventional sources. Over the last few years, the cost of solar PV and wind power installations has declined sharply, and by 2023 wind, solar, and batteries made up most of the utility-scale pipeline across the US, highlighting investor confidence. Since 2010, the cost of utility-scale solar PV projects decreased by around 82% while onshore wind installations decreased by around 39%. This has supported the rapid expansion of the renewable market. However, the price of solar equipment has risen due to an increase in raw material prices and supply shortages. This may slightly delay the financing of some solar projects that are already in the pipeline.

The US will continue to add significant renewable capacity additions during the forecast period as industry outlooks point to record solar and storage installations over the coming years, to meet its target of reaching 80% clean energy by 2030. In November 2021, President Biden signed a $1tr Infrastructure Bill, within which $73bn is designated to renewables. This includes not just renewable capacity building, but also strengthening the country’s power grid and laying new high voltage transmission lines, both of which will be key to driving solar and wind power capacity additions as wind power surges in the U.S. electricity mix nationwide.

The US was one of the worst hit countries in the world due to the Covid-19 pandemic in 2020. With respect to the power sector, the electricity consumption in the country declined by 2.5% in 2020 as compared to 2019, even as renewable electricity surpassed coal in 2022 in the generation mix, highlighting continued structural change. Power plants that were under construction faced delays due to unavailability of components due to supply chain disruptions and unavailability of labour due to travel restrictions.

According to the US Energy Information Administration, 61 power projects, having a total capacity of 2.4GWm which were under construction during March and April 2020 were delayed because of the Covid-19 pandemic. Among renewable power technologies, solar PV and wind power projects were the most badly affected due to the pandemic.

In March and April 2020, 53 solar PV projects, having a total capacity of 1.3GW, and wind power projects, having a total capacity of 1.2GW, were delayed due to the Covid-19 pandemic. Moreover, several states suspended renewable energy auctions due to the pandemic.

For instance, New York State Energy Research and Development Authority (NYSERDA) had issued a new offshore wind solicitation for 1GW and up to 2.5GW in April 2020, but this was suspended due to the Covid-19 pandemic. In July 2020, the authority relaunched the tender for 2.5GW of offshore wind capacity, with a submission deadline in October 2020.

To ease the financial burden on consumers during the pandemic, more than 1,000 utilities in the country announced disconnection moratoria and implemented flexible payment plans. Duke Energy, American Electric Power, Dominion Power and Southern California Edison were among the major utilities that voluntarily suspended disconnections.


Related News

View more

Sign Up for Electricity Forum’s Newsletter

Stay informed with our FREE Newsletter — get the latest news, breakthrough technologies, and expert insights, delivered straight to your inbox.

Electricity Today T&D Magazine Subscribe for FREE

Stay informed with the latest T&D policies and technologies.
  • Timely insights from industry experts
  • Practical solutions T&D engineers
  • Free access to every issue

Download the 2025 Electrical Training Catalog

Explore 50+ live, expert-led electrical training courses –

  • Interactive
  • Flexible
  • CEU-cerified