BMW Hydrogen Fuel Cell Strategy positions iX5 and eDrive for zero-emission mobility, leveraging fuel cells, fast refueling, and hydrogen infrastructure as an alternative to BEVs, diversifying drivetrains across premium segments globally, rapidly.
Key Points
BMW's plan to commercialize hydrogen fuel-cell drivetrains like iX5 eDrive for scalable, zero-emission mobility.
✅ Fuel cells enable fast refueling and long range with water vapor only.
✅ Reduces reliance on lithium and cobalt via recyclable materials.
✅ Targets premium SUV iX5; limited pilots before broader rollout.
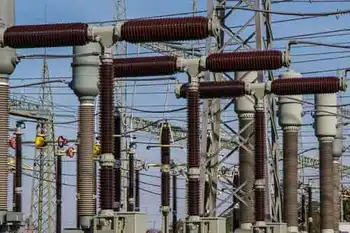
BMW is hanging in there with hydrogen, a stance mirrored in power companies' hydrogen outlook today. That’s what Oliver Zipse, the chairperson of BMW, reiterated during an interview last week in Goodwood, England.
“After the electric car, which has been going on for about 10 years and scaling up rapidly, the next trend will be hydrogen,” he says. “When it’s more scalable, hydrogen will be the hippest thing to drive.”
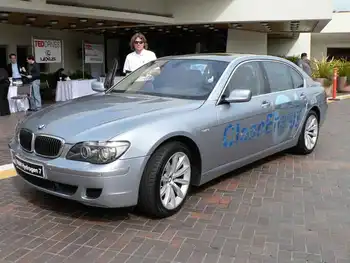
BMW has dabbled with the idea of using hydrogen for power for years, even though it is obscure and niche compared to the current enthusiasm surrounding vehicles powered by electricity. In 2005, BMW built 100 “Hydrogen 7” vehicles that used the fuel to power their V12 engines. It unveiled the fuel cell iX5 Hydrogen concept car at the International Motor Show Germany in 2021.
In August, the company started producing fuel-cell systems for a production version of its hydrogen-powered iX5 sport-utility vehicle. Zipse indicated it would be sold in the United States within the next five years, although in a follow-up phone call a spokesperson declined to confirm that point. Bloomberg previously reported that BMW will start delivering fewer than 100 of the iX5 hydrogen vehicles to select partners in Europe, the U.S., and Asia, where Asia leads on hydrogen fuel cells today, from the end of this year.
All told, BMW will eventually offer five different drivetrains to help diversify alternative-fuel options within the group, as hybrids gain renewed momentum in the U.S., Zipse says.
“To say in the U.K. about 2030 or the U.K. and in Europe in 2035, there’s only one drivetrain, that is a dangerous thing,” he says. “For the customers, for the industry, for employment, for the climate, from every angle you look at, that is a dangerous path to go to.”
Zipse’s hydrogen dreams could even extend to the group’s crown jewel, Rolls-Royce, which BMW has owned since 1998. The “magic carpet ride” driving style that has become Rolls-Royce’s signature selling point is flexible enough to be powered by alternatives to electricity, says Rolls-Royce CEO Torsten Müller-Ötvös.
“To house, let’s say, fuel cell batteries: Why not? I would not rule that out,” Müller-Ötvös told reporters during a roundtable conversation in Goodwood on the eve of the debut of the company’s first-ever electric vehicle, Spectre. “There is a belief in the group that this is maybe the long-term future.”
Such a vehicle would contain a hydrogen fuel-cell drivetrain combined with BMW’s electric “eDrive” system. It works by converting hydrogen into electricity to reach an electrical output of up to 125 kW/170 horsepower and total system output of nearly 375hp, with water vapor as the only emission, according to the brand.
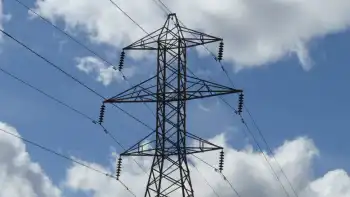
Hydrogen’s big advantage over electric power, as EVs versus fuel cells debates note, is that it can supply fuel cells stored in carbon-fiber-reinforced plastic tanks. “There will [soon] be markets where you must drive emission-free, but you do not have access to public charging infrastructure,” Zipse says. “You could argue, well you also don’t have access to hydrogen infrastructure, but this is very simple to do: It’s a tank which you put in there like an old [gas] tank, and you recharge it every six months or 12 months.”
Fuel cells at BMW would also help reduce its dependency on raw materials like lithium and cobalt, because the hydrogen-based system uses recyclable components made of aluminum, steel, and platinum.
Zipse’s continued commitment to prioritizing hydrogen has become an increasingly outlier position in the automotive world. In the last five years, electric-only vehicles have become the dominant alternative fuel — as the age of electric cars dawns ahead of schedule — if not yet on the road, where fewer than 3% of new cars have plugs, at least at car shows and new-car launches.
Rivals Mercedes-Benz and Audi scrapped their own plans to develop fuel cell vehicles and instead have poured tens of billions of dollars into developing pure-electric vehicle, including Daimler's electrification plan initiatives. Porsche went public to finance its own electric aspirations.
BMW will make half of all new-car sales electric by 2030 across the group, with many expecting most drivers to go electric within a decade, which includes MINI and Rolls-Royce.
Related News